XYLD - XYLD Vs. RYLD: Comparing Different Market-Cap Call Writing ETFs
2023-05-10 08:00:00 ET
Summary
- The Global X S&P 500 Covered Call ETF invests based on the Cboe S&P 500 BuyWrite Index.
- The Global X Russell 2000 Covered Call ETF invests based on the Cboe Russell 2000 BuyWrite Index.
- This article will review both ETFs, each index used, and compared them against each other and their non-option-writing equivalent.
- For income seekers, both ETFs are better than the straight ETF but that comes at the cost of CAGR. They did outperform the HYG ETF for both return and income.
(This article was co-produced with Hoya Capital Real Estate )
Introduction
There is a growing interest in funds that write Call options (and sometimes Puts) against a basket of holdings. There are even fixed income versions of this strategy. A common feature seems to be investors give up some return to earn the extra income these funds provide. While CDs paid almost nothing, there was more reason income-seeking investors would make that choice but with 1-year CDs near 5%, maybe not so much. That said, those wanting some equity exposure still might prefer this strategy as they should provide better results in weak or down markets.
Instead of comparing two such funds writing Calls against the same universe of stocks, here I compare the Large-Cap strategy of Global X S&P 500 Covered Call ETF ( XYLD ) to the Mid/Small-Cap strategy of the Global X Russell 2000 Covered Call ETF ( RYLD ).
Global X S&P 500 Covered Call ETF review
Seeking Alpha describes this ETF as:
The Global X S&P 500 Covered Call ETF employs long/short strategy and uses derivatives such as options to create its portfolio. It invests in growth and value stocks of large-cap companies. It seeks to track the performance of the CBOE S&P 500 BuyWrite Index . XYLD started in 2013.
Source: seekingalpha.com XYLD
XYLD has amassed $2.6b in assets and has a TTM Yield over 12%. Typical of an options ETF, the fees are on the high side at 60bps.
Index review
Here is one definition I found on the index used by XYLD:
The BXM Index measures the total rate of return of a hypothetical "covered call" strategy applied to the S&P 500 Index. This strategy consists of a hypothetical portfolio consisting of a "long" position indexed to the S&P 500 Index on which are deemed sold a succession of one-month, at-the-money call options on the S&P 500 Index listed on the Cboe exchange. We refer to this hypothetical portfolio as the "covered S&P 500 Index portfolio.".
Source: cdn.cboe.com
XYLD holdings review
globalxetfs.com XYLD: sectors
I will discuss sectors when comparing ETFs. The current option exposure is the following.
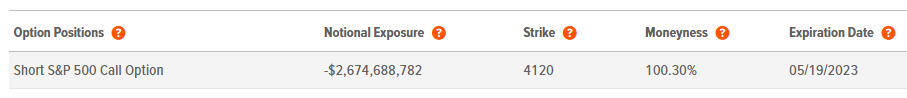
As of this writing, the option is ITM as the S&P 500 Index closed at 4136.
Unlike RYLD, XYLD does not include exposure to any S&P 500 ETF; just each stock within the S&P 500 Index based on its index weight.
globalxetfs.com; compiled by Author
XYLD distribution review
There were two months in 2020 where the payout was too small to register on the above chart. Seeking Alpha gives XYLD a "A+" for the payout results.
seekingalpha.com XYLD scorecard
Global X Russell 2000 Covered Call ETF Review
Seeking Alpha describes this ETF as:
The investment seeks to provide investment results that correspond generally to the price and yield performance, before fees and expenses, of the Cboe Russell 2000 BuyWrite Index . The fund invests at least 80% of its total assets in component securities of the index or in investments that have economic characteristics that are substantially identical to the economic characteristics of such component securities. RYLD started in 2019.
Source: seekingalpha.com RYLD
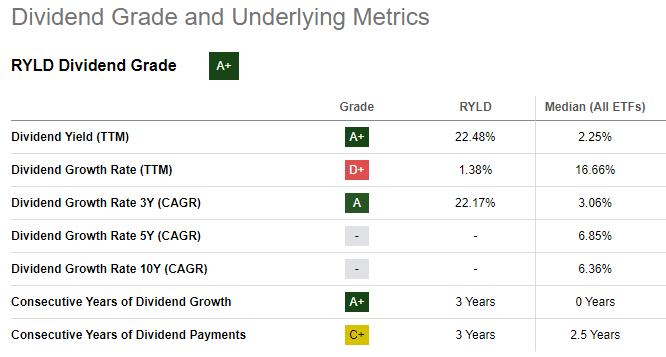
RYLD has $1.37b in AUM and also comes with 60bps in fees. The TTM Yield is shown as over 22%, above prior years where the average yield was closer to 10%.
Index review
Cboe describes this index as:
The BXR Index measures the total rate of return of a hypothetical "covered call" strategy applied to the Russell 2000. This strategy consists of a hypothetical portfolio consisting of a "long" position indexed to the Russell 2000 Index on which are deemed sold a succession of one-month, at-the-money call options on the Russell 2000 Index listed on the Cboe exchange. We refer to this hypothetical portfolio as the "covered Russell 2000 Index portfolio."
Source: cboe.com BXR index
RYLD holdings review
globalxetfs.com RYLD sectors
The current option exposure is the following.
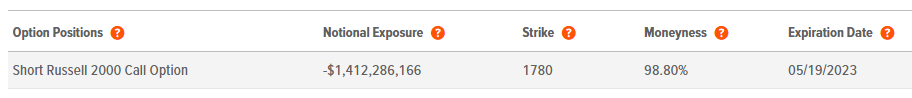
As of this writing, the option is OTM as the underlying index ( RTY ) closed at 1760. Along with the option, RYLD holds a R2000 ETF and every stock within the R2000 index.
globalxetfs.com; compiled by Author
RYLD distribution review
When you use the above chart with the price chart, the reason for the 22% "yield" comes into focus: RYLD is down 20% over the past twelve months. Again, Seeking Alpha grades RYLD's payout history with a "A+" grade.
seekingalpha.com RYLD scorecard
Comparing ETFs
I start with the obvious, market-cap allocations which shows no surprise.
/advisors.vanguard.com compare tool
Next, I cover the sector differences as promised.
ETFRC.com
Not a surprise, with XYLD being Large-Cap invested, has a much higher allocation to Technology and Consumer Services stocks. RYLD is overweight compared to XYLD in Financials, not a good sector currently, and Industrials, which could be hurt if the US sinks into a recession later this year or next.
From Fidelity, I collected these equity data points; with the one shaded in Green as being the better value.
Fidelity.com
For the next chart, I added the non-option version for each ETF reviewed here.
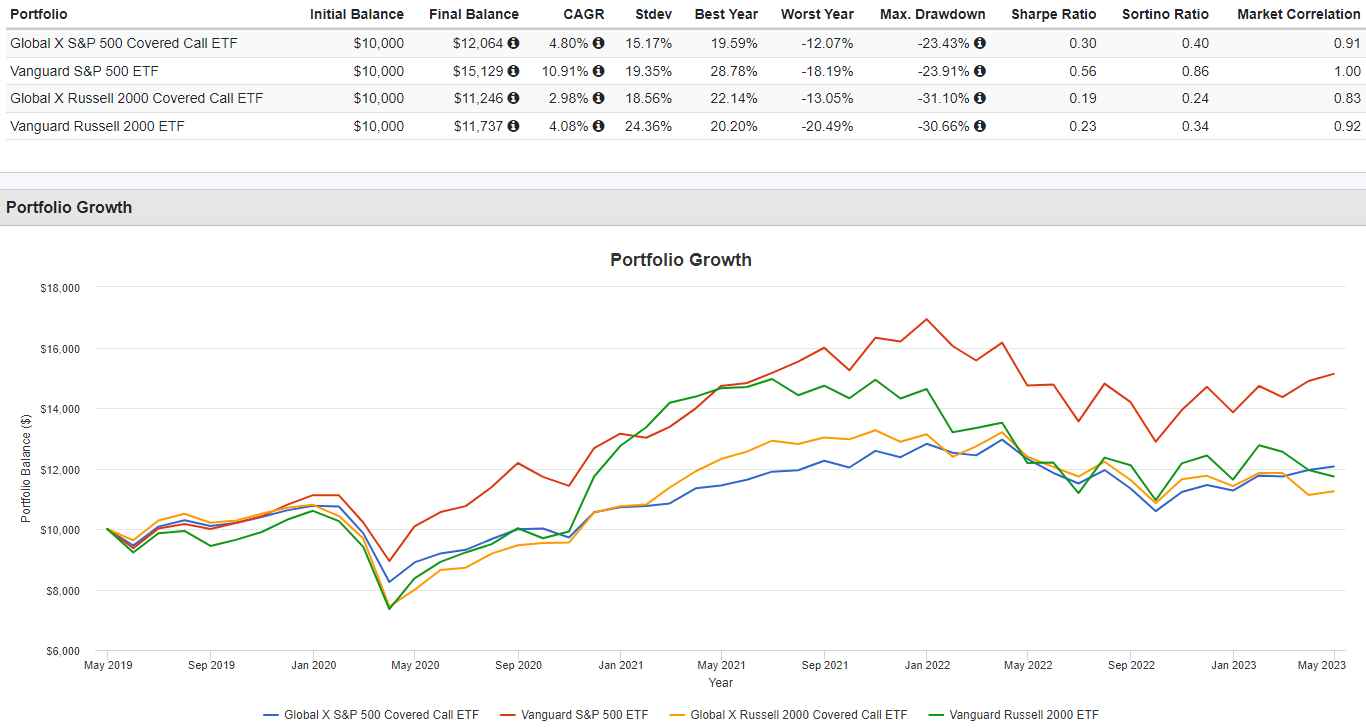
- As past reviews have shown, both option-writing ETFs trail their basic counterpart in CAGR but did have lower StdDev and Beta values.
- Probably related to the strength of the underlying stocks, XYLD did better in CAGR and StdDev versus RYLD.
- During the time since 2019, VOO did better than VTWO by a wide margin, which helped XYLD's return be superior to RYLD's.
- RYLD gave up less CAGR compared to its non-option ETF than XYLD did.
Portfolio strategy
In February 2012 the Asset Consulting Group published a six-page paper -- " An Analysis of Index Option Writing for Liquid Enhanced Risk-Adjusted Returns ". Key findings of the paper include:
Total Growth: Total growth for indexes since mid-1986 was 1153% for PUT Index, 830% for BXM Index, 807% for S&P 500® Index, and 368% for CLL Index (Exhibits 2 and 6).
Lower Volatility: The PUT, BXM, and CLL indices all had volatility that was about 30 percent lower than the volatility of the S&P 500 Index (Exhibit 4).
Left-tail Risk: Over the past 25 years, the worst monthly loss for the S&P 500 Index was a decline of 21.5 percent, compared to a relatively modest 8.6-percent monthly decline for the CLL Index (Exhibit 8e).
Risk-adjusted Returns: One measure of risk-adjusted returns, the Sortino Ratio, was 0.90 for the PUT Index, 0.75 for BXY, 0.71 for BXM, 0.50 for S&P 500, and 0.31 for CLL Index (Exhibits 10 and 11). Please note that all the indexes had negative skewness.
Monthly Premium Income: The average for the gross monthly premiums collected by the BXM Index was 1.8 percent. The index options usually were richly priced (Exhibits 12 and 13).
Exhibit numbers refer to their location within the six-page paper linked above.
Final thoughts
A major input for valuing options is volatility. I like to look at the S&P VIX Index ( VIX ) as a proxy since each ticker has its own level. What I have found in my own option writing strategies is that indeed the premiums available, thus possible ROIs, are down considerably from last summer.
As has been pointed out, not just for this pair, but almost every option writing strategy provides more income but less return. For some investors, that trade-off is okay. To see if income investors would have been better off owning "junk bonds" instead, I compared XYLD to the iShares iBoxx $ High Yield Corporate Bond ETF ( HYG ).
The answer is a resounding NO! XYLD provided both a higher CAGR but also more income to the investor.
For income seekers, both ETFs are better than the straight ETF but that comes at the cost of CAGR. They did outperform the HYG ETF for both return and income.
For further details see:
XYLD Vs. RYLD: Comparing Different Market-Cap Call Writing ETFs