OXLC - YYY: A High-Yield High-Risk Fund
2023-05-02 07:30:00 ET
Summary
- Amplify High Income ETF is an exchange-traded fund of closed-end funds implementing a rules-based strategy.
- The yield is attractive, but history shows a steady decay in value and distributions.
- A high rate environment doesn’t help.
- Bonus: a solution to avoid capital decay in CEFs.
Capital erosion is as real as coastal erosion.
I wrote in November an article on Amplify High Income ETF ( YYY ). I revisit this exchanged-traded fund with updated data and confirm my opinion.
YYY strategy and portfolio
Amplify High Income ETF is an exchange-traded fund, or ETF, of closed-end funds, or CEFs, tracking the ISE High Income Index since 6/21/2013. It has 45 holdings and a 12-month trailing distribution yield of 12.37%. Such a high yield clearly targets income-seeking investors. Like all funds holding CEFs, the expense ratio is very high: 0.50% in ETF management fees plus 2.22% in held fund expenses, totaling 2.72%.
As described by Amplify ETFs , the underlying index
selects CEFs ranked highest overall by ISE in the following factors: Yield, Discount to Net Asset Value ((NAV)), and Liquidity. This investment approach results in a portfolio which contains a variety of asset classes, investment strategies and asset managers.
Eligible funds must be listed in the U.S., have a market capitalization of at least $500 million and an average daily trading value of at least $1 million. They are ranked and selected using 3 factors: yield, discount to NAV and liquidity. Constituents are weighted based on their ranks, with some adjustments. The index is reconstituted twice a year, in January and July.
The fund has changed names in 2019, but it has kept the same ticker and methodology. In July 2021, it changed methodologies. The most notable modifications are an increase in the number of holdings from 30 to 45, a constituent weight capped at 3%, and a semi-annual reconstitution (instead of annual).
The top 10 holdings, listed below, represent 31.9% of asset value. As of writing, the heaviest position weighs 3.58%.
| TICKER |
| NAME |
| WEIGHT |
| OXFORD LANE CAP CORP COM |
| 3.58% |
| PIMCO DYNAMIC INCOME FD SHS |
| 3.35% |
| DOUBLELINE INCOME SOLUTIONS FD COM |
| 3.28% |
| THORNBURG INCM BUILDER OPP TR COM |
| 3.18% |
| LIBERTY ALL STAR EQUITY FD SH BEN INT |
| 3.16% |
| PIMCO DYNAMIC INCOME OPRNTS FD COM BEN SHS |
| 3.15% |
| INVESCO SR INCOME TR COM |
| 3.07% |
| DOUBLELINE YIELD OPPORTUNITIES COM |
| 3.05% |
| PIMCO ACCESS INCOME FUND SHS BENFIN INT |
| 3.02% |
| PIMCO CORPORATE & INCOME OPPOR COM |
| 3.01% |
(source Amplify ETFs)
Closed-end funds are often chosen by investors for their distribution yield. They also have a few metrics that are not applicable to stocks and ETFs. Two of them are more important than the yield:
- Discount to NAV (higher is better).
- Relative discount = Discount to NAV minus its 12-month average (higher is better).
The next table compares YYY holdings with the full CEF universe regarding these metrics. Two methods are used: simple average and capital-weighted average. Out of 45 holdings, 35 with available data at my data provider have been taken into account in the calculation.
| Average discount% |
| Average relative discount% |
| Capital weighted discount% |
| Capital weighted relative discount% |
| Holdings (35) |
| 9.97 |
| 1.87 |
| 10.10 |
| 2.34 |
| CEF universe |
| 9.55 |
| 1.91 |
| 9.17 |
| 1.90 |
Calculation using Portfolio123.
YYY holdings are slightly better than the universe regarding these metrics, but the difference is below 1% in all measures.
Past performance
Since 7/1/2013, YYY has lagged by a wide margin its main competitor Invesco CEF Income Composite ETF (PCEF). For comparison purposes, the next table also includes a 60/40 model portfolio and a more appropriate benchmark: the subset of the 45 CEFs with the higher yields among those with an average trading volume above $100’000 per day and a positive discount to NAV (net asset value). The subset is reconstituted twice a year in equal weights to make it comparable to the underlying index.
| Since 7/1/2013 |
| Total Return |
| Annual.Return |
| Drawdown |
| Sharpe ratio |
| Volatility |
| YYY |
| 29.37% |
| 2.65% |
| -42.52% |
| 0.18 |
| 14.24% |
| PCEF |
| 55.77% |
| 4.61% |
| -38.64% |
| 0.35 |
| 12.64% |
| Reference subset |
| 62.91% |
| 5.09% |
| -44.80% |
| 0.33 |
| 16.78% |
| 60% SPY 40% BND |
| 117.41% |
| 8.22% |
| -21.80% |
| 0.74 |
| 9.70% |
Data calculated with Portfolio123.
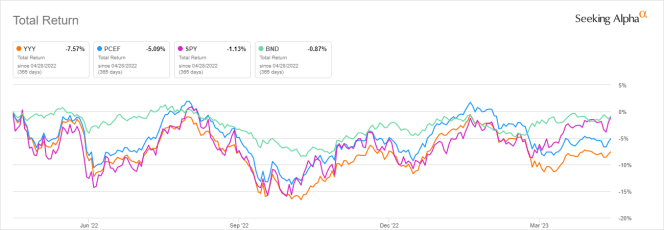
YYY underperforms not only in total return, but also in risk-adjusted performance (Sharpe ratio). In the last 12 months, YYY has also lagged PCEF, as well as equity and bond benchmarks ( SPY , BND ), as shown below:
YYY vs PCEF, SPY, BND, 12-month total return (Seeking Alpha)
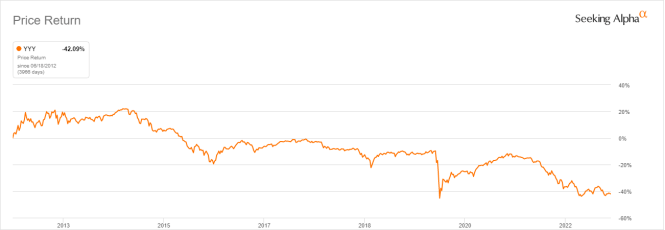
The annualized return reinvesting all distributions is far below the distribution rate and its historical average (which is over 8%). It means YYY has paid a high yield while the principal has suffered a decay. In fact, the share price has lost 42% since inception:
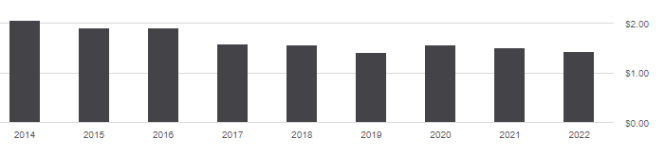
The annual sum of distributions has decreased from $2.06 per share in 2014 to $1.44 in 2022. It means the income stream has shrunk by 30%, whereas the cumulative inflation has been about 26% in the same time (based on CPI).
The period from 2014 to 2020 was a low-rate, low-inflation environment. Higher rates are likely to result in higher leveraging costs for closed-end funds, and they may also erode share price faster. It might accelerate the decay in capital and income stream, especially in inflation-adjusted value.
Takeaway
Amplify High Income ETF may be useful for tactical allocation, swing trading, or capturing some market anomalies, but I don’t see it as a good long-term investment to preserve income and capital. The total expense ratio and the track record of price return and distributions are unattractive. This is true for a number of high-yield funds, not only YYY. Most funds with a yield superior to 6% have suffered from a decay in share price and/or distribution since inception.
Bonus: a solution to avoid capital decay in CEFs
Capital decay may be avoided or mitigated by more active rotational strategies. I designed a 5-factor ranking system in 2016, and monitored its performance during several years. I started publishing the eight best ranked CEFs in Quantitative Risk & Value (QRV) after the March 2020 meltdown. The list is updated every week. It isn’t a model portfolio: trading the list every week is too costly in spreads and slippage. Its purpose is helping investors find funds with a good entry point. In the table below, I give the hypothetical example of starting a portfolio on 3/25/2020 with my initial “Best 8 Ranked CEFs” list and updating it every 3 months, ignoring intermediate updates. Return is calculated with holdings in equal weight and reinvesting dividends at the beginning of every 3-month period.
| since 3/25/2020 |
| Total Return |
| Annual.Return |
| Drawdown |
| Sharpe ratio |
| Volatility |
| Best 8 CEFs quarterly |
| 124.06% |
| 29.73% |
| -20.60% |
| 1.27 |
| 20.14% |
| YYY |
| 12.86% |
| 3.98% |
| -22.87% |
| 0.24 |
| 11.91% |
| SPY |
| 76.43% |
| 20.11% |
| -24.50% |
| 0.93 |
| 18.95% |
This simulation is not a real portfolio and not a guarantee of future return.
Of course, past performance (real or simulated) is not representative of future return. However, I think a time-tested rotational strategy in CEFs has a much better chance to protect both capital and income stream against erosion and inflation than a high-yield ETF.
For further details see:
YYY: A High-Yield, High-Risk Fund