YYY - YYY: Amortizing NAV And Shrinking Distributions
Summary
- YYY takes a fund-of-funds approach to investing in CEFs.
- It pays a forward yield of 11.3%.
- However, with a distribution rate far higher than the fund's average annual total returns, the YYY appears to be an amortizing 'return of principal' fund.
- It also significantly lags behind peer fund PCEF.
The Amplify High Income ETF ( YYY ) takes a fund-of-fund approach to investing in closed-end funds. It has a confusing fund construction methodology that appears inconsistent with its prospectus. Despite an attractive 11.3% forward yield, I worry about long-term NAV declines and distribution cuts with the YYY ETF. Furthermore, its performance lags behind fellow FOF peer, the PCEF.
Fund Overview
The Amplify High Income ETF aims to pay high current income through a portfolio of closed-end funds ("CEF") that are typically purchased at a discount below their net asset values ("NAV").
Strategy
The YYY ETF aims to achieve its investment objective by tracking the ISE High Income Index ("Index"). The index is constructed from a universe of the common stocks of CEFs. To be eligible for inclusion, a CEF must have at least $500 million in market capitalization and average valued traded of over $1 million over 6 months. The CEFs are then ranked by 3 factors: distribution yield (higher yield ranks better), premium/discount to NAV (premium or smaller discount ranks better), and average daily value traded (higher liquidity ranks better). A composite score is then calculated and the top 30 ranked CEFs (the prospectus says 45 funds are selected, but the website says as of July 19, 2021, the number of index constituents were changed to 30) are selected for the index.
The index constituents are then weighted by a 'modified linear weighted methodology' whereby the top-ranked constituent is equal to a multiple of the smallest weight, provided no constituent may exceed 3% and no constituent may exceed 100% of the ratio between the security's average valued traded and $10 million.
Given there are only 30 constituents in the index and the weight cap is 3%, it's unclear how this weighting mechanism works in practice (the 'average' weight of a 30 constituent index is 3.3%, but if the 'max' weight is only 3%, so how do you construct this index???). The YYY ETF claims to 'passively' replicate the index constituent weightings.
Portfolio Holdings
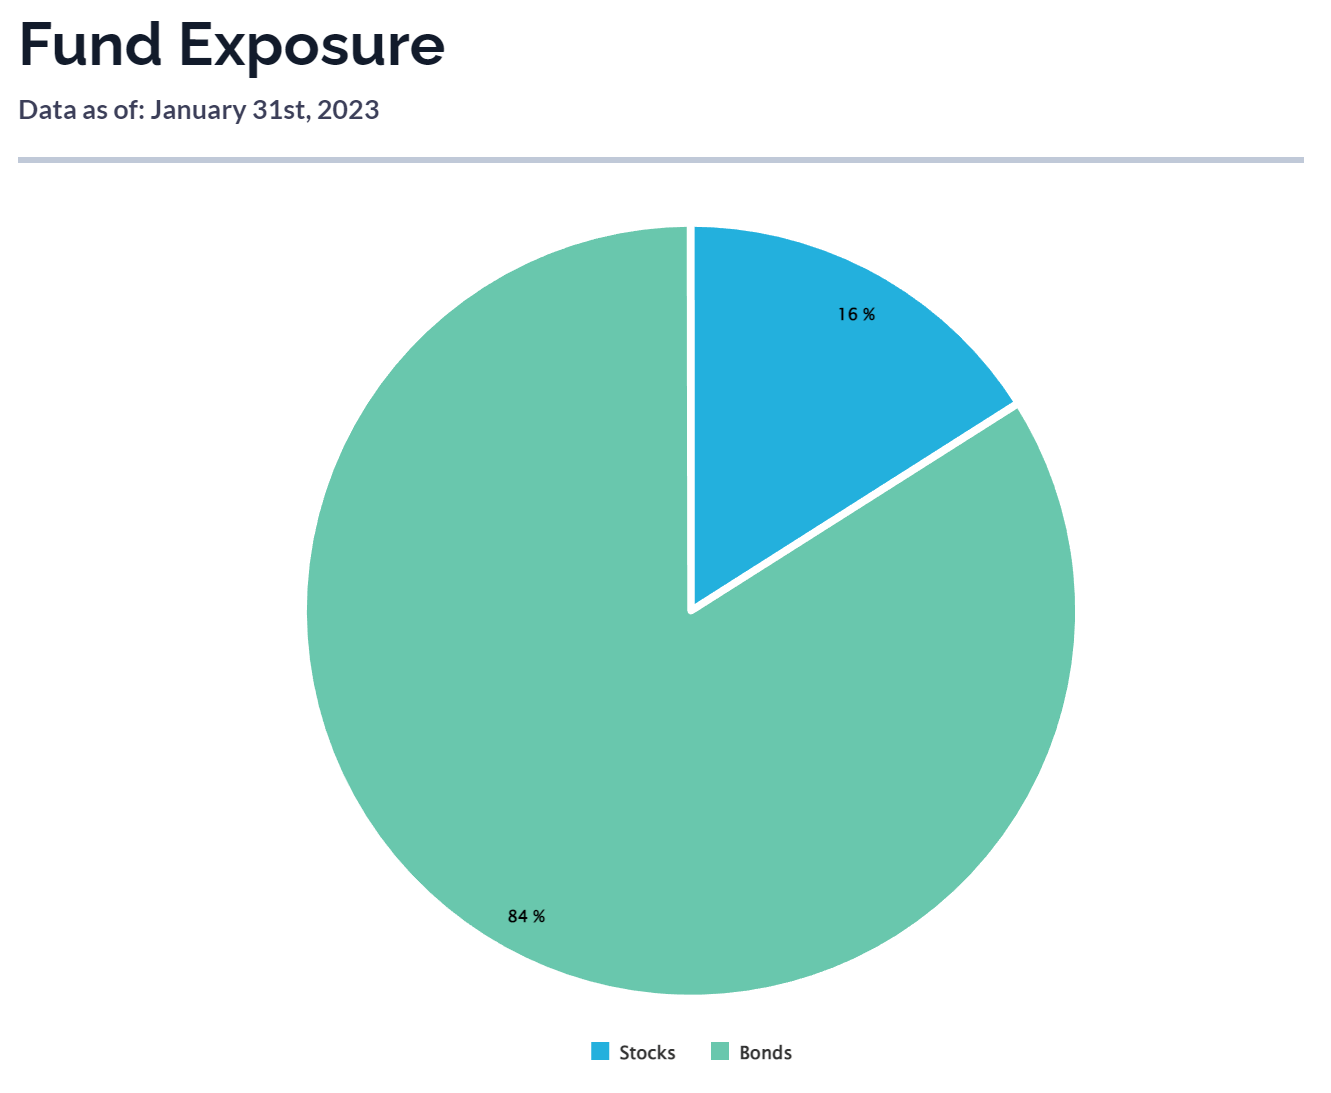
Note, although the underlying index methodology has been changed to 30 constituents as of 2021, the fund continues to hold 45 holdings and thus is not 'passively' replicating the index. The YYY ETF primarily invests in fixed income CEFs, as it accounts for 84% of assets (Figure 1).
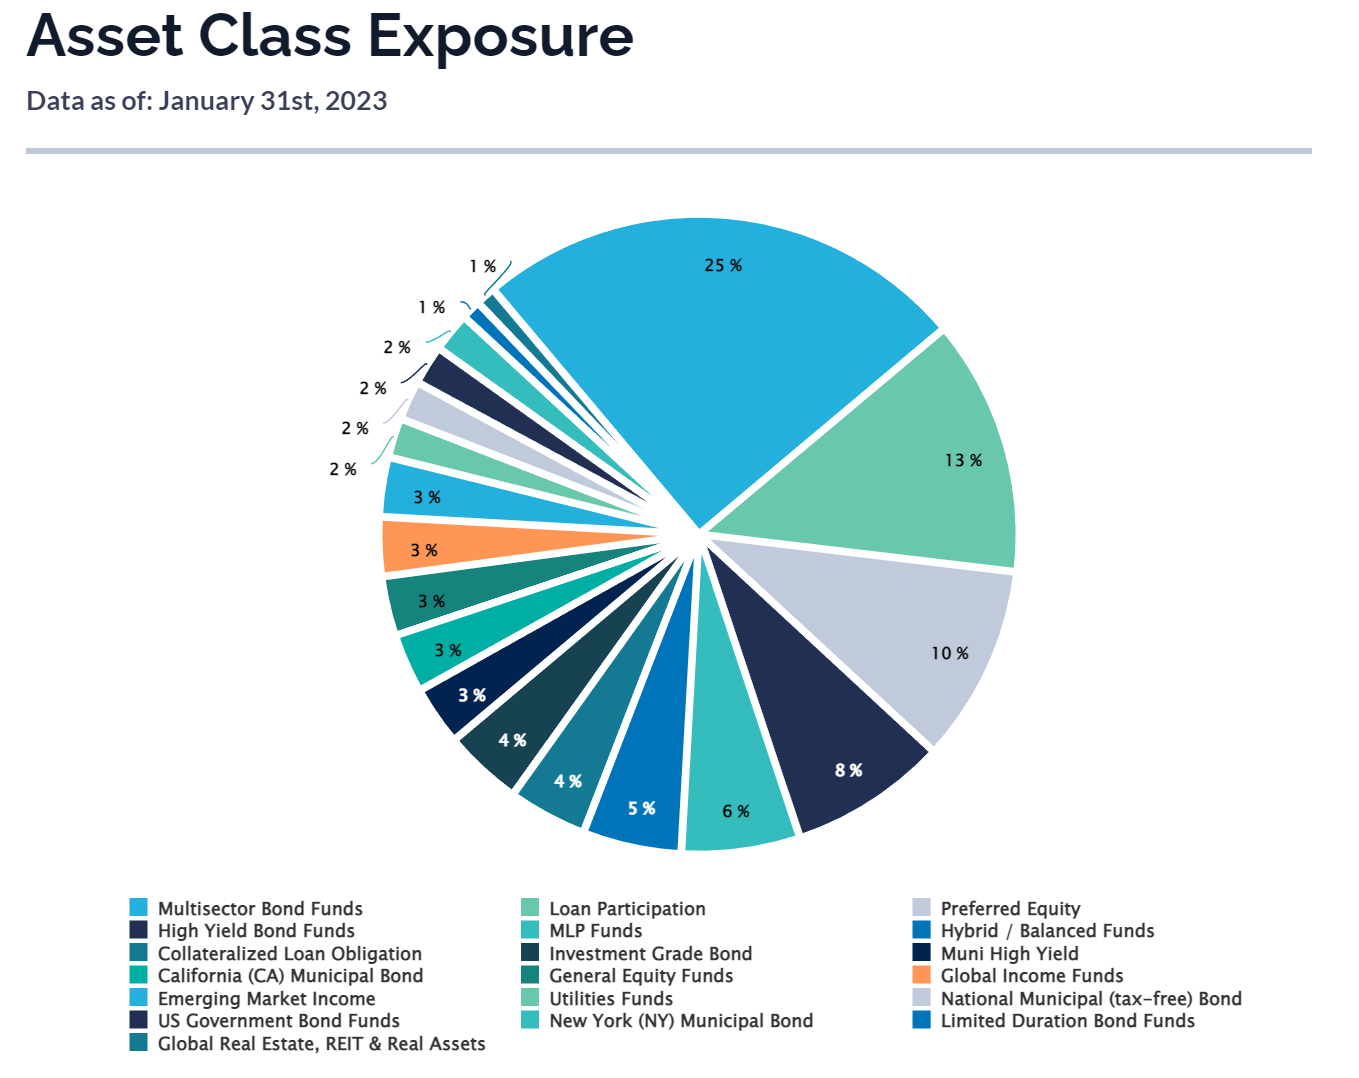
Figure 2 shows the asset class allocation. Multi-sector bond funds account for 25% of YYY's assets, followed by loan participation at 13% and preferred equity at 10%.
Returns
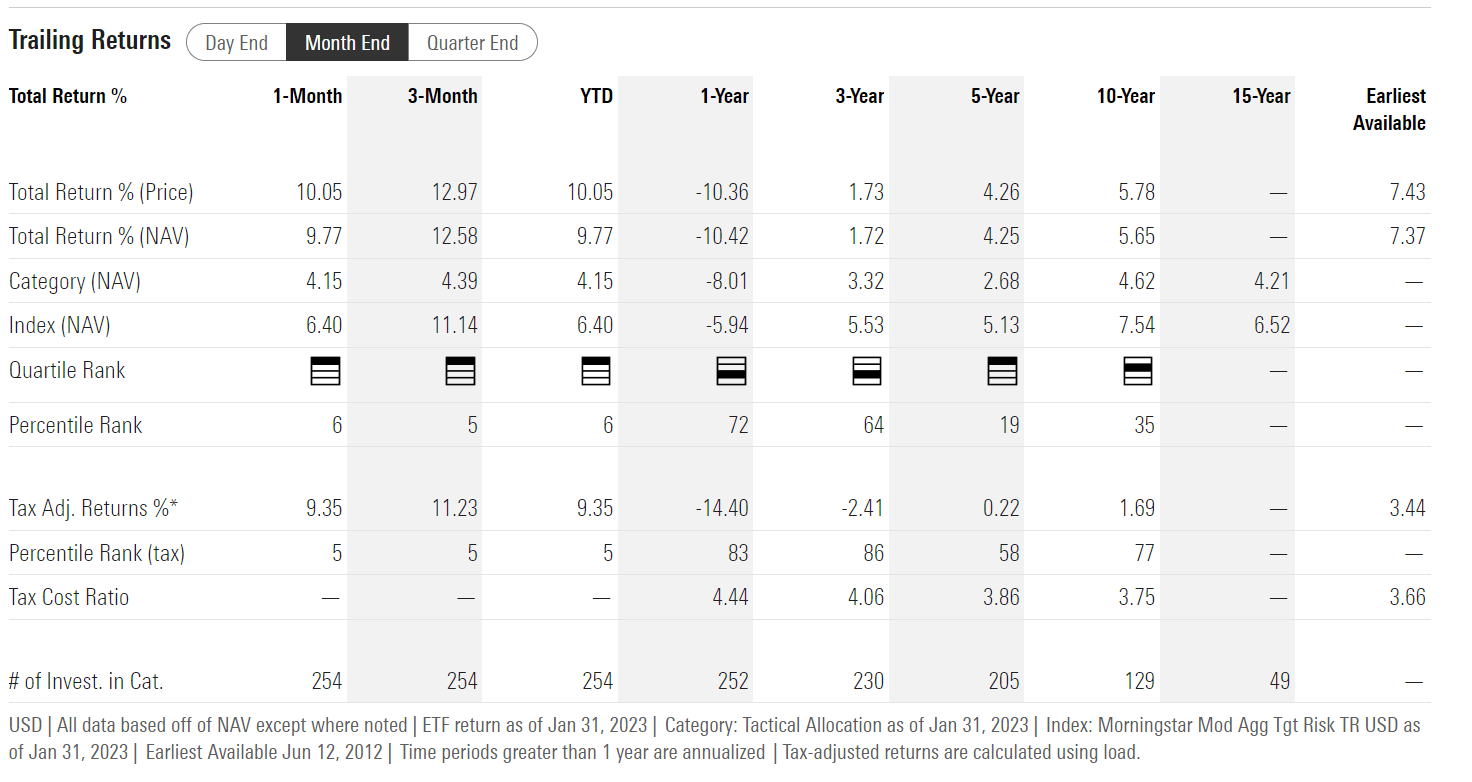
The YYY ETF's historical performance has been modest, with 3/5/10Yr average annual returns of 1.7%/4.3%/5.7% respectively to January 31, 2023 (Figure 3).
Distribution & Yield
The YYY ETF pays a high monthly distribution of $0.12 / share, which annualizes to an 11.3% forward yield. Although the YYY's distribution looks attractive on first glance, I worry it may not be sustainable.
First, comparing between the fund's distribution rate of 11.3% and its historical returns of 1.7% to 5.7% (depending on 3Yr or 10Yr average annual returns), we see the YYY ETF is paying a distribution rate beyond its earnings. Funds that do not earn their distributions are called 'return of principal' funds, and the YYY appears to be an ETF version of a 'return of principal' fund. Return of principal funds are problematic because the distribution shortfall is funded by liquidating the NAV. Over time, there are less income earning assets to support future distributions.
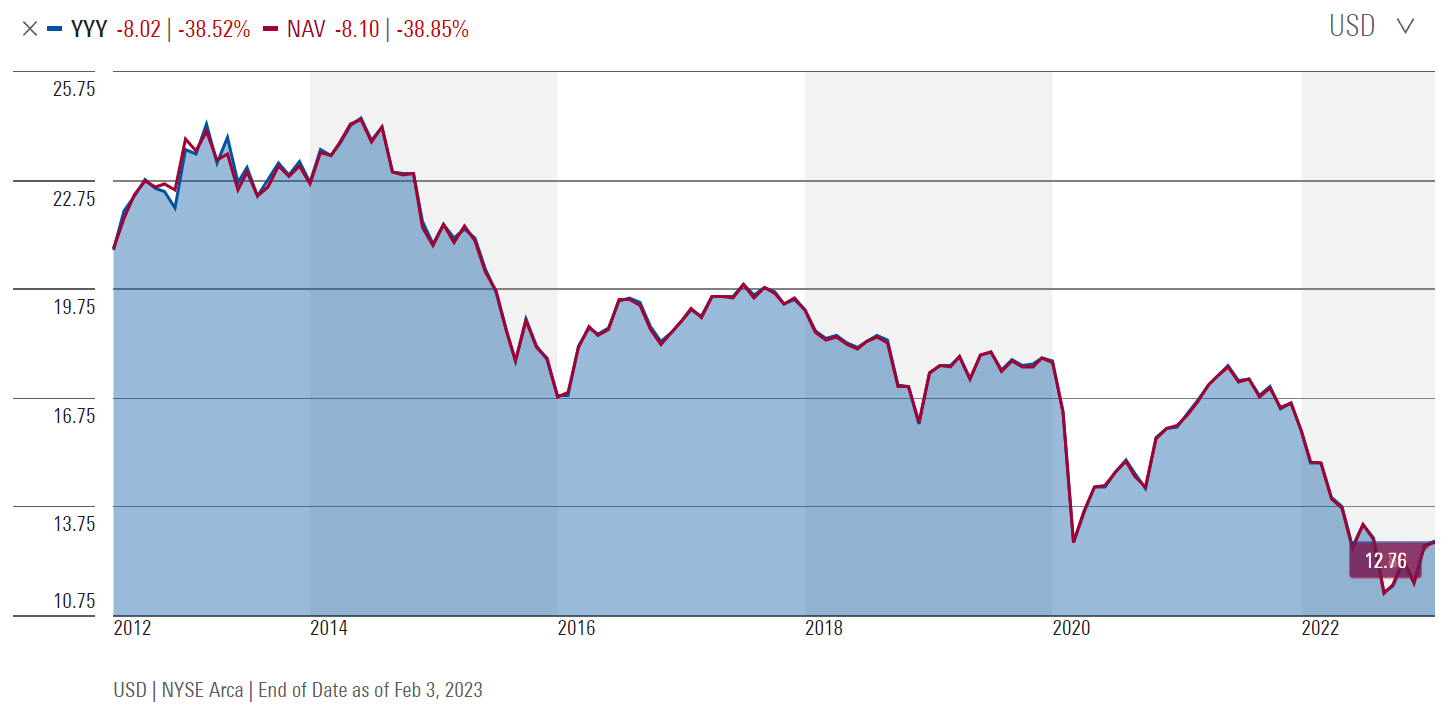
We can confirm this problem by looking at YYY's NAV declines over time (Figure 4). YYY's NAV peaked at $24.44 in June 2014 and is now at $12.76, meaning the NAV has shrunk at a 7.3% CAGR.
Figure 4 - YYY has a long-term shrinking NAV (morningstar.com)
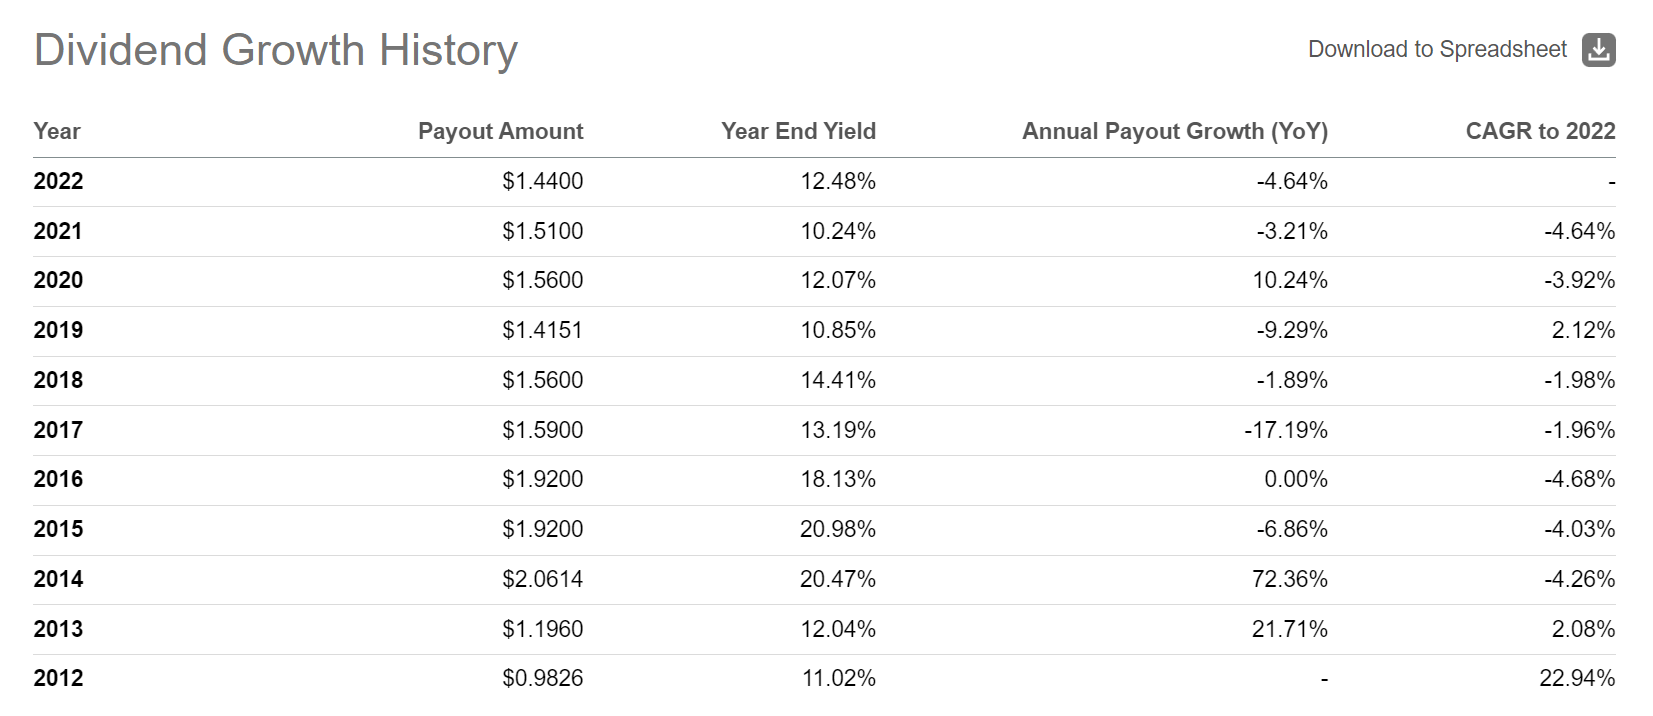
Furthermore, the fund's annual distribution rate has similarly declined, from $2.06 in 2014 to $1.44 currently (Figure 5).
Figure 5 - YYY annual distributions have shrunk (Seeking Alpha)
Long-term investors who bought the YYY have lost both principal (lower NAV) and income (lower distributions).
Fees
The YYY ETF applies a fund-of-fund ("FOF") structure to CEFs, meaning investors have to pay management fees to Amplify, in addition to the fees on the underlying funds. This works out to a hefty 2.26% total expense ratio (Figure 6).
Figure 6 - YYY fee ratio (amplifyetfs.com)
YYY vs. PCEF
Not too long ago, I wrote a review of another CEF fund-of-fund ETF, the Invesco CEF Income Composite Portfolio ETF ( PCEF ). How does the YYY compare head to head against PCEF?
In terms of fees, the PCEF is cheaper, as its total expense ratio is only 1.97%. The main difference is PCEF's fund selection criteria, which cap management fees on the underlying CEFs to 1.25%, so PCEF excludes very expensive funds like Oxford Lane Capital ( OXLC ), which charges an eye watering 12.57% annual expense (I wrote about this fee rate in a recent OXLC article ). OXLC happens to be the largest weight in YYY.
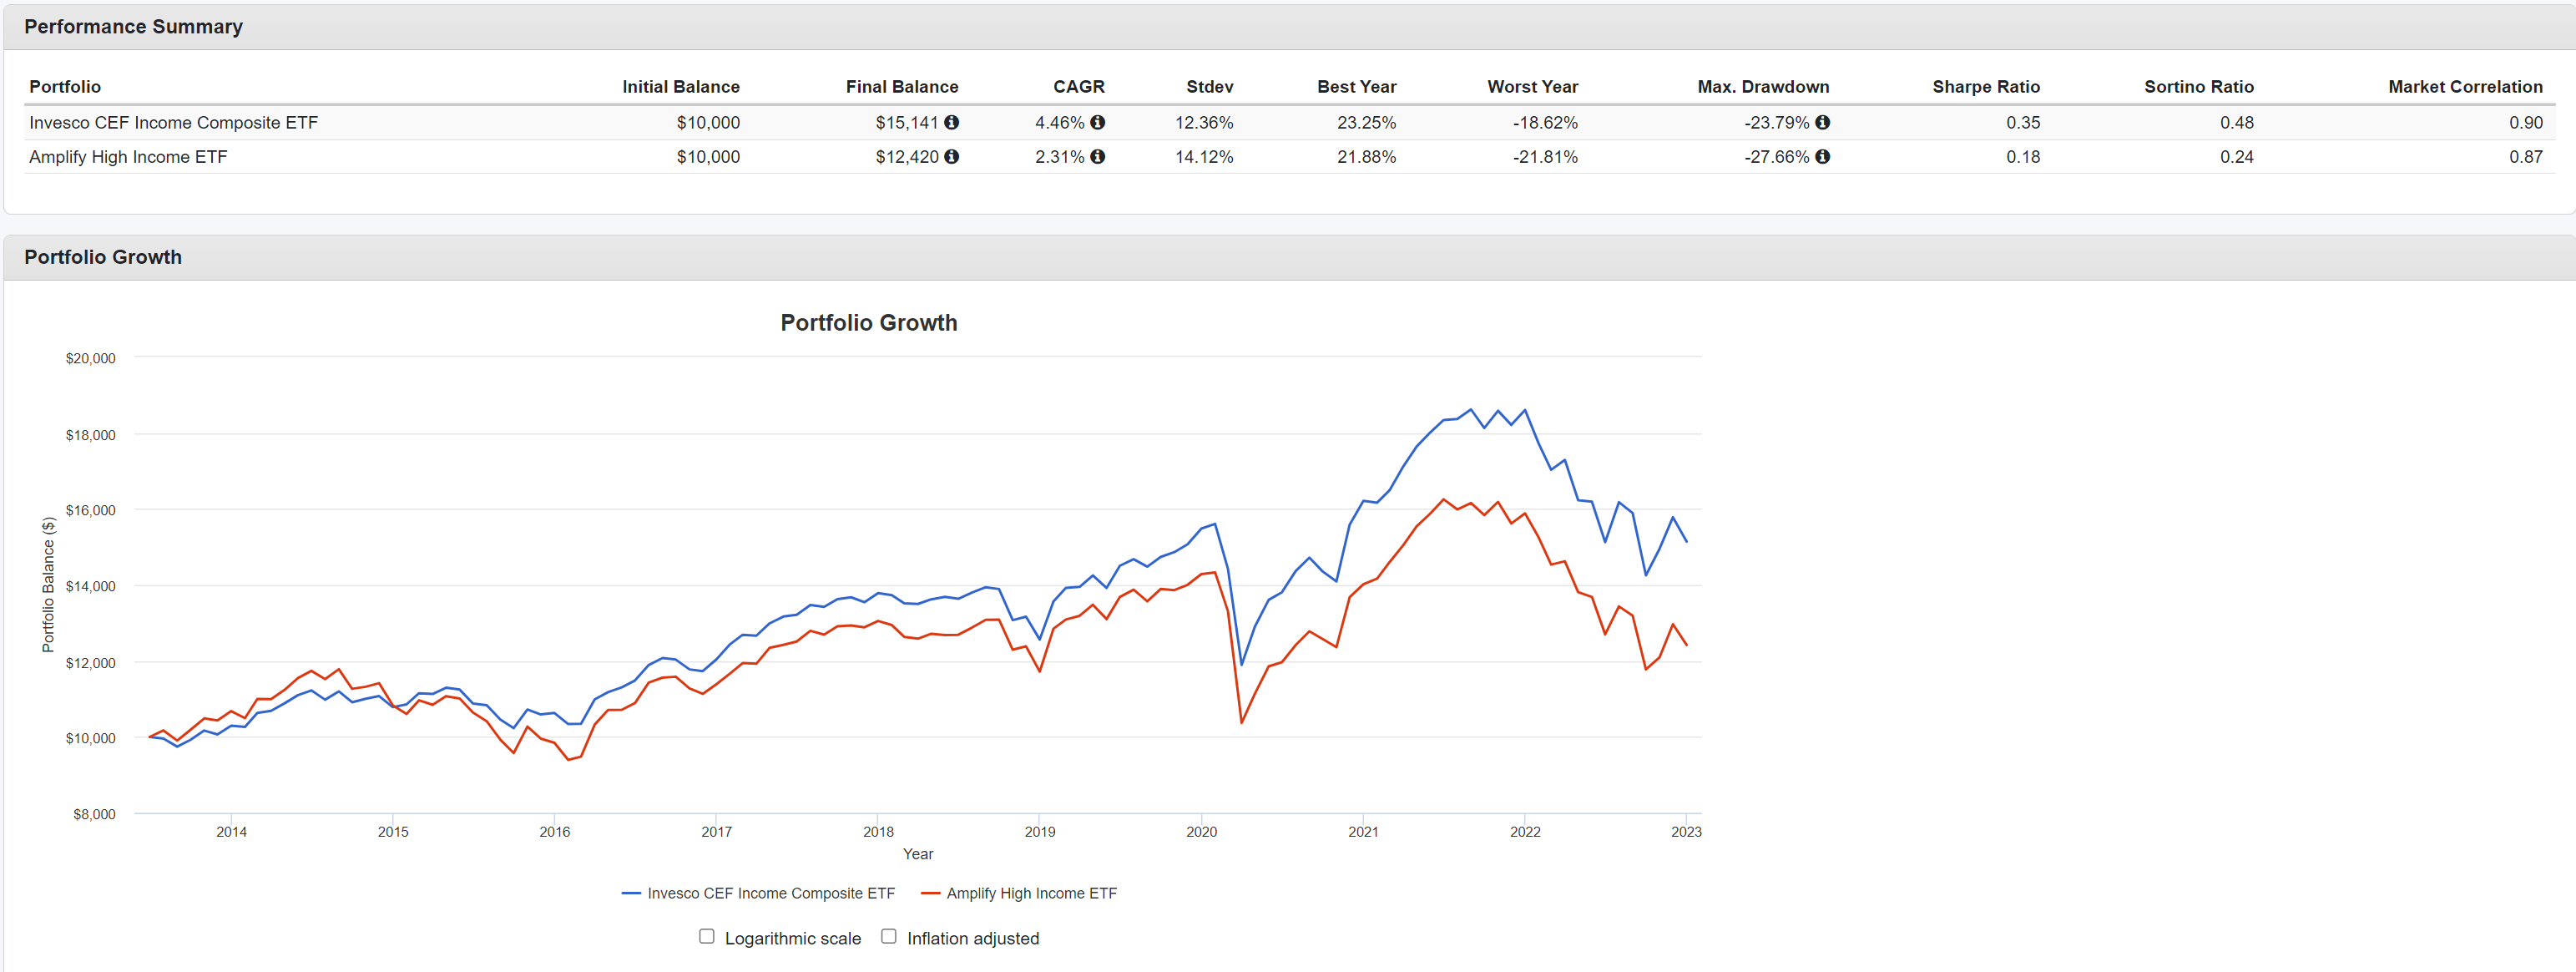
Comparing the two funds using Portfolio Visualizer, using the period July 2013 (YYY has a June 2013 inception date) to December 2022, we can see that PCEF has a better CAGR total return of 4.5% vs. 2.3% for YYY (Figure 7). This is despite the fact that YYY has a higher distribution yield, currently 11.3% vs. 8.3% for PCEF.
Figure 7 - PCEF vs. YYY (Author created using Portfolio Visualizer)
PCEF also has lower volatility of 12.4% vs. 14.1% for YYY, giving PCEF a Sharpe Ratio of 0.35, almost double YYY's 0.18.
Conclusion
The YYY ETF takes a fund-of-fund approach to investing in CEFs. However, its long-term performance appears to lag significantly behind peer fund PCEF. Despite having an attractive 11.3% forward yield, I worry about long-term NAV declines and distribution cuts with the YYY ETF.
For further details see:
YYY: Amortizing NAV And Shrinking Distributions