PAXS - YYY: Data Are Unattractive And That's A Euphemism
2023-09-28 15:37:13 ET
Summary
- Amplify High Income ETF has underperformed the S&P 500 index, with a -33% price decrease and -11% total return since February 2021.
- The YYY ETF is a fund of closed-end funds with a high expense ratio of 2.72% and a portfolio heavily weighted towards bonds.
- A rotational strategy in CEFs may be a better option for preserving capital and income stream against erosion and inflation compared to YYY.
Since my first post with a sell rating on Amplify High Income ETF ( YYY ) in February 2021, the price is down -33% and the total return with distributions is -11%, while the S&P 500 index (SP500) has gained 10%. I have revisited this fund of funds a few times with updated data since then, it has confirmed my opinion.
YYY strategy and portfolio
Amplify High Income ETF is a fund of closed-end funds, or CEFs, targeting income-seeking investors. It started investing operations on 6/21/2013 and tracks the ISE High Income Index. It has 45 holdings, a forward distribution rate of 12.44%, and a 30-day SEC yield of 10.44%. Like all exchange-traded funds, or ETFs, holding CEFs, the expense ratio is very high: 0.50% in management fees plus 2.22% in held fund expenses, totaling 2.72%. As described by Amplify ETFs , the underlying index
selects CEFs ranked highest overall by ISE in the following factors: Yield, Discount to Net Asset Value ((NAV)), and Liquidity. This investment approach results in a portfolio which contains a variety of asset classes, investment strategies and asset managers.
Eligible funds must be listed in the U.S., have a market capitalization of at least $500 million and an average daily trading value of at least $1 million. They are ranked and selected using 3 factors: yield, discount to NAV and liquidity. Constituents are weighted based on their ranks, with some adjustments. The index is reconstituted twice a year, in January and July.
The fund changed names in October 2019, but it has kept the same ticker and methodology. In July 2021, the methodology was modified: the number of holdings increased from 30 to 45, the constituent weight was capped at 3%, and the reconstitution became semi-annual (previously annual).
The portfolio is well-diversified across a number of funds: the top 10 holdings represent 32.7% of asset value, and the heaviest position weighs 3.96%. However, it is not diversified across asset classes: about 80% of asset value is in bonds.
| TICKER |
| NAME |
| WEIGHT |
| EAGLE POINT CREDIT COMPANY INC COM |
| 3.96% |
| OXFORD LANE CAP CORP COM |
| 3.83% |
| PIMCO DYNAMIC INCOME FD SHS |
| 3.32% |
| INVESCO SR INCOME TR COM |
| 3.25% |
| PIMCO DYNAMIC INCOME OPRNTS FD COM BEN SHS |
| 3.16% |
| PIMCO ACCESS INCOME FUND SHS BENFIN INT |
| 3.08% |
| NUVEEN FLOATING RATE INCOME FD COM |
| 3.05% |
| BLACKSTONE STRATEGIC CRED 2027 COM SHS BEN IN |
| 3.02% |
| KAYNE ANDERSON ENERGY INFRSTR COM |
| 3.02% |
| PIMCO CORPORATE & INCOME OPPOR COM |
| 2.99% |
Closed-end funds are often chosen by investors for their distribution yield. They also have a few metrics that are not applicable to stocks and ETFs. Two of them are more important than the yield:
- Discount to NAV (higher is better);
- Relative discount = Discount to NAV minus 12-month average.
The latter is meaningful because the discount often shows a mean-reversion pattern. The next table compares these metrics in the full CEF universe and a sample of 30 holdings of YYY (I have excluded those for which my data provider doesn't have all the information). This sample represents 64% of YYY asset value.
| Aggregate discount% |
| Aggregate relative discount% |
| YYY Holdings (30) |
| 9.70 |
| 2.47 |
| CEF universe |
| 11.72 |
| 3.25 |
Calculation with Portfolio123.
This sample is slightly inferior to the universe regarding both valuation metrics.
Past performance
Since 7/1/2013, YYY has lagged its main competitor Invesco CEF Income Composite ETF ( PCEF ). The next table also includes a 60/40 model portfolio and a better benchmark: the subset of the 100 CEFs with the higher yields among those with an average trading volume above $100'000 per day and a positive discount. The subset is reconstituted twice a year in equal weights to make it comparable to the YYY underlying index.
| Since 7/1/2013 |
| Total Return |
| Annual.Return |
| Drawdown |
| Sharpe ratio |
| Volatility |
| YYY |
| 29.63% |
| 2.57% |
| -42.52% |
| 0.19 |
| 14.11% |
| PCEF |
| 52.56% |
| 4.21% |
| -38.64% |
| 0.35 |
| 12.54% |
| Reference subset |
| 76.46% |
| 5.70% |
| -42.96% |
| 0.39 |
| 15.36% |
| 60% SPY 40% BND |
| 117.37% |
| 7.88% |
| -21.80% |
| 0.75 |
| 9.62% |
Data calculated with Portfolio123
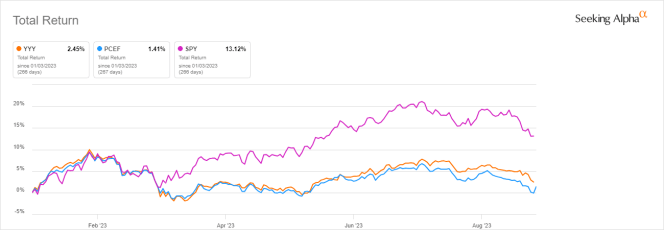
YYY underperforms in total return and in risk-adjusted performance (Sharpe ratio). In 2023 to date, YYY is shortly ahead of PCEF.
YYY vs PCEF, SPY, year-to-date total return (Seeking Alpha)
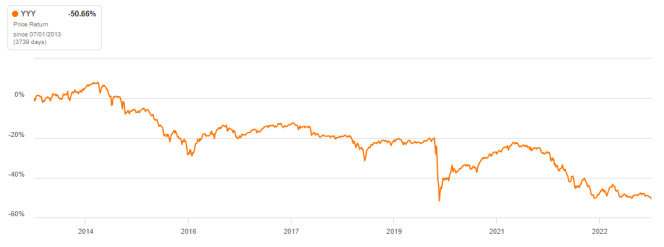
The annualized return reinvesting distributions is below the distribution rate historical average (over 8%). It is a clue that YYY has paid a high yield while the principal has suffered a decay. The next chart confirms it: the share price has lost half of its value since 7/1/2013. Adding to the pain, the cumulative inflation in the same time has been about 31%, based on CPI.
YYY share price history (Seeking Alpha)
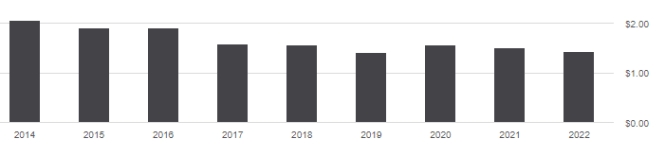
The annual sum of distributions has decreased from $2.06 per share in 2014 to $1.44 in 2022. The income stream has shrunk by 30% in 8 years, while the cumulative inflation has been about 26%.
YYY distribution history (Seeking Alpha)
YYY compared to my rotational strategy
Many funds of funds like YYY suffer from decay. However, it may be avoided or mitigated by rotational strategies. I designed a 5-factor CEF ranking system in 2016, and started publishing the eight best ranked CEFs in my investing group after the March 2020 meltdown. The table below shows the hypothetical example of starting a portfolio on 3/25/2020 with the initial "Best 8 Ranked CEFs" list and updating it every 3 months, ignoring intermediate updates. Return is calculated with holdings in equal weight and reinvesting dividends at the beginning of every 3-month period.
| since 3/25/2020 |
| Total Return |
| Annual.Return |
| Drawdown |
| Sharpe ratio |
| Volatility |
| Best 8 CEFs quarterly |
| 123.70% |
| 25.78% |
| -20.60% |
| 1.22 |
| 19.52% |
| YYY |
| 34.22% |
| 8.75% |
| -27.92% |
| 0.47 |
| 15.43% |
| SPY |
| 82.04% |
| 18.61% |
| -24.50% |
| 0.98 |
| 18.29% |
This simulation is not a real portfolio and not a guarantee of future return.
Of course, past performance is not representative of future return. However, I think a time-tested rotational strategy in CEFs has a much better chance to protect both capital and income stream against erosion and inflation than a high-yield ETF like YYY.
Takeaway
Amplify High Income ETF may be useful for swing trading or capturing some market anomalies, but it has been unable to preserve income and capital over the long term. The excessive expense ratio is not the main reason for underperformance, but it surely doesn't help. YYY is not a unique case. Most funds with a yield above 6% have suffered from a decay in share price and/or distribution for years. The period from 2013 to 2020 was a low-rate environment. Higher rates result in higher leveraging costs for closed-end funds. It is quite unlikely to see Amplify High Income ETF suddenly become a winner, especially in inflation-adjusted value.
For further details see:
YYY: Data Are Unattractive, And That's A Euphemism