AFMC - Zero Percent Long-Term Growth Is A Real Possibility
2023-03-08 03:00:06 ET
Summary
- US productivity is on a declining trend, with output per worker growing at just 1% over the past decade, restrained by declining economic freedom and short-sighted economic policies.
- This long-term decline in productivity is likely to accelerate towards zero over the coming years due to the economic distortions built up over recent decades.
- In addition, the boost from rising labor for growth is over and even a gradual return to average unemployment rates could cause employment growth to contract.
- It would not take much of a negative shock to see real GDP actually contract over the next decade.
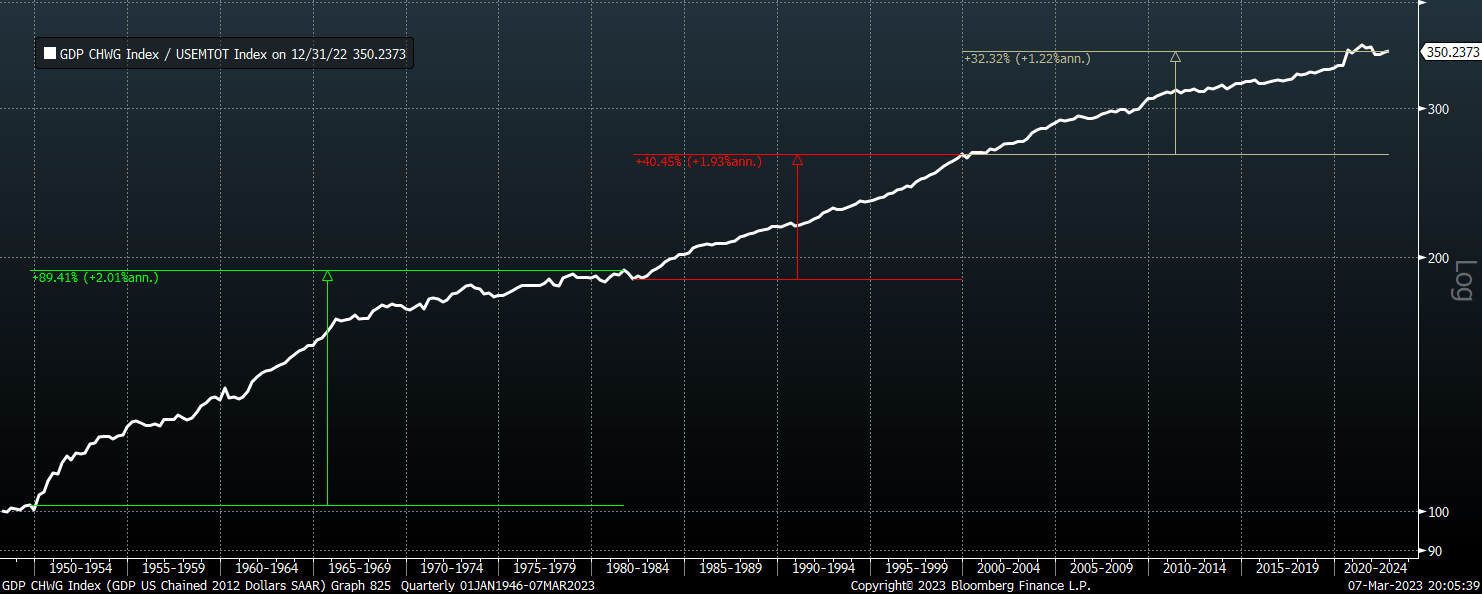
Since 2000, real output per worker has increased by just 1.2% annually. This despite the mass commercialization of the internet, the rise of China, and one of the most peaceful periods in history. Over the past decade, despite the invention of the smart phone and the productivity boost resulting from the Covid crisis, this figure has fallen to below 1%. This compares to a rate of almost 2% in the 1980s and 1990s.
This long-term decline in productivity is likely to accelerate towards zero over the coming years owing to a number of factors: growing resource constraints, an ageing population, low savings rates, declining economic freedom, extreme levels of fiscal and external debt, and huge bubbles in housing and equity markets. When we consider the projected slowdown in the working-age population, even a modest rise in the unemployment rate could result in an outright contraction in real GDP over the next decade.
Labor Force Outlook Alone Suggests No Return To High Historical Growth Rates
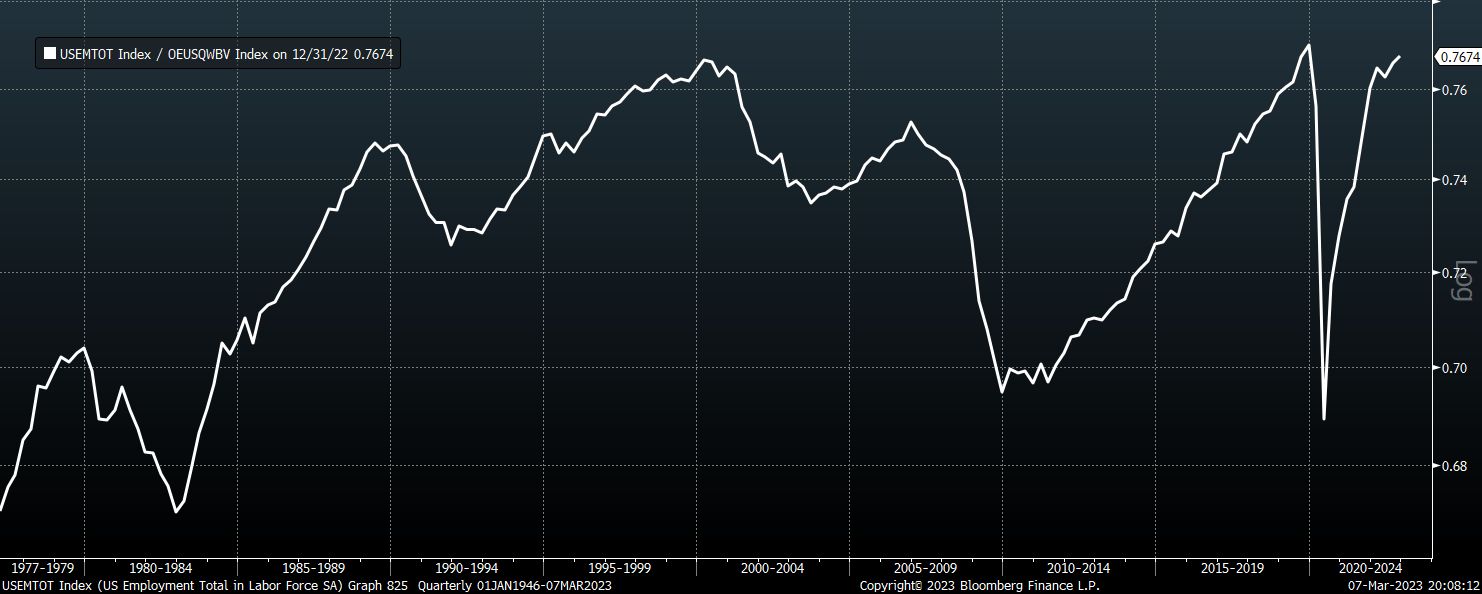
The strong real GDP growth rates of over 3% seen in the 1980s and 1990s were not just a result of strong productivity growth, but in equal part due to rapid growth in employment, which expanded by over 1.5% over this period. Over this period we saw a 0.1% contribution from a decline in the unemployment rate, a 0.3% increase in the labor force participation rate, and a 1.1% increase in the working-age population.
Each of these positive contributors face headwinds over the coming years which suggest employment growth will stagnate. For instance, the trend growth rate in the working-age population (15-64) continues to slow, averaging just 0.3% over the past decade. The labor force participation rate (labor force as a share of the working-age population) is back within a few percentage points of its all-time high seen in 2000, and the unemployment rate is its lowest since 1969. A return to the long-term average unemployment rate of 6% over the next decade would likely be enough to see total employment contract over the next decade.
US Employment / US Working-Age Population (15-64) (Bloomberg)
The employment picture should be a concern to economists who on average anticipate 2% long-term real GDP growth. Even if productivity growth manages to remain at current trend growth rates, real GDP is likely to average no higher than 1% over the long term.
Macro Mismanagement And Economic Distortions Suggests Productivity Growth Will Continue Its Decline
The steady decline in productivity growth that began in the early-2000s has been the result of various forces that are likely to intensify over the coming years, which could ultimately trend towards zero over the coming years.
Resource Constraints: Over the past decade or so the US has benefitted from a renaissance in its energy sector, which has allowed the country to return to its status as a net oil exporter. Real energy output, after growing below 1% annually from the 1970s to the 2010s, rose by 3% per year from 2010 to 2020, not only contributing directly to real GDP growth but also shielding the negative impact of rising energy prices on the overall economy. This boom is now largely over as increasingly restrictive energy policies have prevented real energy output from recovering its 2018 highs despite the oil price rally.
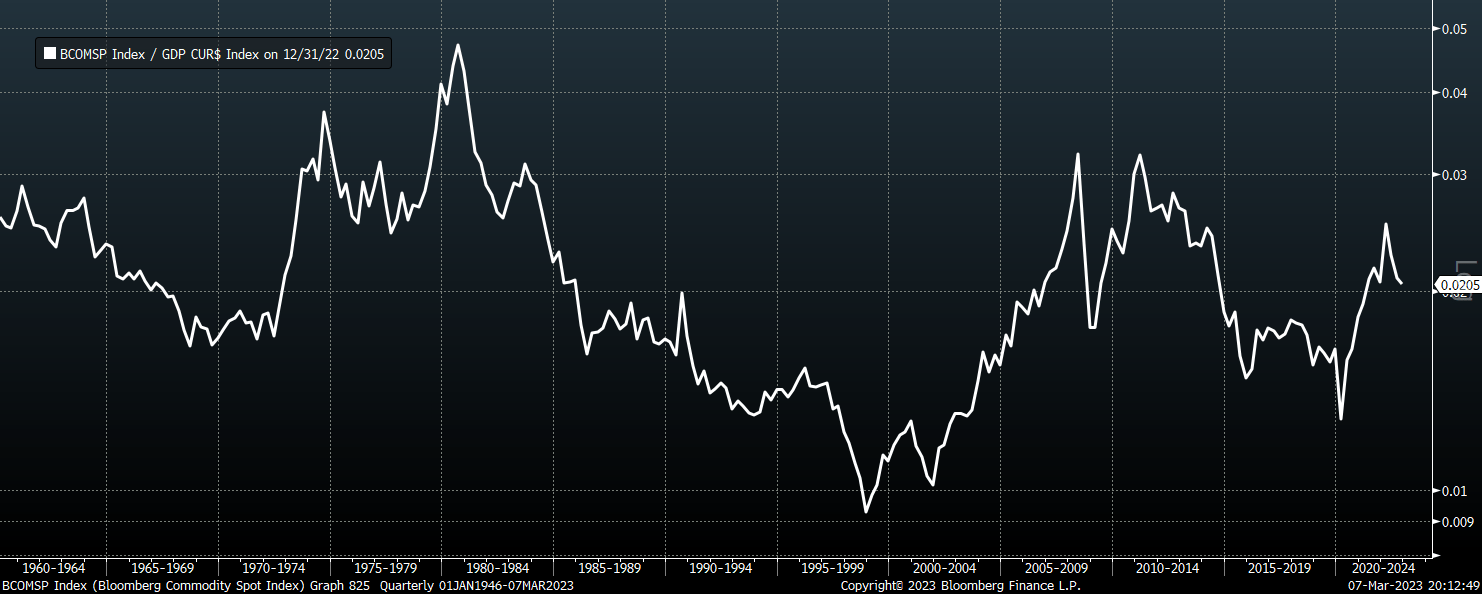
The long-term trend of declining real commodity prices is also over as new discoveries and technological advancements are no longer keeping up with global GDP growth, thanks largely to continued strong Asian demand. In addition, policies aimed at reducing carbon output should be expected to act as a drag on productivity growth in the US over the coming years. As shown below, the Bloomberg Commodity Index as a share of US GDP is double the level seen in the late-1990s.
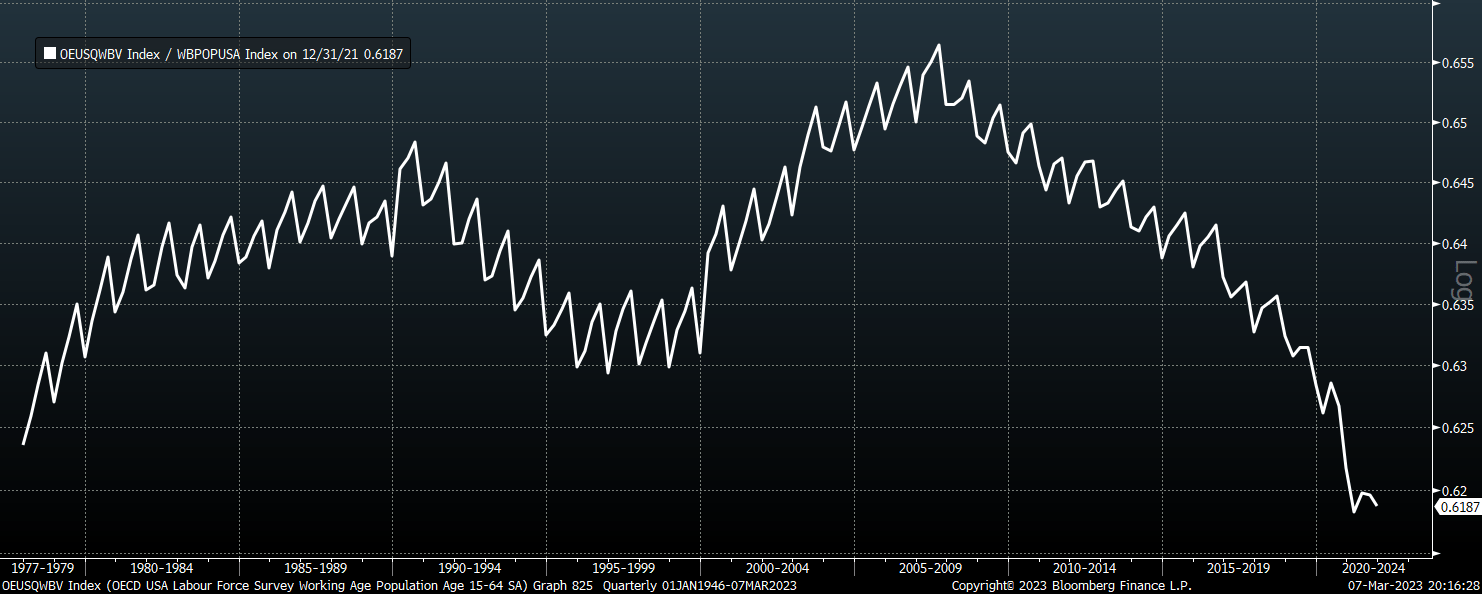
Ageing Population And Declining Savings Rates: The demographic problems facing the US are not limited to slowing workforce growth. An additional drag comes from the decline in the working-age population as a share of the total population. As the chart below shows, people aged 15-64 now represent just 62% of the US population, having fallen by 4 percentage points since its peak in 2007, and projections show that the rate will continue to decline.
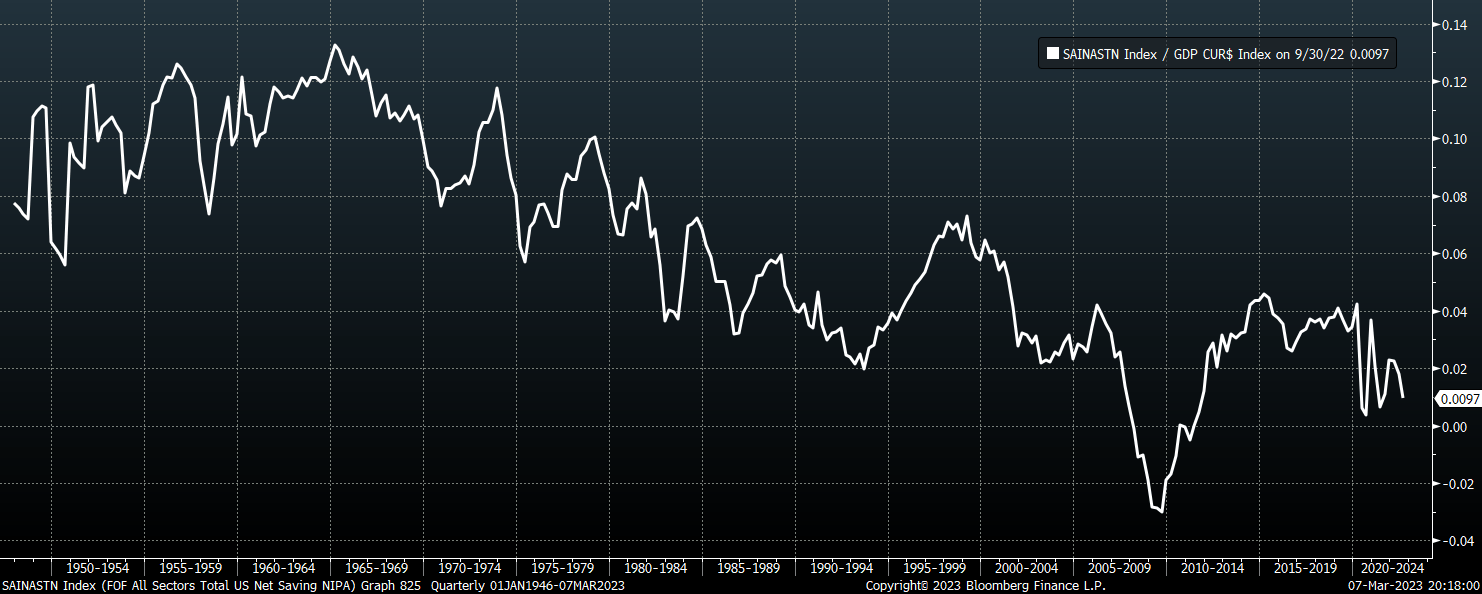
As people who do not work tend to be dissavers, this strongly suggests further downside pressure on already-low savings rates over the coming years. US net savings rate - the economy's 'retained earnings' needed for future productivity growth - has declined from a peak of 13% in 1965 to just 1% today. As Warren Buffett noted in his 2019 shareholder letter,:
Remember, earlier in this letter, how I described retained earnings as having been the key to Berkshire’s prosperity? So it has been with America. In the nation’s accounting, the comparable item is labeled “savings.” And save we have. If our forefathers had instead consumed all they produced, there would have been no investment, no productivity gains and no leap in living standards.- Warren Buffett
The high savings rates that prevailed in the 1990s paved the way for the economy to grow robustly over the following two decades despite profound economic mismanagement. However, the 'retained earnings' needed to fund future growth have increasingly been consumed, with the economy having shifted dramatically towards consumer spending and away from capital formation.
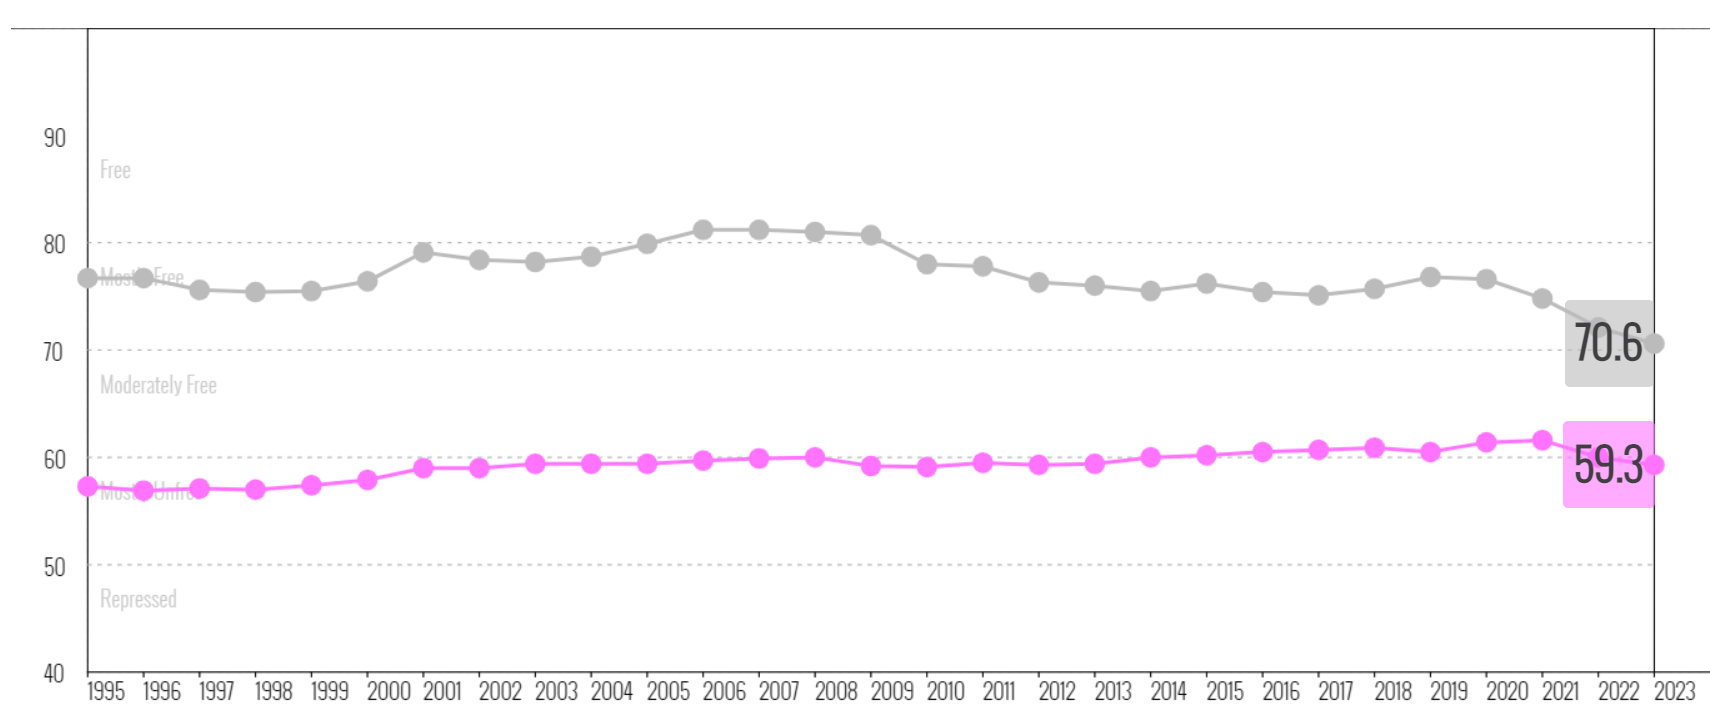
Economic Freedom In Decline: Perhaps the single biggest impediment to future real GDP growth is the relentless erosion of economic freedom in the country. The burden of the government has gradually shifted towards that of European states as policy has moved increasingly towards the pursuit of equity as opposed to prosperity. The US' score in the Heritage Foundation's Index of Economic Freedom is at its lowest level in the series' history, and the gap between the world average has fallen by a full 10 percentage points since the mid-2000s.
US And World Index Of Economic Freedom (Heritage Foundation)
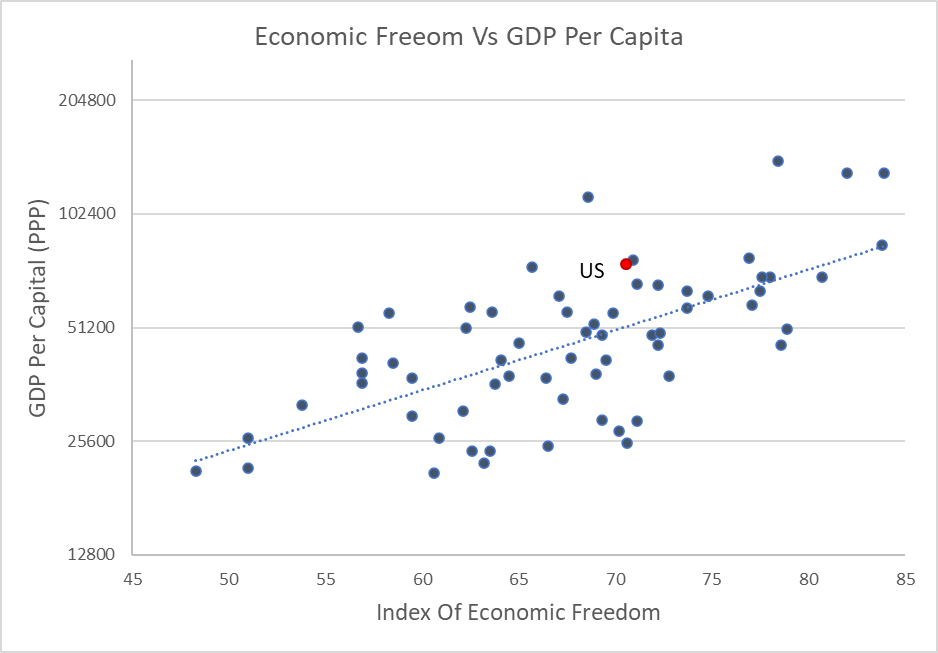
There is a strong correlation between economic freedom and GDP per capita as the chart below shows. Generally speaking, countries with low economic freedom have low levels of GDP per capita. Countries with high levels of GDP per capita and relatively low economic freedom tend to be those that benefit from some form of resource endowment as in the case of Qatar, Brunei, Saudi Arabia, Kuwait, and Bahrain. The US sits just behind these countries as being very wealthy relative to what can be explained by economic freedom.
For Countries With A GDP/Capita Above 20,000 (Heritage Foundation)
This may reflect the impact of the dollar's reserve currency status as external demand for dollars grants the US access to imports at artificially low prices, which helps support domestic productivity. However, as explained below, the external and fiscal imbalances that have built up partly as a result of this privilege create huge risks for future growth.
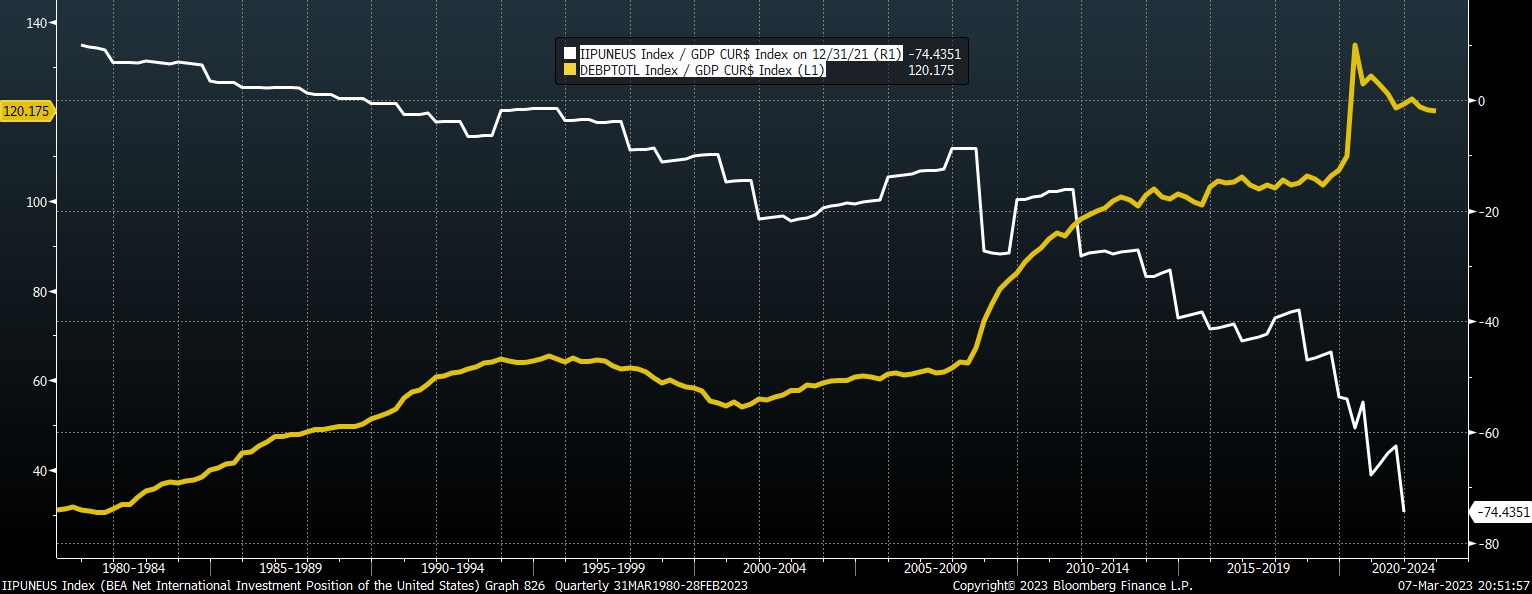
Record External And Fiscal Liabilities: In lieu of sufficient domestic savings, the US has funded domestic investment by relying increasingly on overseas borrowing. The US has among the worst external balance sheets in the developed world, with a net international investment deficit of 74% of GDP. Persistent fiscal deficits have played a key role in undermining savings, while foreign demand for US debt has allowed government debt to soar without causing an uncontrollable rise in bond yields.
It is true that the US enjoys a net income account surplus as the interest and dividends it pays on its external liabilities is below what it receives on its external assets. While this remains the case there is nothing to prevent a continued build-up of external liabilities with little impact on growth. However, the net income surplus reflects the relatively low yield on US Treasuries, which represent almost one half of total liabilities. This means that rising Treasury yields could cause external interest payments to rise rapidly. Should foreign demand for US debt begin to decline amid persistently large fiscal deficits, we could see a sharp drop in the value of the dollar. Many economists incorrectly view currency weakness as beneficial for economic growth, but this is rarely the case. A material drop in the dollar would seriously undermine profit margins in industries that rely heavily on imports, while it would take years for the industrial economy to recover sufficiently for exports to rise strongly.
Record Housing And Equity Bubbles: The US housing market is now more overvalued in terms of real price growth and affordability that it was at the 2006 peak, while long-term measures of equity valuations such as market cap-to-GDP show US stocks are as overvalued as they were at the 2000 peak. Taken together, US household net worth remains near its highest share of US GDP on record.
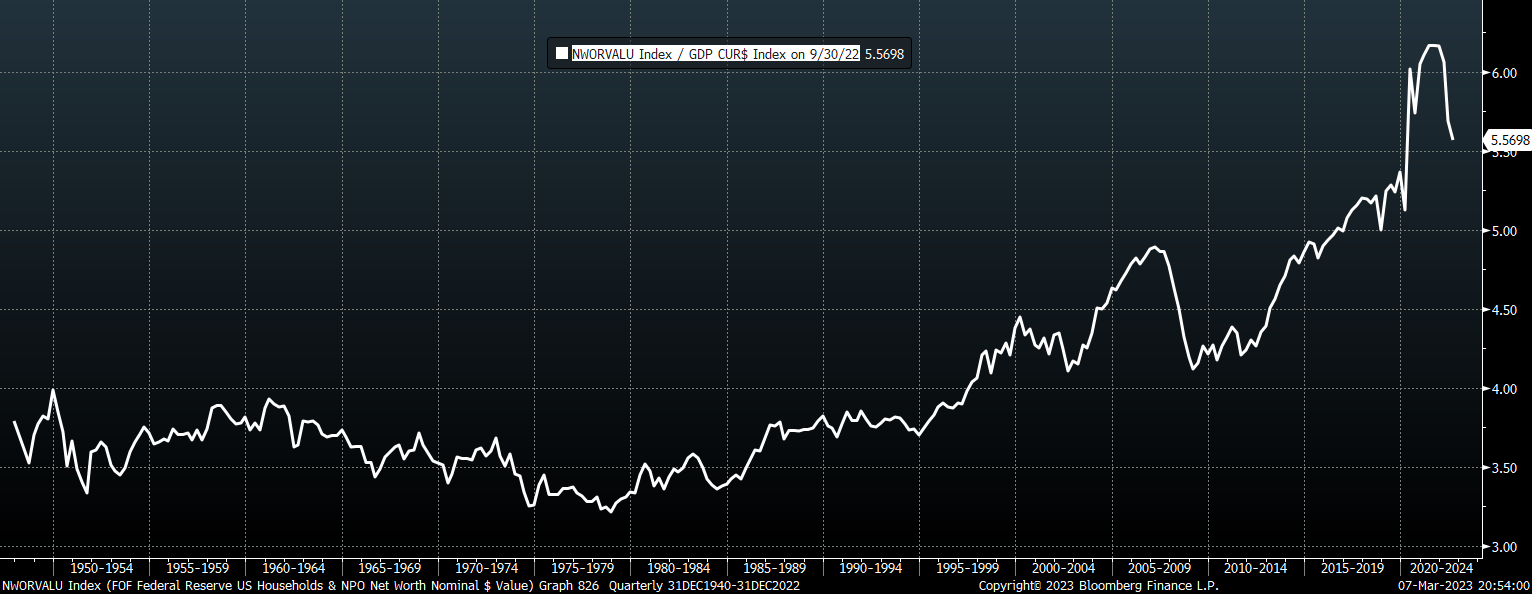
This poses a huge risk to growth over the next few years as falling asset prices could lead to a surge in savings rates as we saw during the Global Financial Crisis, causing a sharp rise in unemployment. However, the main risk from a long-term perspective comes from the likely policy responses by the Fed and Treasury. The causes of declining productivity outlined above can in large part be attributed to the easy policies enacted by the Fed and Treasury since the GFC, and any bursting of the current asset bubble would almost certainly trigger policymakers to redouble efforts to increase control over the economy to the detriment of economic freedom and productivity.
Summary
While zero long-term real GDP growth may sound far too negative, all we would need to see is a modest cyclical rise in the unemployment rate and a continued drop in productivity, both of which seem likely. Keep in mind that the US has only been able to enjoy 1% annual productivity growth this century despite a technological revolution and highly favorable external conditions. Economists' optimistic real GDP growth forecasts currently fail to take into account the impact that current economic distortions and the decline in economic freedom will have on productivity and real GDP growth over the coming decade.
For further details see:
Zero Percent Long-Term Growth Is A Real Possibility