ZTR - ZTR: Avoid This Fund Until We Get More Visibility
2023-12-04 18:38:42 ET
Summary
- Virtus Total Return Fund Inc. aims to provide high total return through investments in equity and fixed-income assets, with a current yield of 11.03%.
- The ZTR closed-end fund has underperformed both equity and fixed-income indices year-to-date, down 7.85%.
- The ZTR fund's recent strong performance may be driven by expectations of declining interest rates, but the future direction of rates is uncertain.
- The fund failed to cover its distribution in the first half of the fiscal year, and appears as though it failed to cover it in the second half.
- The fund is currently trading at an enormous discount on NAV, but the uncertain direction of interest rates and distribution struggles might make it best to avoid the fund.
The Virtus Total Return Fund Inc. ( ZTR ) is a closed-end fund, or CEF, that specializes in providing its investors with a very high level of total return by investing in both equity and fixed-income investments. However, as is the case with just about every closed-end fund, this one primarily delivers its investment returns in the form of direct payments to its investors. Thus, income investors might find it to be attractive even though it claims to not focus its efforts on the generation of income. It does fairly well as an income vehicle, as the fund’s current 11.03% yield is comparable to most other high-quality income funds that are available on the market today.
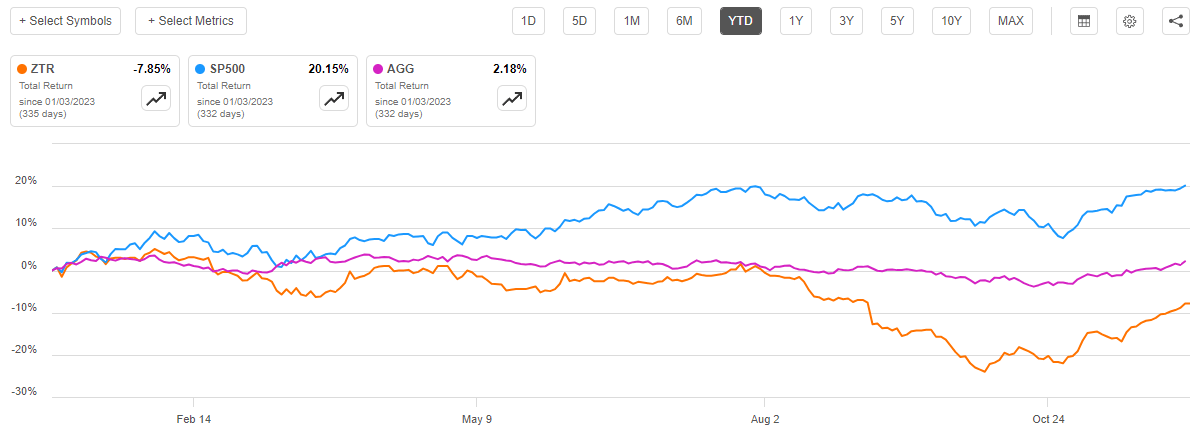
The Virtus Total Return Fund has delivered a rather disappointing performance year-to-date. After we consider the impact of the distributions that this fund pays out, investors are down 7.85% year-to-date. This is much worse than the positive total return that investors in the S&P 500 Index ( SP500 ) or the Bloomberg U.S. Aggregate Bond Index ( AGG ) have earned:
Thus, the fund claims to invest in both common equities and fixed-income securities, but it has clearly underperformed both of them. This certainly will not do very much to endear this fund to any investor, regardless of the investor’s goals. The fact that the fund cut its distribution back in August also seems rather unlikely to increase its appeal to any investor. It probably also explains the weak year-to-date performance, as closed-end funds tend to get sold off whenever they reduce their distributions. After all, these funds tend to be priced based on their yields to a certain extent.
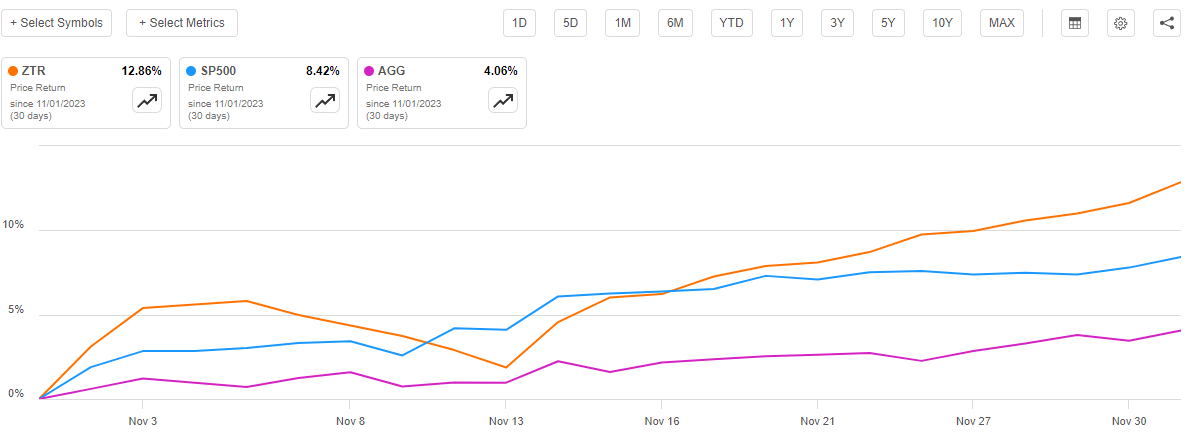
We can see in the chart above though that the fund’s performance has been reasonably strong since the end of October. In fact, the fund’s share price is up 12.86% since November 1, which is a much stronger performance than either the S&P 500 Index or the Bloomberg U.S. Aggregate Bond Index:
This strong recent performance may have prompted some investors to wonder if the time could be right to purchase shares of this fund. Let us have a look at it and attempt to answer that question.
About The Fund
According to the fund’s website , the Virtus Total Return Fund has the primary objective of providing its investors with a very high level of capital appreciation. The fund’s site explicitly states that current income is a secondary objective:
This is an unusual objective for a closed-end fund. While many of them target capital appreciation and current income, usually current income is the primary objective. This is largely because many investors who are seeking capital appreciation will prefer to purchase an exchange-traded fund that simply uses a buy-and-hold strategy. After all, exchange-traded funds tend to be somewhat more tax-efficient than a closed-end fund that is actively managed and has to pay out all of its realized capital gains and income. Of course, from the perspective of someone who is actively seeking income from the assets in their portfolios, whether the fund obtains the money for the distributions from capital gains or payments received from the securities in the portfolio is somewhat immaterial.
This fund does boast a very attractive yield despite targeting capital appreciation though, so this difference should be academic. We just should not expect the fund to specifically overweight fixed-income securities or high-yielding dividend stocks when compared to growth plays.
As should be expected, considering that the fund is targeting capital appreciation, stocks constitute a much heavier proportion of its portfolio than bonds. As we can see here, the Virtus Total Return Fund currently has 72.98% of its assets invested in common stocks alongside a much smaller 25.91% weighting to bonds:
CEF Connect
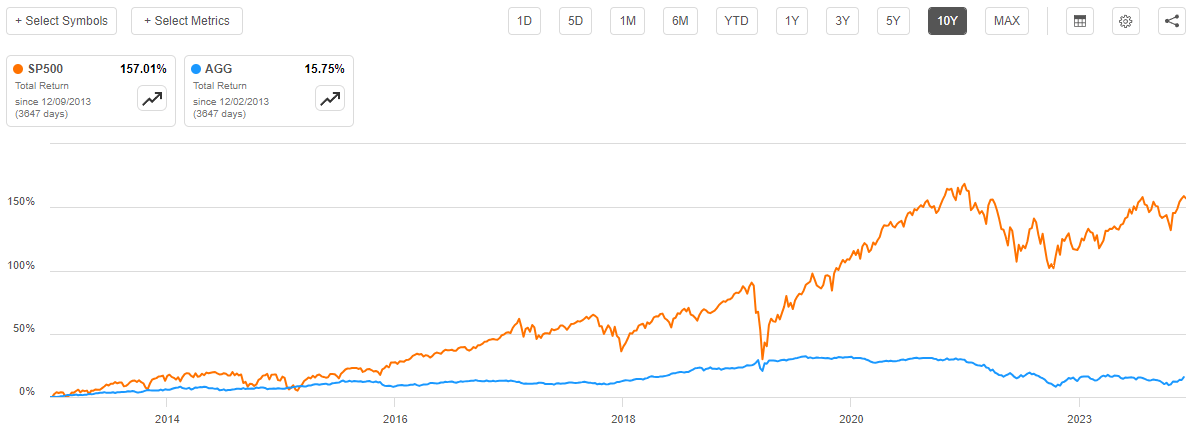
Common stocks are generally considered to be much better than bonds in terms of returns, and that has certainly proven to be the case over most multi-year periods. Over the past ten years, the S&P 500 Index has delivered a 157.01% total return compared to 15.75% for the Bloomberg U.S. Aggregate Bond Index:
Of course, this was a very unusual period of time because interest rates were incredibly low. That makes it very difficult for bonds to deliver reasonable returns because there are nearly no interest payments that can provide a return and price appreciation for bonds is somewhat capped due to the fact that interest rates cannot meaningfully drop below zero before investors stop lending activities.
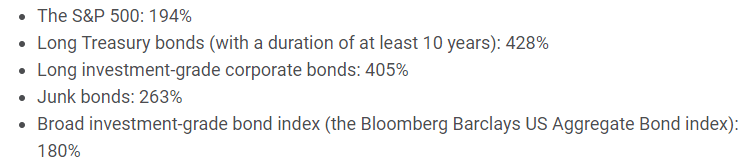
The balance between bond and stock returns can be different during certain periods of time. For example, the New York Times claims that ten-year U.S. Treasury bonds beat the S&P 500 Index over the twenty-year period stretching from the turn of the century to April 2020. Ben Carlson, CFA, ran the numbers for his blog and found the same thing:
The biggest reason for this is that early 2000 was very close to the peak of the Internet bubble, and valuations were naturally very stretched. That was arguably the worst possible time in a generation to enter the S&P 500 Index. Nonetheless, the point is made that stocks do not always outperform bonds over the long term (although stocks do outperform during nine out of ten rolling twenty-year periods going back ninety years).
The point of this is that the fund’s allocation favoring common stocks is probably better than any other alternative over the long term. However, we can certainly make the argument that bonds offer better risk-adjusted return potential over the next twelve months or so given current economic conditions and stock market valuations. It would be pretty rare for a fund to drastically alter its portfolio in response to such a short-term situation, however. This fund only has a 47.00% annual turnover, so it is not engaging in a substantial amount of trading. After all, that turnover is actually lower than many other equity closed-end funds possess.
In a recent article , I pointed out that nearly all of the stock market’s gains year-to-date have been due to seven stocks. These seven stocks are known as the “Magnificent 7” and they are all mega-cap technology companies that investors believe will benefit from the widespread adoption of artificial intelligence technology. The Virtus Total Return Fund does not include any of these seven stocks among its largest positions. We can see this here:
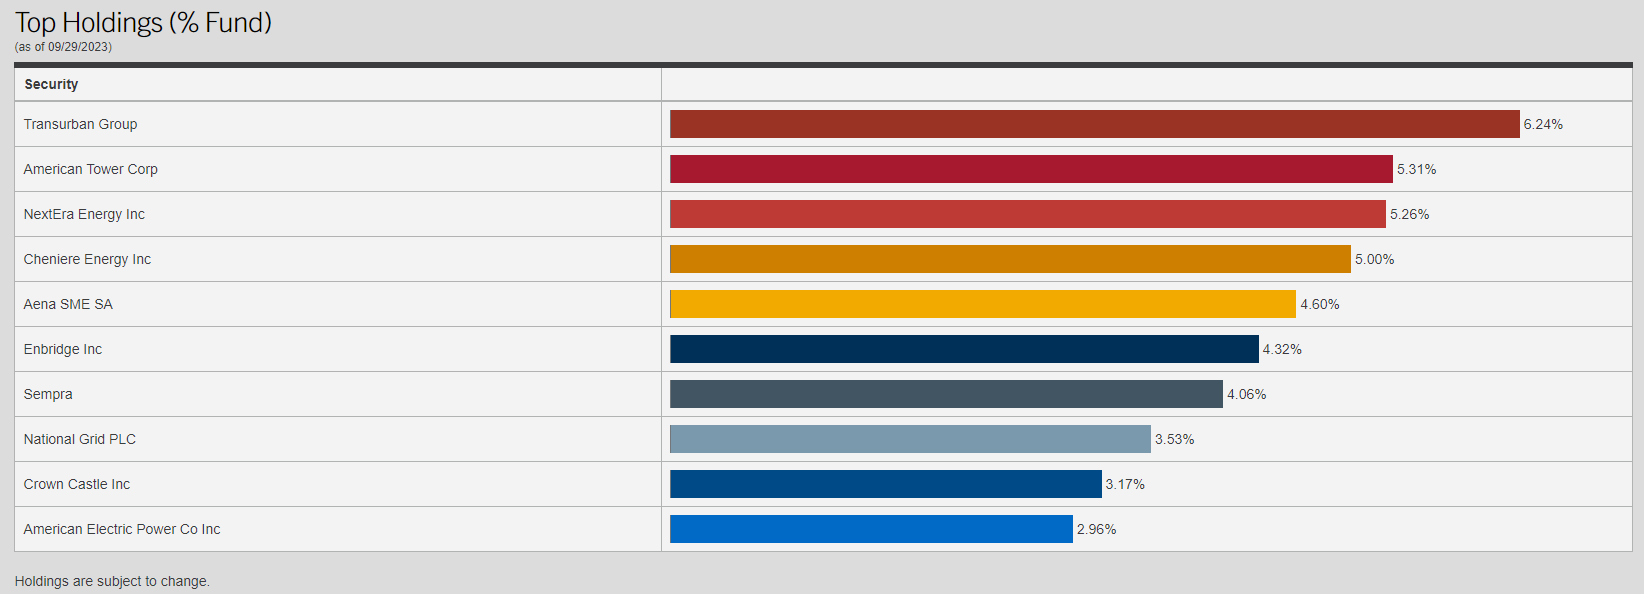
Any reader who regularly follows my work will immediately notice that all of these companies are utilities, midstream companies, or other infrastructure firms. This is in line with the statement that the fund’s fact sheet makes about the fund’s equity investment strategy:
The equity portion of the Fund invests globally in owners/operators of infrastructure in the communications, utility, transportation, and energy industries.
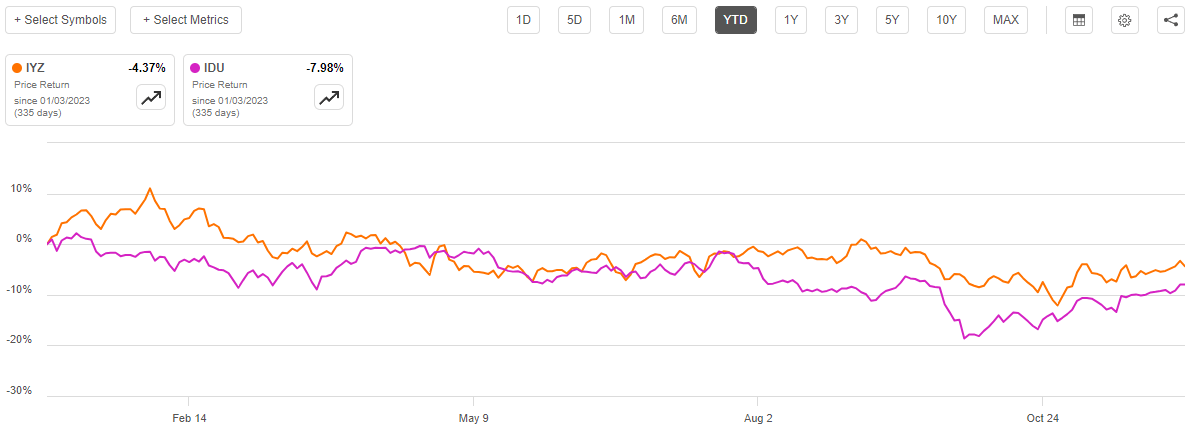
This is certainly what we see by looking at the fund’s largest holdings. Unfortunately, this could also be at the root of some of the fund’s performance problems year-to-date. With the exception of midstream energy companies, infrastructure firms have not performed particularly well this year as rising interest rates have pressured utilities and telecommunications firms. As we can see here, the iShares U.S. Telecommunications ETF ( IYZ ) is down 4.37% and the iShares U.S. Utilities ETF ( IDU ) is down 7.98% year-to-date:
This is partly because the companies in these two sectors are frequently considered to be bond proxies. As a general rule, utilities tend to be very low-growth companies that distribute a significant percentage of their cash flow to their investors in the form of dividends. The same is true of pure telecommunications companies, a few of which have been facing additional struggles over the declining demand for both wireline telephones and cable television. These companies also tend to have very high levels of debt, and as such have seen their interest expenses increase over the course of this year. I pointed this out in a few recent articles on various electric and natural gas utilities. These characteristics cause the market to price utility stocks much like bonds, so when long-term interest rates rise, their share prices decline. That has pushed down the valuation of many utilities and naturally had a negative impact on the value of the equities that are held by this fund.
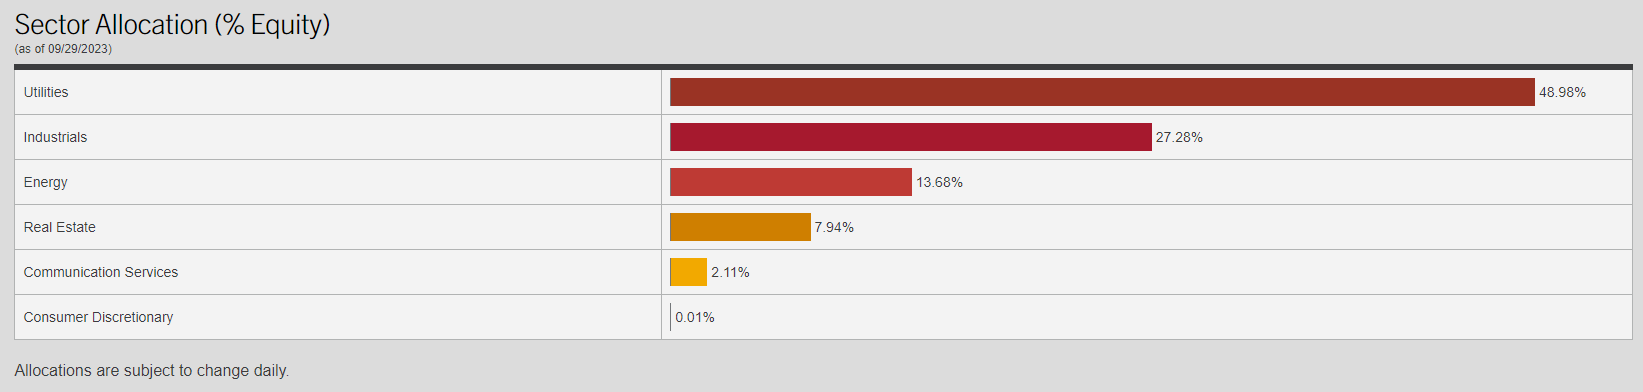
There may be some readers who point out that only four of the companies shown above are utilities. When we consider that energy infrastructure companies have actually performed reasonably well year-to-date, it may seem that the utility sector does not have enough representation in the fund’s portfolio to really drag on its performance. However, this is not the case. As we can see here, fully 48.98% of the fund’s equity assets are invested in the utility sector:
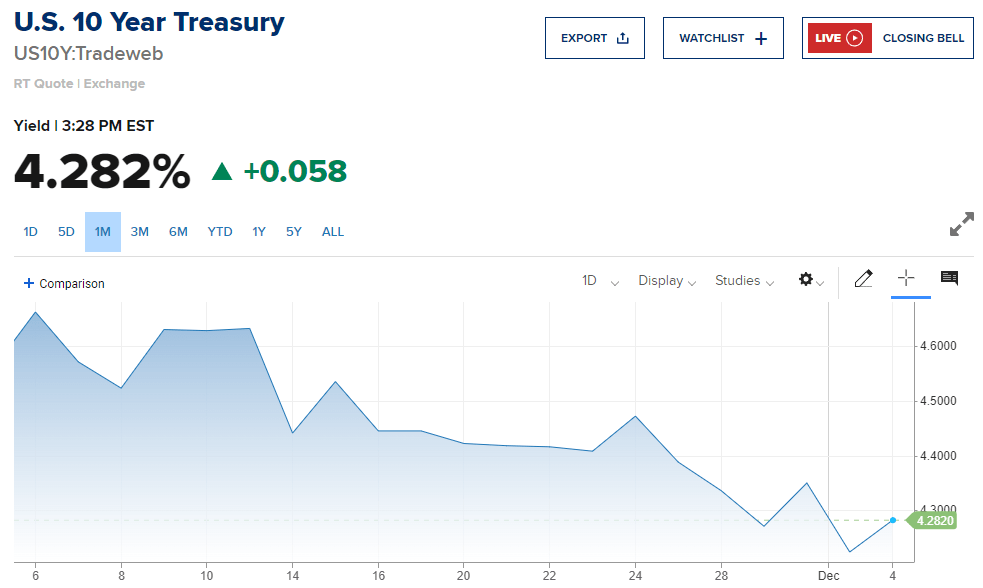
That far surpasses any other equity sector, which is disappointing. When we combine this with the bonds in the fund’s portfolio, we can quickly see that this fund has quite a lot of exposure to interest rates. This could explain why the fund has been performing pretty well since the start of November. After all, long-term interest rates have come down considerably over the past month. One month ago, the ten-year U.S. Treasury (US10Y) had a 4.6620% yield but today that yield is down to 4.282%:
As this fund has substantial holdings in both bonds and utilities, which are highly interest-rate sensitive, the fund’s share price should move inversely to the yield of the ten-year U.S. Treasury. That is indeed what we see by looking at its year-to-date performance.
It seems likely that the fund’s share price will continue to perform well if interest rates continue to decline. It is uncertain whether or not that will be the case. As we can see in the chart above, the ten-year U.S. Treasury appears to have found a certain amount of support around its current level. The current level is about 125 basis points below the current federal funds target level, which is in line with the current prediction of the fed funds futures market for December 2024.
On Friday, the Federal Reserve Chairman Jerome Powell was surprisingly hawkish during a news conference . The chairman stated:
It would be premature to conclude with confidence that we have achieved a sufficiently restrictive stance, or to speculate on when policy might ease. We are prepared to tighten policy further if it becomes appropriate to do so.
The market largely shrugged this off, but Mr. Powell is stating that the Federal Reserve might actually hike rates in 2024. This is unlikely to be a surprise for regular readers, as I have been saying for a while that the 125-basis-points of rate cuts that the market is currently predicting are unrealistic unless the economy enters a severe recession by March.
The unfortunate conclusion that we are forced to draw here is that the recent strong performance of the Virtus Total Return Fund appears to be driven by expectations of a steep decline in interest rates next year. Anyone who is buying it at this level could wind up being quite disappointed, as the failure of these rate cuts to transpire could cause the fund to reverse its recent gains. With that said, as long as it can sustain the current distribution, investors buying it today will probably have a positive total return by the end of 2025. We will discuss its ability to sustain the distribution in just a bit.
Leverage
As is the case with most closed-end funds, the Virtus Total Return Fund employs leverage as a method of boosting its total returns beyond that of any of the underlying assets that it holds in the portfolio. I explained how this works in a number of previous articles. To paraphrase myself:
Basically, the fund borrows money and then uses that borrowed money to purchase the common stock of utilities and other infrastructure companies, as well as corporate bonds. As long as the total return that it receives from the purchased assets is higher than the interest rate that the fund has to pay on the borrowed money, then the strategy works pretty well to boost the effective return that it receives from its portfolio. As this fund is capable of borrowing money at institutional rates, which are considerably lower than retail rates, this will usually be the case.
However, the use of debt in this fashion is a double-edged sword. This is because leverage boosts both gains and losses. As such, we want to ensure that the fund is not employing too much debt because that would expose us to an excessive amount of risk. I normally would like to see a fund’s leverage under a third as a percentage of its assets for this reason.
As of the time of writing, the Virtus Total Return Fund has leveraged assets comprising 32.25% of its portfolio. This is under one-third, albeit barely, and it is lower than many other closed-end funds currently possess. As such, the fund’s current leverage is probably acceptable in providing a decent balance between the risk and reward. However, we will want to keep an eye on it as we do not really want the fund’s leverage to go much higher. That could be a very real concern if the market proves to be wrong about the direction of interest rates and the value of the assets in the fund’s portfolio declines. We have already discussed this risk.
The fact that the fund employs leverage could explain some of the volatility that we have seen over the past year. After all, we already saw that this fund’s share price declined much more than either the Bloomberg U.S. Aggregate Bond Index or the U.S. Utilities Index. Its gains since the start of November have also been more than either of these indices delivered over the same period. Investors in this fund should be prepared for powerful swings in either direction due to the fund’s use of leverage.
Distribution Analysis
As mentioned earlier in this article, the Virtus Total Return Fund has the primary objective of providing its investors with a high level of capital appreciation. It does, however, have a secondary objective of the provision of current income. The fund is also heavily invested in utilities, telecommunications companies, midstream energy companies, corporate bonds, and other things that deliver the bulk of their total return in the form of direct payments to the investors. The Virtus Total Return Fund collects the payments that it receives from these companies and bonds into a pool of money, and it adds any capital gains that it manages to realize to this pool. The fund also employs a layer of leverage to control more securities than it otherwise could with just its own funds, which allows it to realize both more income and more capital gains than it can otherwise. The fund then pays out all of the money that it obtains from these operations, net of its own expenses.
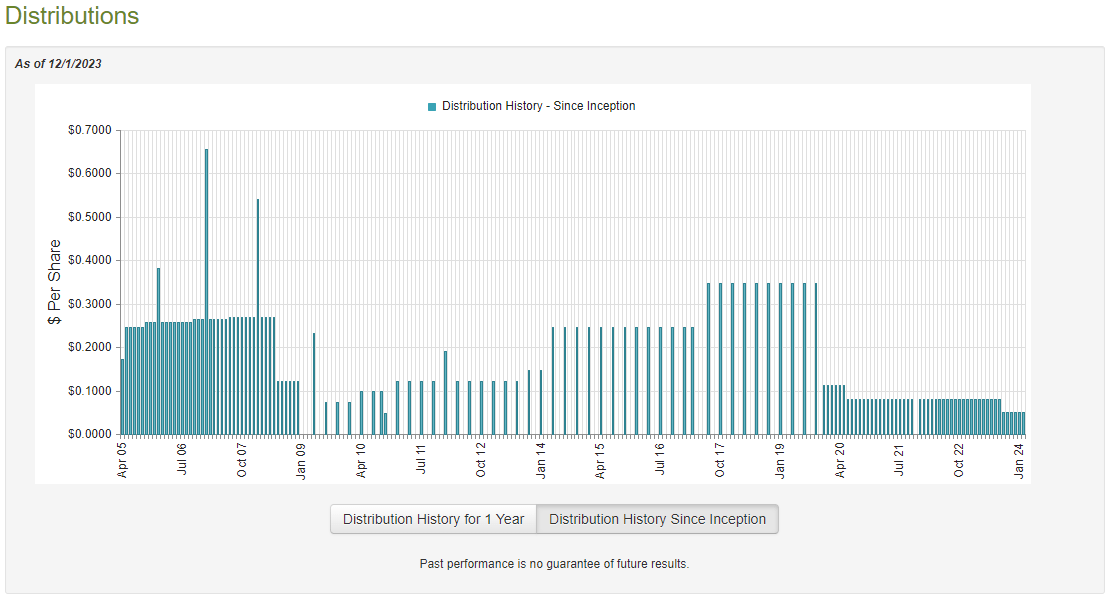
When we consider the yields of many of the fund’s assets and the potential capital gains, it might be expected that this business model would allow the fund’s shares to boast a very high yield. That is indeed the case, as the Virtus Total Return Fund pays a monthly distribution of $0.05 per share ($0.60 per share annually), which gives it an 11.03% yield at the current price. As mentioned in the introduction, this yield compares pretty well to other closed-end funds right now in either the equity or the fixed-income segments. Unfortunately, the fund’s distribution has not been especially consistent over the years. As we can see here, the Virtus Total Return Fund has both raised and lowered its distribution many times since inception, including a distribution cut earlier this year:
The fund’s history was actually pretty reasonable over most of the last decade. As we can see, it generally was able to increase its payout from the period extending from the 2009 recession to the outbreak of the COVID-19 pandemic. Its more recent history has not been particularly encouraging, however. That will probably be something of a turn-off for any investor who is seeking to earn a safe and secure income from the assets in their portfolios. However, the cut earlier this year can be easily explained by the poor performance of both utility companies and bonds over the past two years. These losses almost certainly caused the fund to take some losses and cut its distribution to avoid unnecessary destruction of its net asset value.
As I have pointed out various times in the past, the fund’s distribution history is perhaps not the most important thing for anyone considering purchasing the fund today. After all, today’s buyer will receive the current distribution at the current yield and will not be adversely affected by the actions that the fund has taken in the past. As such, the most important thing for a buyer today is the fund’s ability to sustain its distribution at the current level. Let us investigate this.
Unfortunately, we do not have an especially recent document that we can consult for the purpose of our analysis. As of the time of writing, the fund’s most recent financial report corresponds to the six-month period that ended on May 31, 2023. As such, this report will not include anything that happened over the past six months. This is unfortunate because it excludes the entire period of rising long-term interest rates that happened over the summer. That event almost certainly resulted in the fund suffering some realized and unrealized losses that would have an effect on its ability to maintain its distribution. The fund’s own managers appear to confirm this conclusion with the distribution cut back in August. We will need to wait until the fund releases its full-year report in a few months before we can evaluate its performance during this event. There is no real sense in complaining though, so let us take a look at what we have available to us.
During the six-month period, the Virtus Total Return Fund received $8.813 million in dividends and $4.986 million in interest from the assets in its portfolio. We need to remove the money that the fund had to pay in foreign withholding taxes from this amount, which gives it a total investment income of $13.290 million during the period. The fund paid its expenses out of this amount, which left it with $4.412 million available to the shareholders. That was, obviously, nowhere close to enough to cover the distribution that it paid out over the period. The fund paid out a total of $32.918 million over the six-month period. At first glance, this is likely to be concerning as the fund’s net investment income was nowhere near enough to cover the distribution that it pays out.
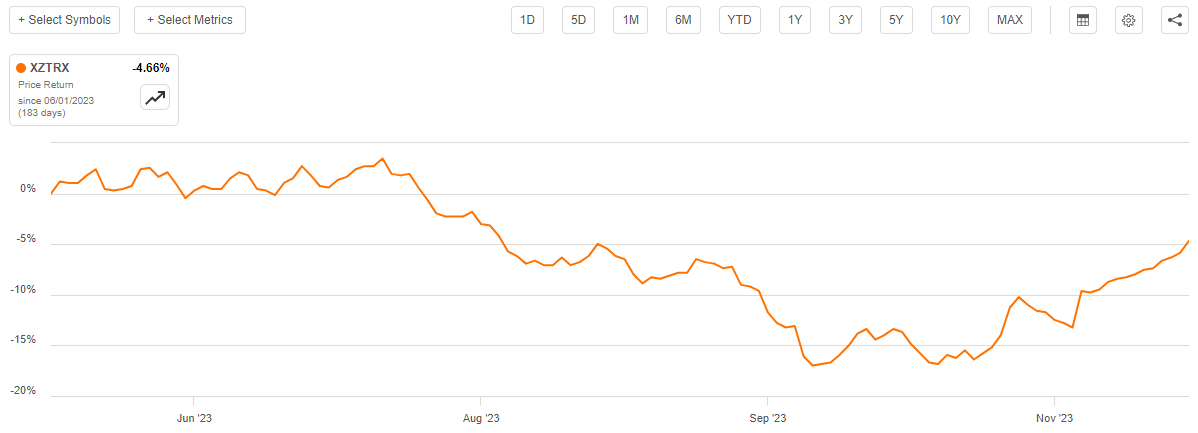
However, the fund has other methods through which it can obtain the money that it needs to cover the distribution. For example, it might be able to realize capital gains that can be paid out to the shareholders. Capital gains are not included in net investment income, but they clearly represent money coming into the fund. Unfortunately, the fund generally failed at this task during the period. It did manage to achieve net realized gains of $3.623 million during the period but these were more than offset by net unrealized losses of $36.729 million. Overall, the fund’s net assets declined by $61.612 million after accounting for all inflows and outflows during the period. This is certainly concerning as it clearly demonstrates that the fund is failing to cover its distributions. It also explains why the fund’s managers saw fit to cut the distribution. Unfortunately, it appears that the fund may still be unable to cover the distribution at the lower level. As we can see here, the fund’s net asset value per share is down 4.66% since June 1, 2023:
This strongly suggests that the fund is bleeding capital, which is not a good thing for distribution sustainability if the fund fails to correct this problem in the near future.
Valuation
As of December 1, 2023 (the most recent date for which data is currently available), the Virtus Total Return Fund has a net asset value of $6.34 per share but the shares currently trade for $5.42 each. This gives the shares a 17.35% discount on net asset value at the current price. This is an enormous discount that is actually better than the 15.69% discount that the shares have traded at on average over the past month. Thus, the current entry price is certainly reasonable if you want to add this fund to your portfolio.
Conclusion
In conclusion, the Virtus Total Return Fund is an interesting fund that invests in a combination of common equities issued by utilities and other infrastructure companies as well as bonds. These assets tend to be quite sensitive to interest rates, which has clearly dragged on the fund over the past year or two. It has generally been struggling to maintain its distribution over the past year, even though it cut it back in August.
The Virtus Total Return Fund Inc. might be okay if the market is correct about the direction of interest rates, but there is no guarantee that this will be the case. It may be best to avoid this fund for now until we get more visibility.
For further details see:
ZTR: Avoid This Fund Until We Get More Visibility