FTS - 10 Dividend Aristocrats For The Ultimate High-Yield SWAN Portfolio
2023-05-03 07:15:00 ET
Summary
- The 2023 recession is likely to be mild, but the debt ceiling crisis means that a 15% to 30% market correction is likely coming soon.
- Trust ultra low volatility aristocrats rather than market timing to help you sleep well at night in the coming market mayhem.
- These ten aristocrats average a 3.7% very safe yield, a 38-year dividend growth streak, and offer 11% long-term return potential, just as they've delivered for the last 30 years.
- While averaging 66% smaller peak bear market declines than the S&P since 1996, including a 22% decline in the Great Recession.
- Add two hedging ETFs, and you still enjoy about 9.5% long-term returns, along with a 5.8% safe yield and average bear market declines of 2%, 92% less than the S&P and 40% less than the 60/40. This hedged portfolio fell 9.5% during the Great Recession, and its probability of experiencing a bear market in the next 75 years is 0.28%, with a 0.03% chance of a 25% decline.
This article was published on Dividend Kings on Monday, May 1st
---------------------------------------------------------------------------------------
In part 1 of this series, I showed you why the failure of First Republic isn't something to be concerned about.
However, I also showed you why the debt ceiling crisis, while 98.24% likely not to end in disaster, is something that could likely cause the market to suffer a 15% to 30% decline that would price in the 2023 recession.
Daily Shot
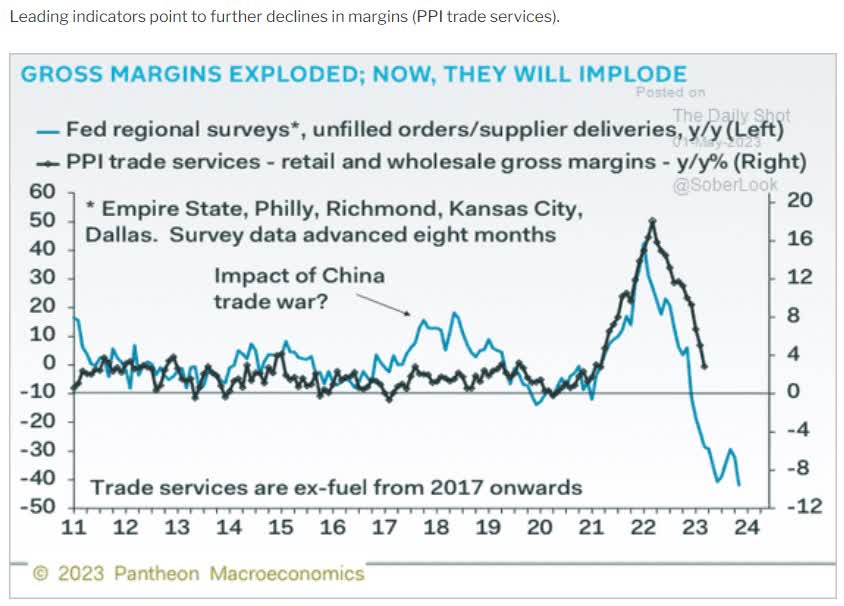
The economy is weakening and so far margins have held up, thanks to strong pricing power like this:
- Pepsi +14% price hike for 2023
- Coke +12%
- KMB, PG, and SJM +8%
But there is a limit to how high consumers can stomach rising prices.
And that's likely what Jamie Dimon is talking about with this warning.
Yes, this part of the regional banking crisis is over. The duration mismatch and liquidity issues that sunk four banks so far.
But let's not forget that the bank failures so far were with what Dimon calls "pristine loans".
Daily Shot
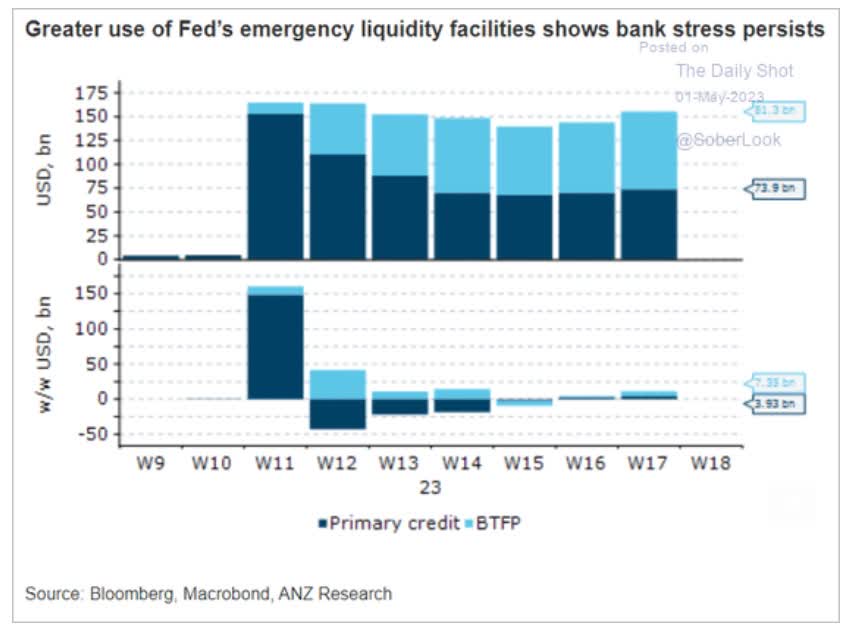
Banks are starting to take on a bit more emergency loans from the Fed, possibly due to modest deposit flight following FRC's 85% plunge last week.
The loans that sunk First Republic were mostly jumbo mortgages with very affluent customers.
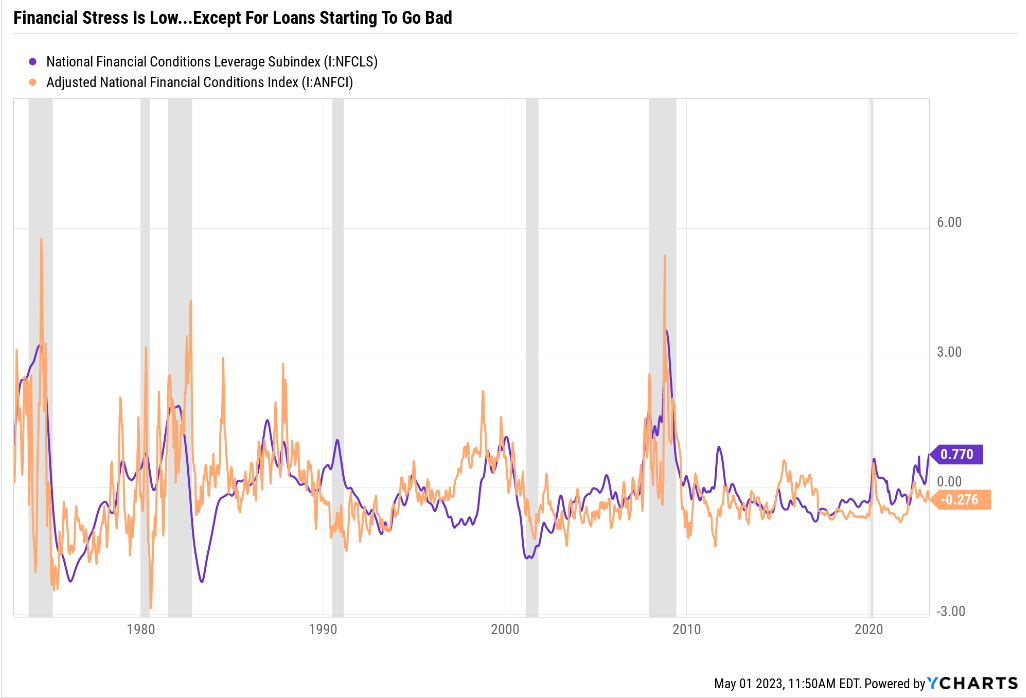
The loan default rates were very low, but in a recession, default rates start to rise. And that's what we're starting to see in the data.
Ycharts
What is the leverage subindex of the Chicago Fed's National Financial Conditions Index?
The Chicago Fed’s National Financial Conditions Index (NFCI) provides a comprehensive weekly update on U.S. financial conditions in money markets, debt, and equity markets, and the traditional and “shadow” banking systems. " - Chicago Fed
It's the first warning sign of a traditional recessionary rise in loan losses.
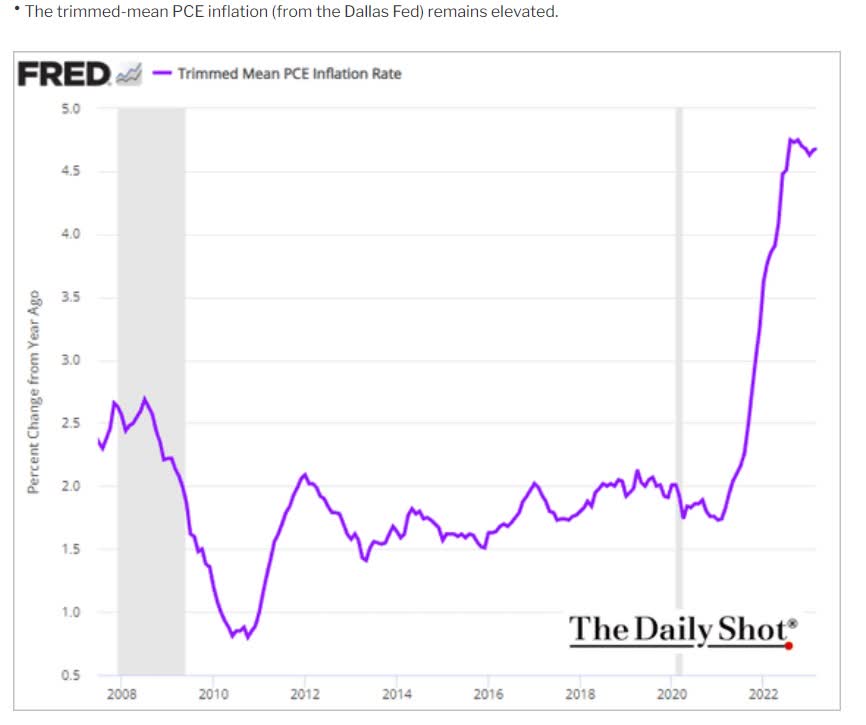
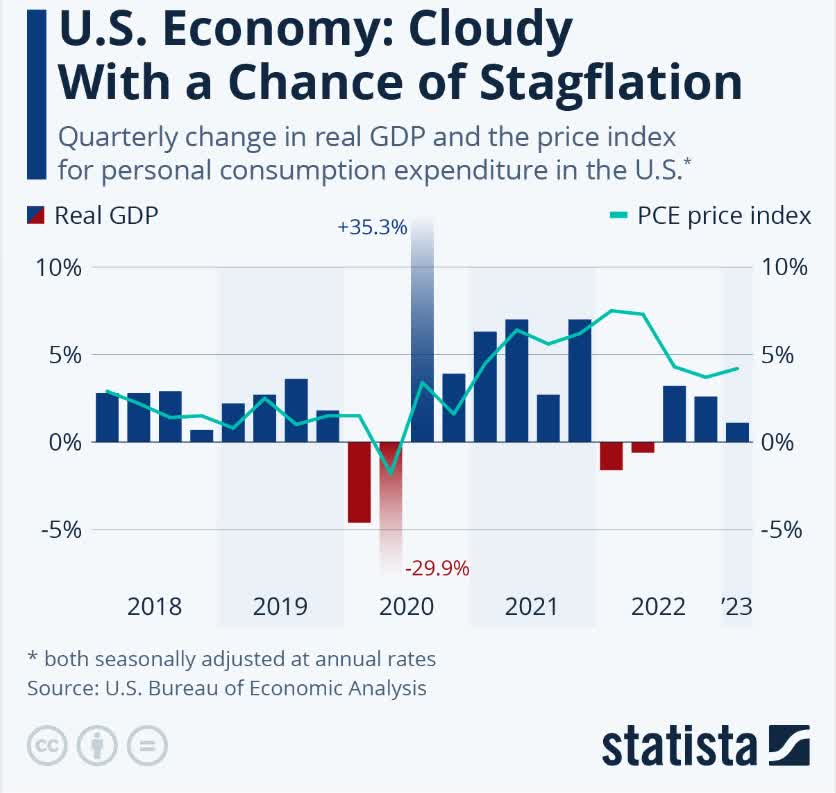
For the moment economic data is merely pointing to very slow growth with stubbornly high inflation, ie stagflation.
Daily Shot
Does this look like inflation that's under control?
Statista
Does this look like the kind of thriving economy that drives earnings growth like this?
S&P FactSet Bottom-Up Consensus
FactSet Research Terminal
According to Bank of America, if earnings growth in 2023 and 2024 is 1% each year, as economists currently expect, that would result in about 5% EPS growth in both years, half the current expectation.
Daily Shot
This isn't exactly a reason to be bullish in the short-term.
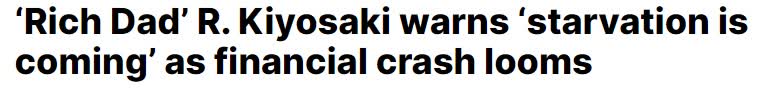
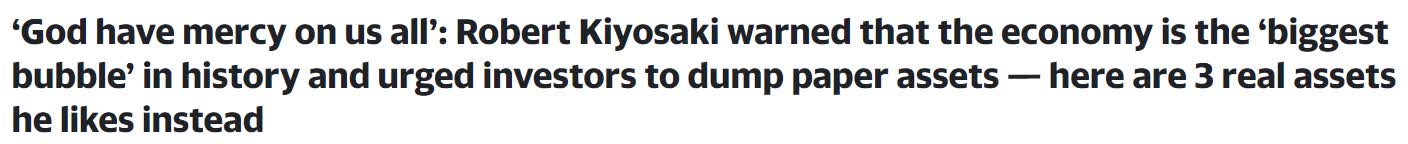
Though that doesn't mean it's time to sell everything and hide in cash.. . or Robert Kiyosaki's bunker, packed to the rafters with canned food and gold;)
Finbold
Yahoo Finance
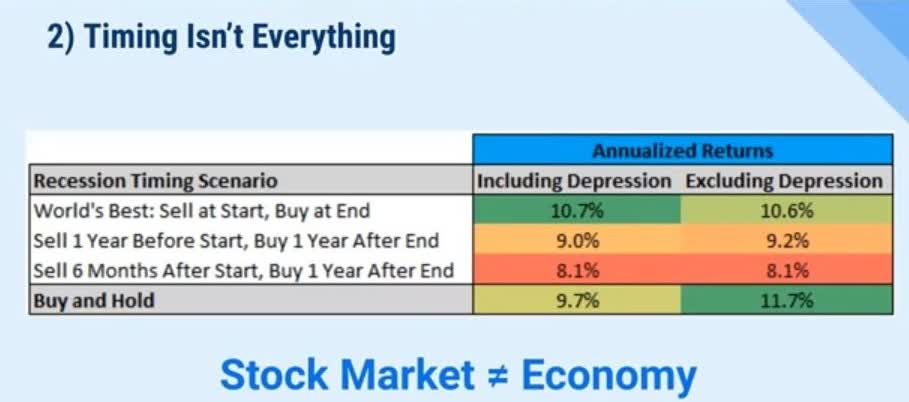
Why? Because even if you could perfectly time the economy, which no one actually can, it wouldn't improve your stock returns.
Charlie Bilello
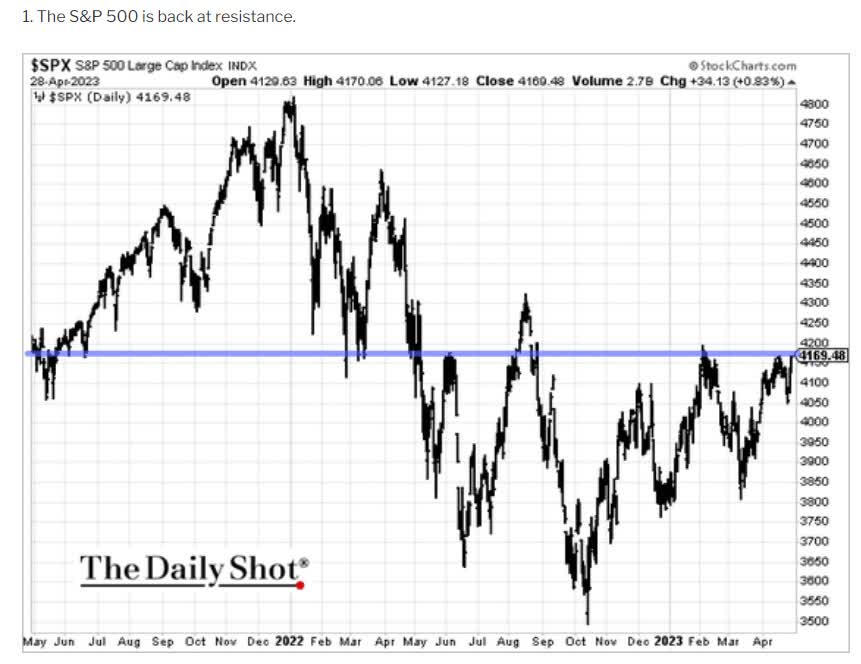
So what's the answer? What if stocks were to fall 15% to 30% in the next few months? Remember that 15% to 30% is the most likely outcome, but it's possible stocks will trade flat for the next year.
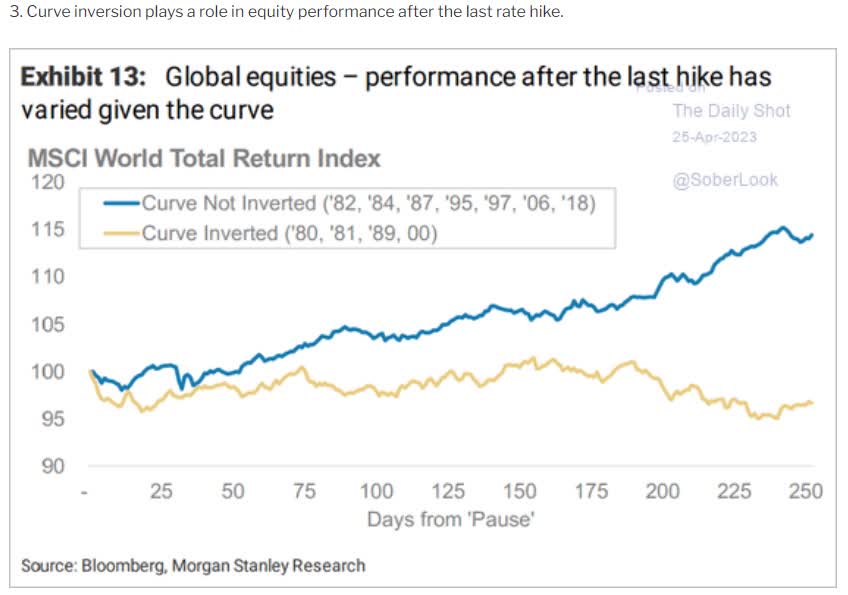
Daily Shot
Guess what happened historically after the Fed pauses when the yield curve is inverted? Stocks neither fall off a cliff nor go up.
They go sideways at a breakneck pace;)
So this is where low-volatility aristocrats come in. I promised in part one that in conclusion to this mini-series, I'd show you how to build the ultimate low-volatility Ultra Sleep Well At Night portfolio.
One that you can trust for good yield, good returns, and that you can ride out any market crash or economic downturn.
How To Find The Best Dividend Aristocrats For The Ultimate Low Volatility SWAN Portfolio
Let me show you how to screen the Dividend Kings Zen Research Terminal, which runs off the DK 500 Master List, to find the best low-volatility dividend aristocrats for this recession.
The Dividend Kings 500 Master List includes some of the world's best companies, including:
- Every dividend champion (25+ year dividend growth streaks, including foreign aristocrats)
- Every dividend aristocrat
- Every dividend king (50+ year dividend growth streaks)
- Every Ultra SWAN (as close to perfect quality companies as exist)
- The 20% highest quality REITs, according to iREIT
- 40 of the world's best-growth blue chips
The key with any screen is to remember that whatever metric you're targeting is never enough on its own.
- Valuation always matters
- Total return always matters
- Total return is yield + growth + changes in valuation
In other words, you don't want a 10% volatility stock with a 1% yield and 2% growth rate because that's 3% long-term returns. You can buy T-bill ETFs yielding 5% with virtually no volatility and no fundamental risk.
| Step |
| Screening Criteria |
| Companies Remaining |
| % Of Master List |
| 1 |
| Dividend Champions List |
| 133 |
| 26.60% |
| 2 |
| Reasonable Buy or better (nothing overvalued) |
| 75 |
| 15.00% |
| 3 |
| Long-Term Total Return Potential 8% |
| 59 |
| 11.80% |
| 4 |
| Non-Speculative (No Turnaround Stocks, investment grade) |
| 48 |
| 9.60% |
| 5 |
| Sort By Volatility |
| 0.00% |
| 6 |
| Select 10 lowest volatility aristocrats |
| 0.00% |
| 7 |
| Use "build your watchlist" to get just those 10 aristocrats |
| 13 |
| 2.60% |
| Total Time |
| 2 Minutes |
10 Dividend Aristocrats For The Ultimate High-Yield SWAN Portfolio
I've linked to articles providing each company's investment thesis and risk profile.
Dividend Kings Zen Research Terminal
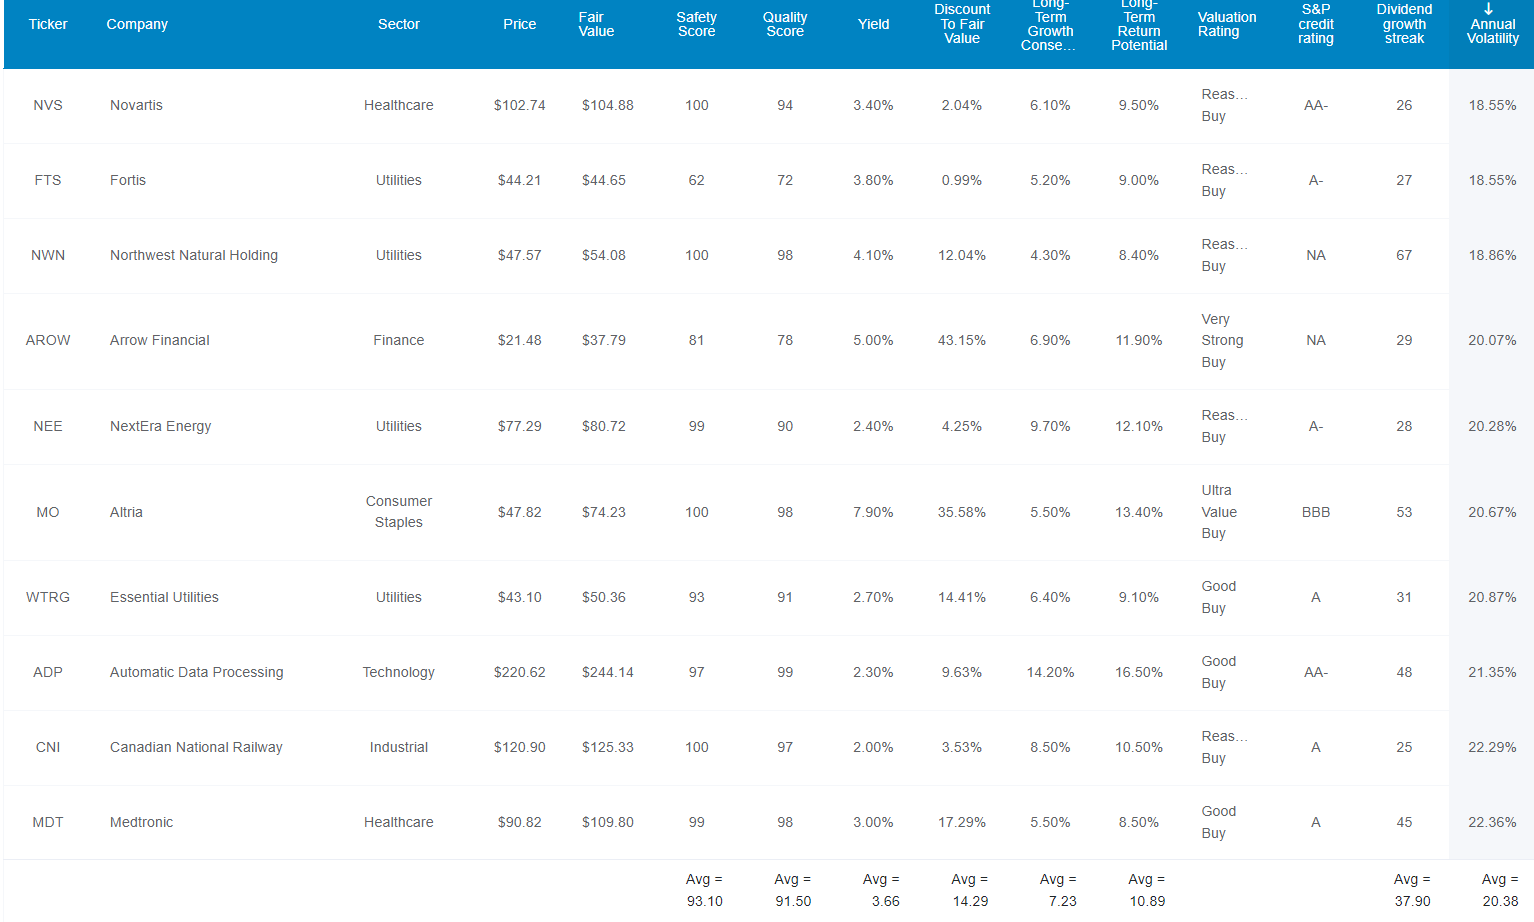
Here they are in order of lowest annual volatility.
- Novartis ( NVS )
- Fortis ( FTS )
- Northwest Natural ( NWN )
- Arrow Financial ( AROW )
- NextEra Energy ( NEE )
- Altria ( MO )
- Essential Utilities ( WTRG )
- Automatic Data Processing ( ADP )
- Canadian National Railway ( CNI )
- Medtronic ( MDT )
Tax Implications
- NVS is Swiss
- 15% tax withholding
- if your broker files the appropriate paperwork
- OWN IN TAXABLE ACCOUNT
- retirement accounts don't get the tax credit
- FTS and CNI are Canadian
- 15% dividend withholding in taxable accounts
- none in retirement accounts
- own in retirement accounts to avoid paperwork
- tax credit available to recoup the withholding taxable accounts
FAST Graphs
Novartis Consensus Total Return Potential
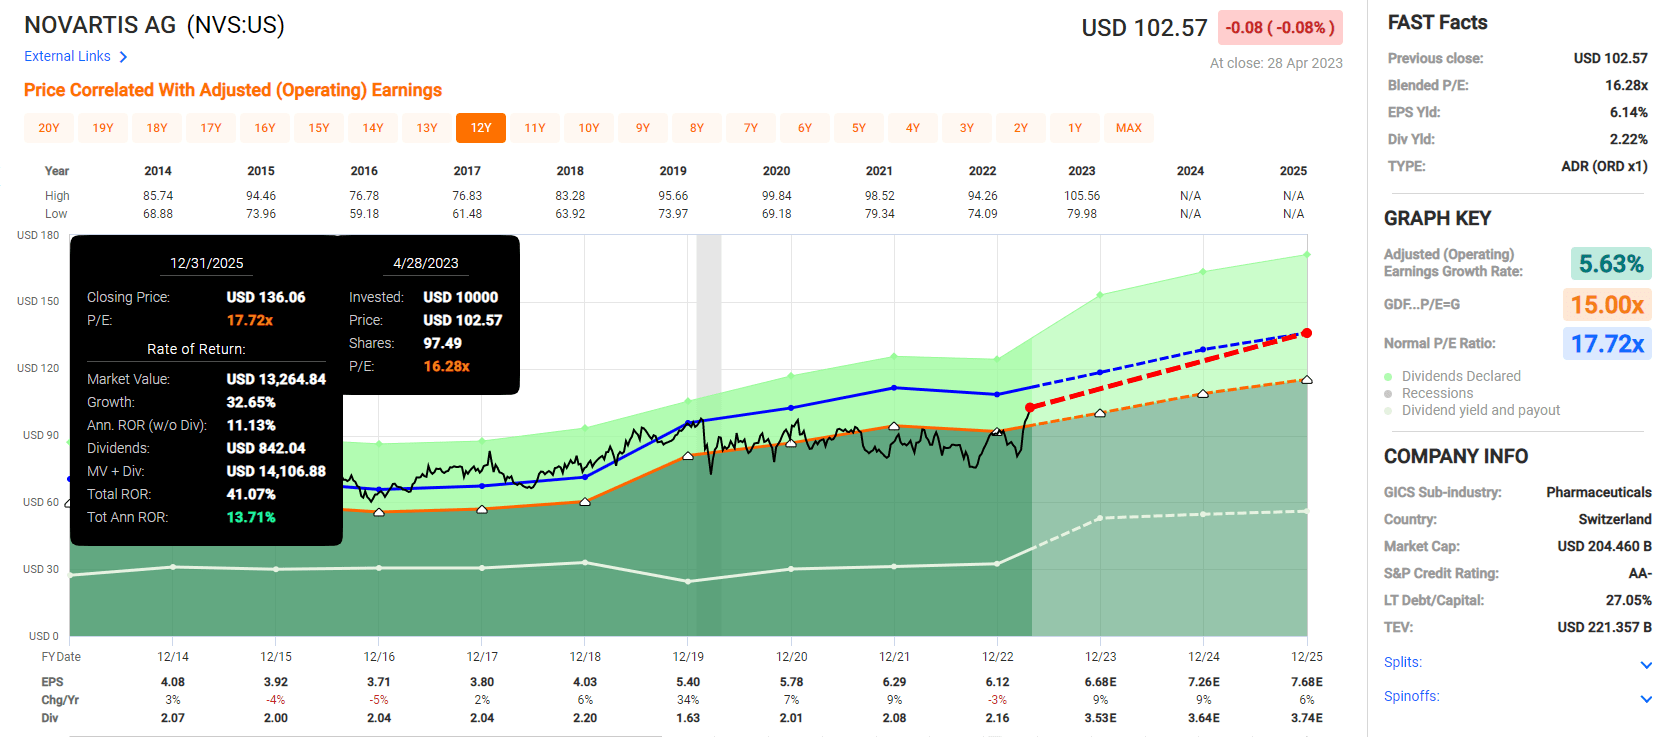
FAST Graphs, FactSet
Fortis Consensus Total Return Potential
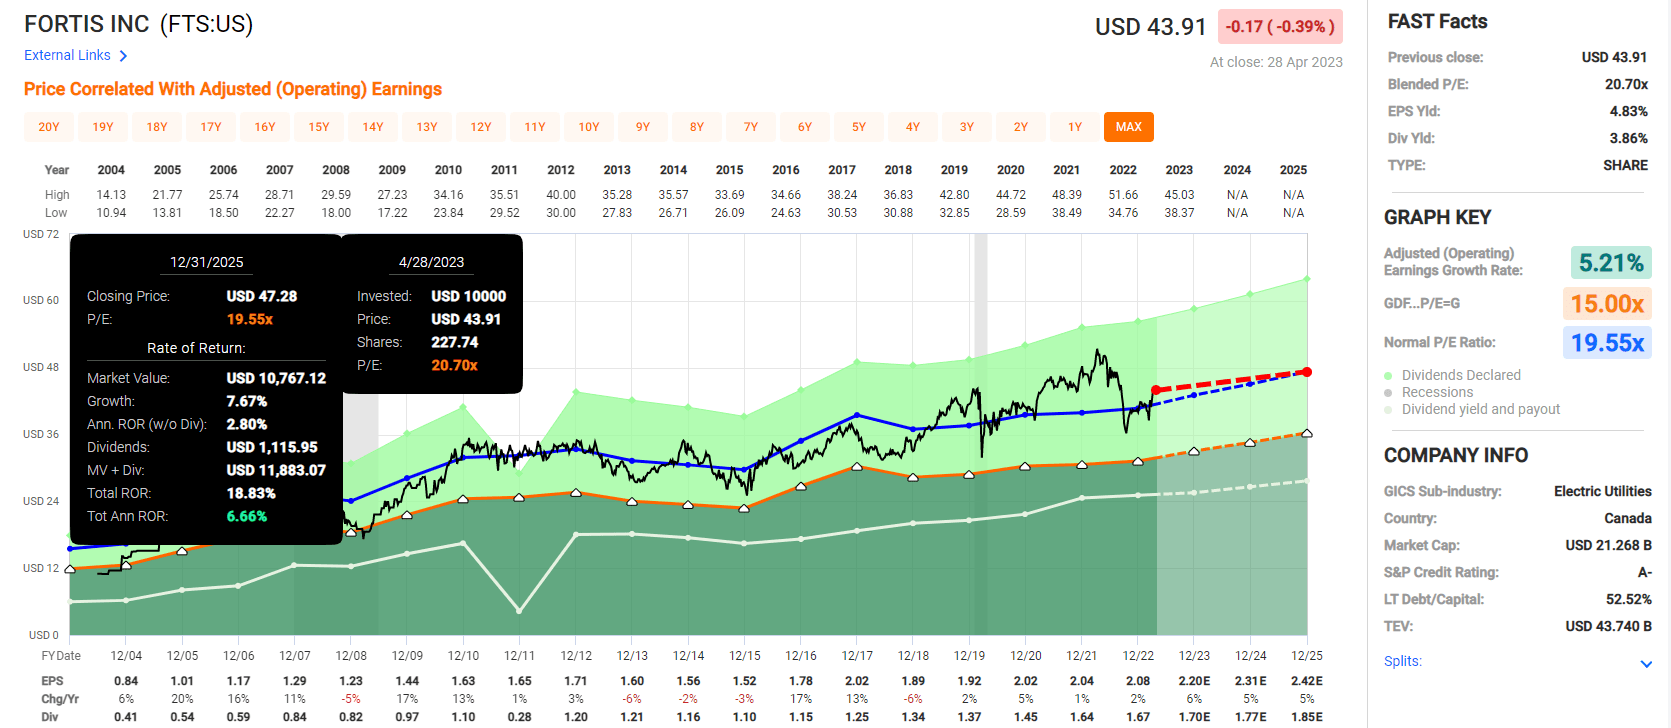
FAST Graphs, FactSet
Northwest Northern Consensus Total Return Potential
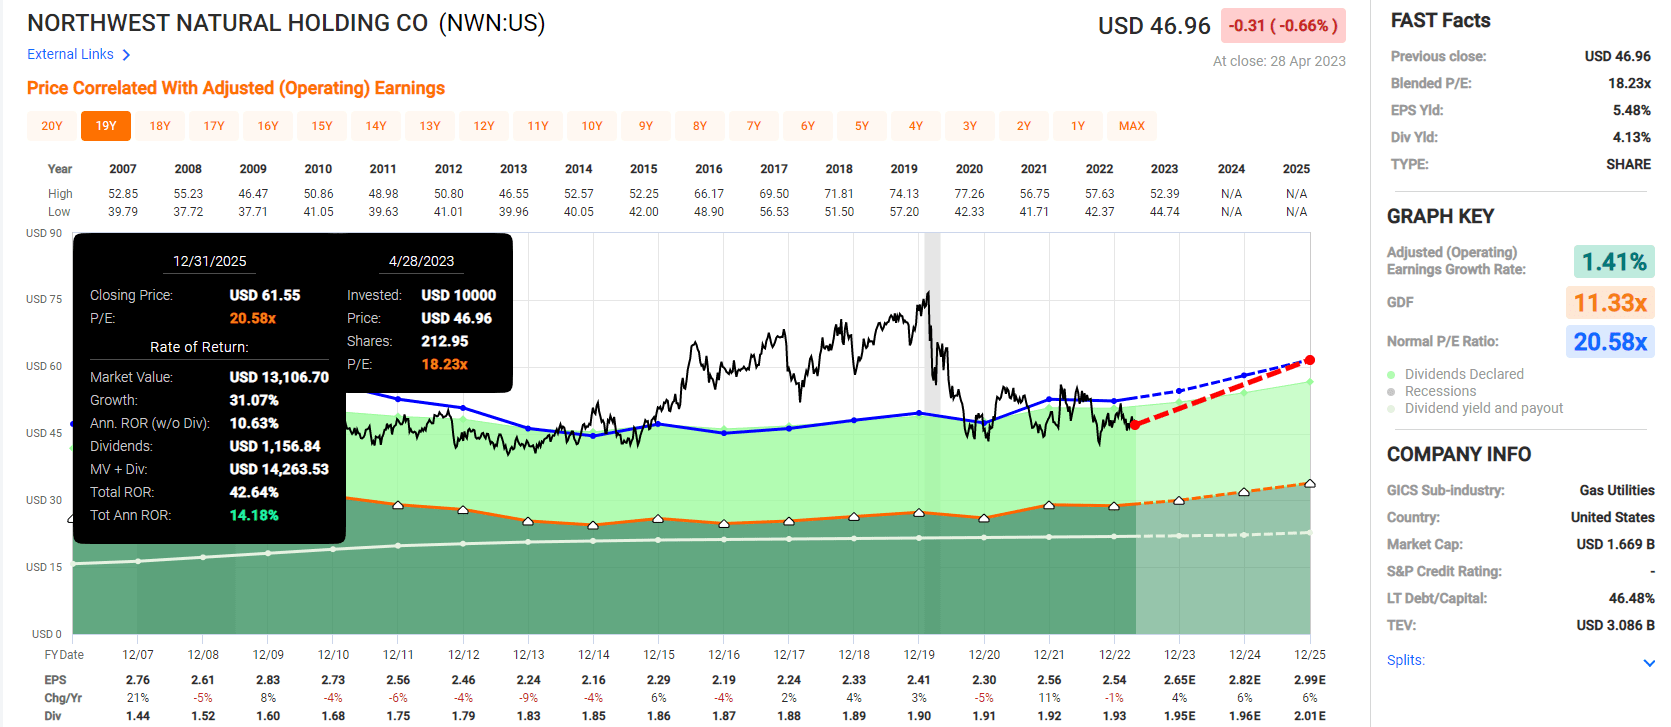
FAST Graphs, FactSet
Arrow Financial Consensus Total Return Potential
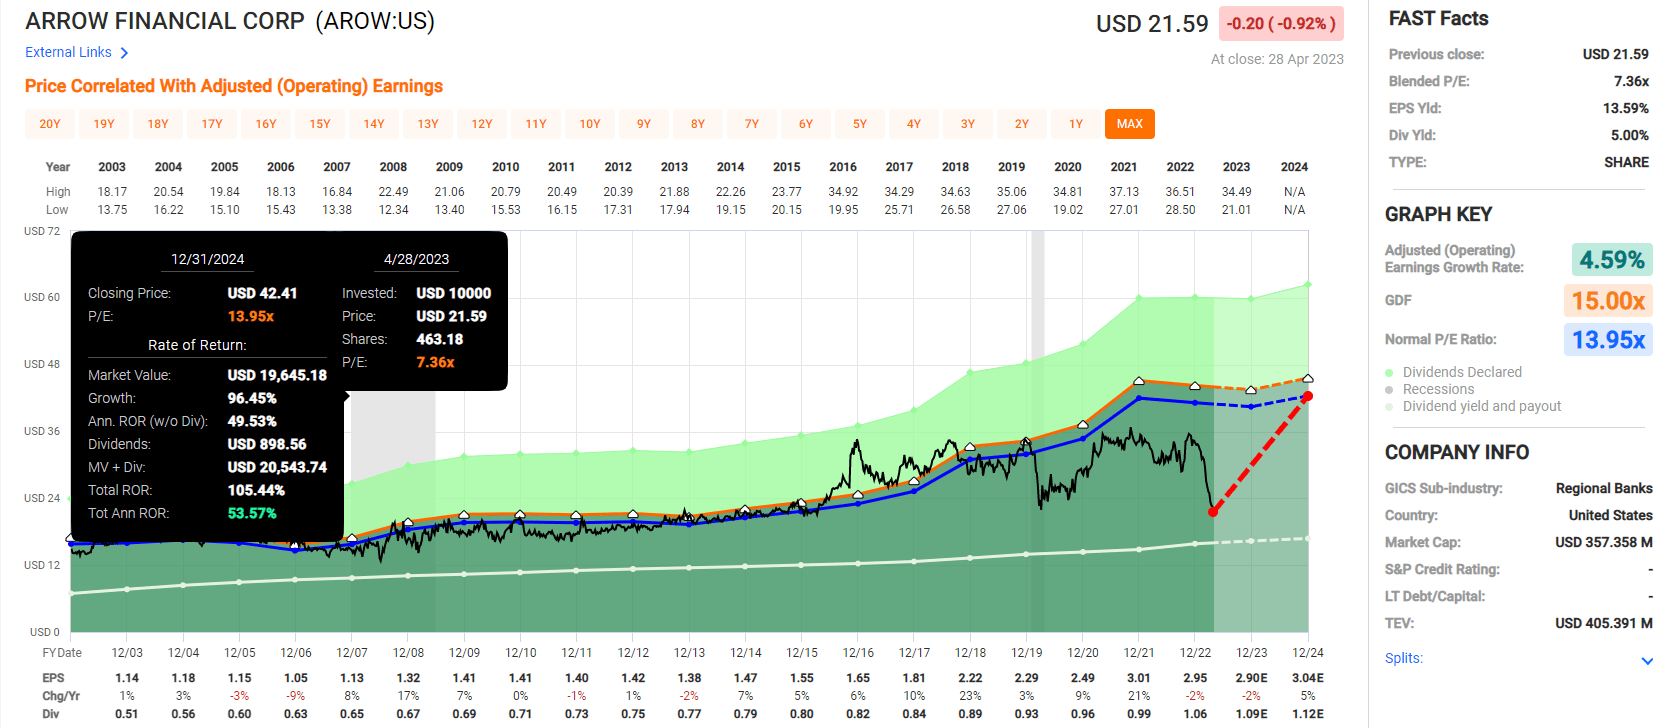
FAST Graphs, FactSet
NextEra Energy Consensus Total Return Potential
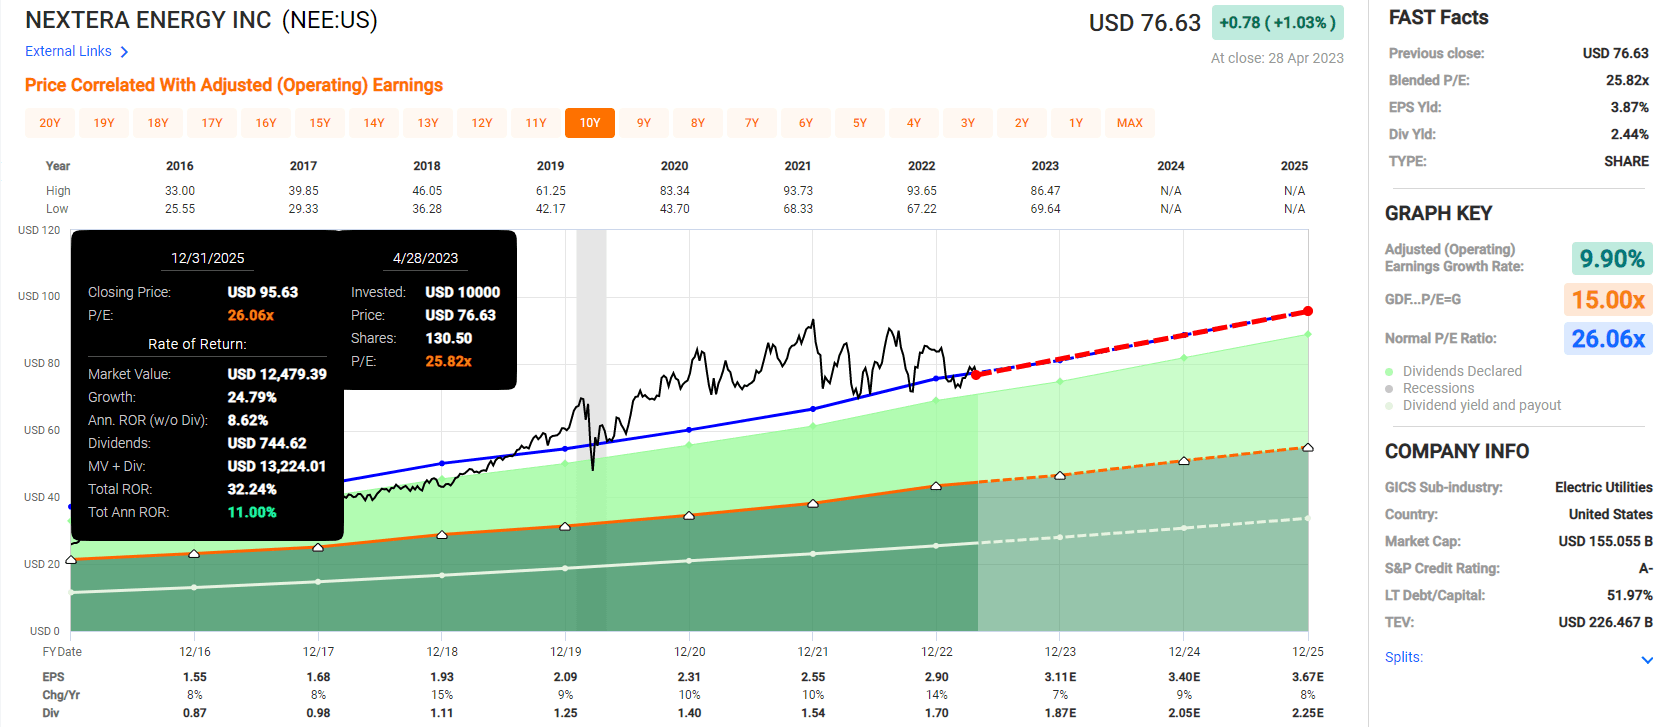
FAST Graphs, FactSet
Altria Consensus Total Return Potential
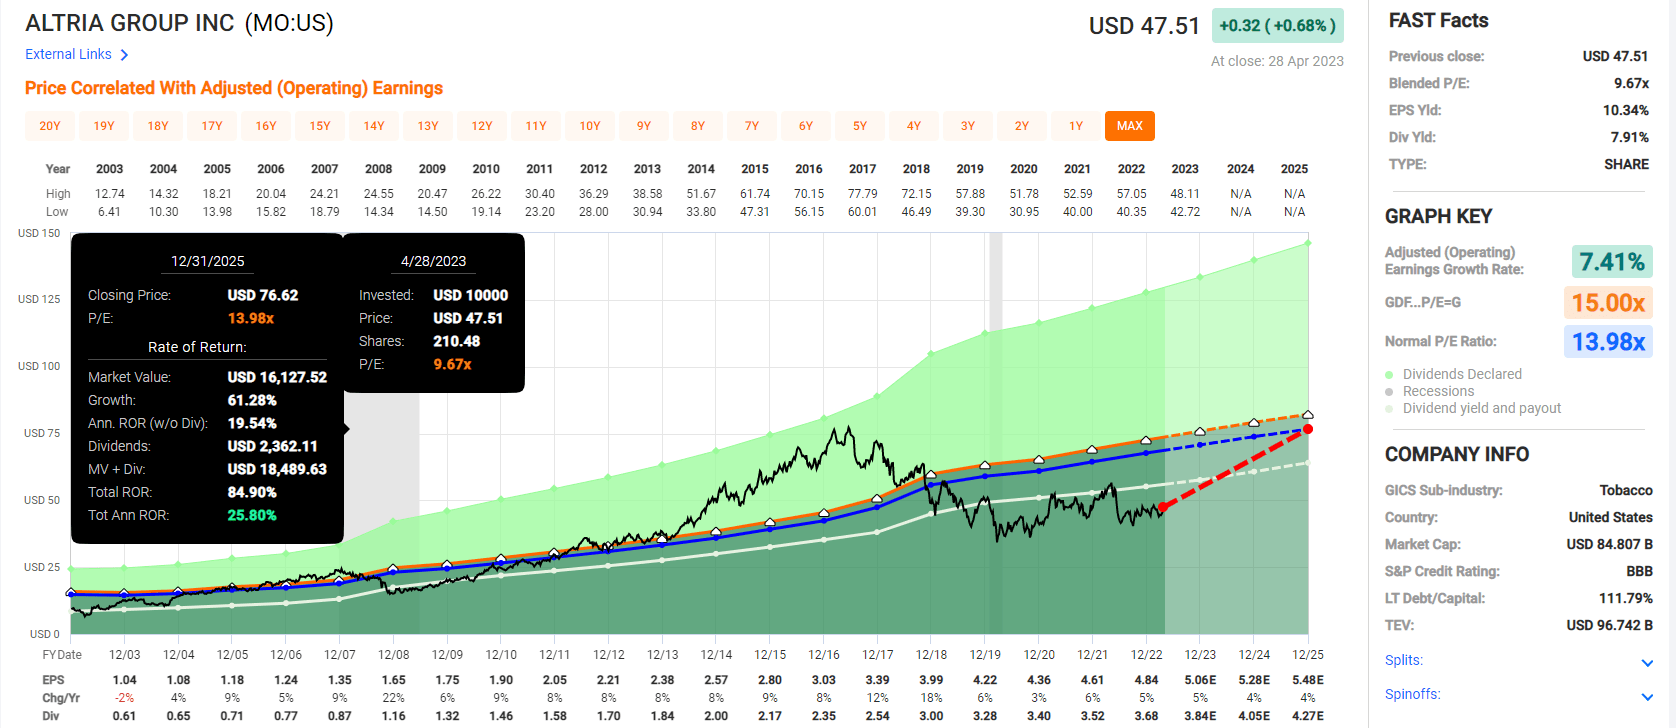
FAST Graphs, FactSet
Essential Utilities Consensus Total Return Potential
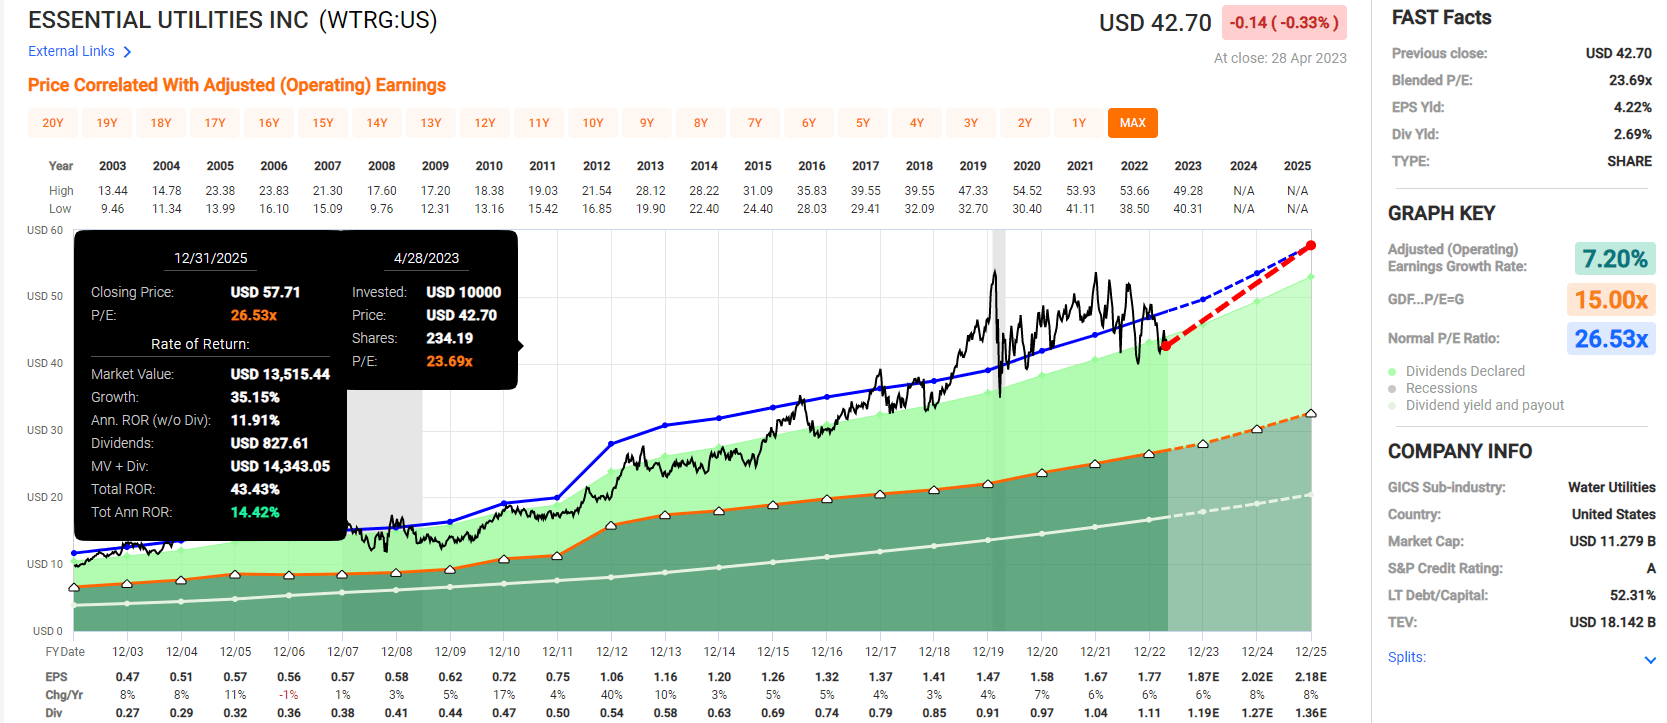
FAST Graphs, FactSet
Automatic Data Processing Consensus Total Return Potential
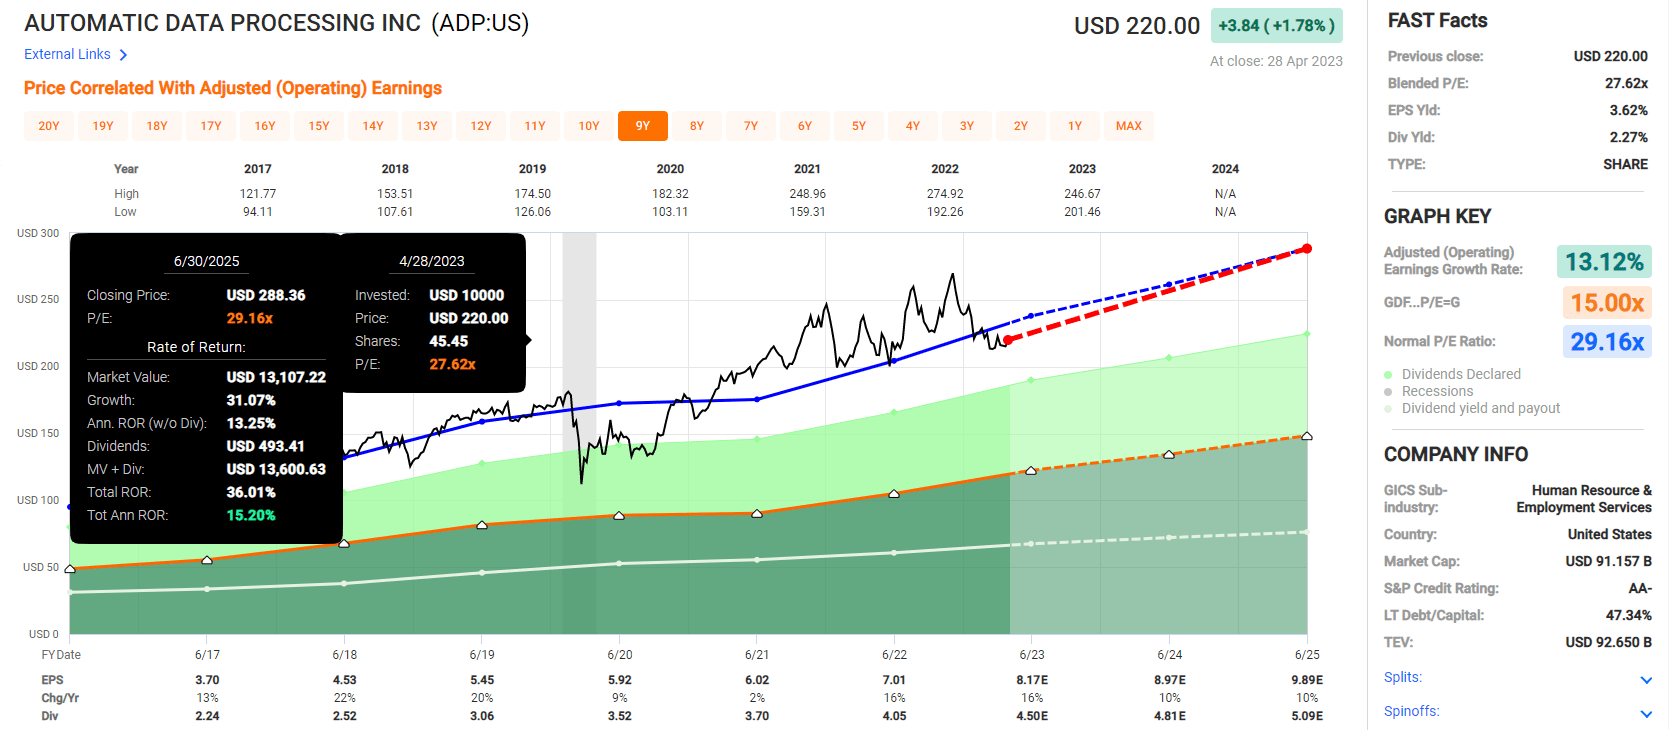
FAST Graphs, FactSet
Canadian National Railway Consensus Total Return Potential
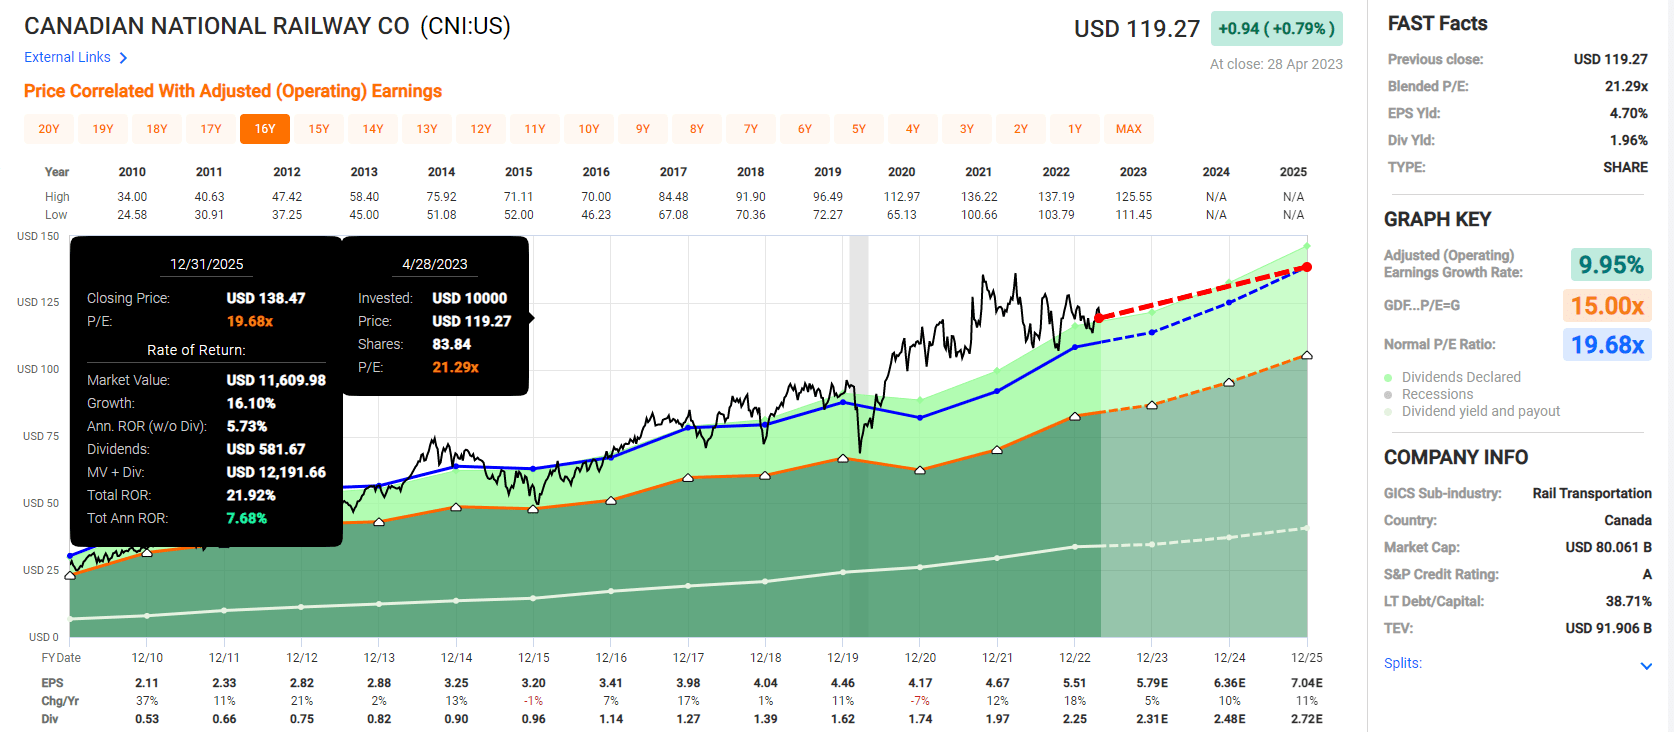
FAST Graphs, FactSet
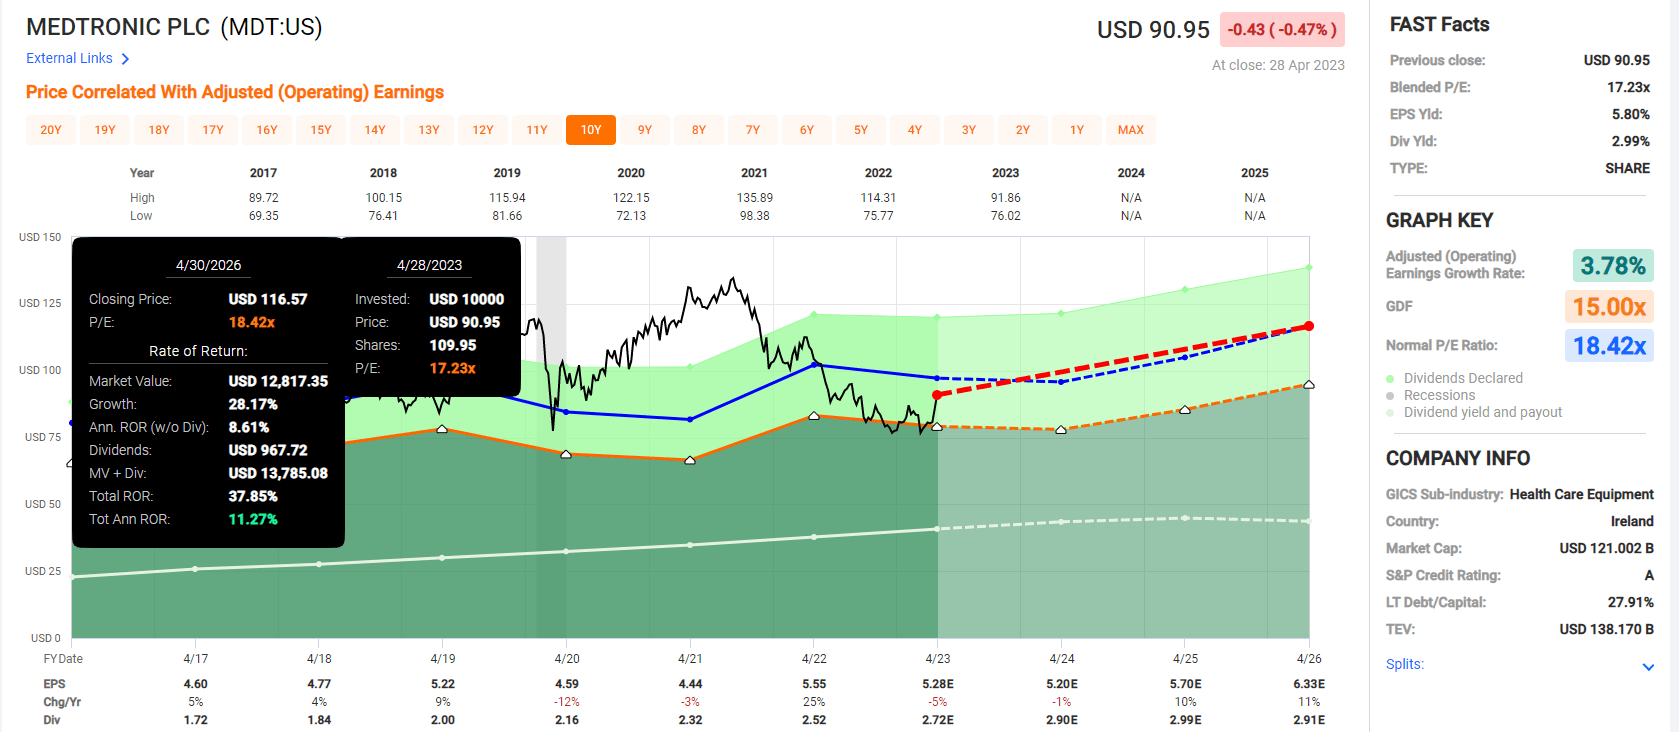
Medtronic Consensus Total Return Potential
FAST Graphs, FactSet
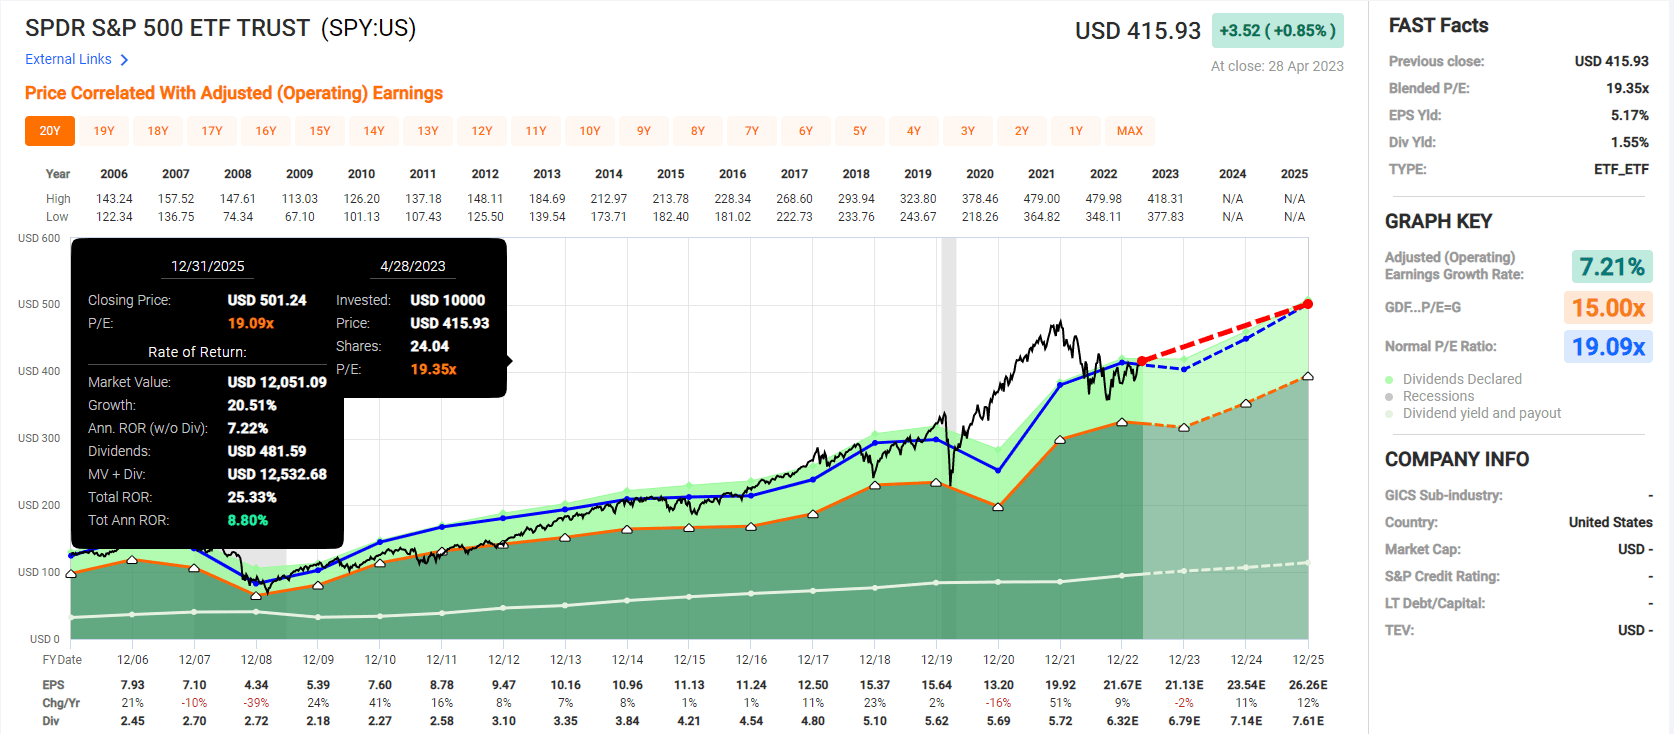
S&P Consensus Total Return Potential
FAST Graphs, FactSet
S&P Consensus: 25% total return by 2025 = 9% annually
Low volatility aristocrat consensus: 46% total return by 2025 = 16% annually.
Twice the return potential of the market, and look at the fundamentals.
Fundamentals Summary
- 3.7% very safe yield (1.15% severe recession dividend cut risk)
- discount to fair value: 14% vs. -8% S&P
- long-term growth consensus: 7.2%
- long-term total return consensus: 10.9% vs. 10.2% S&P
- consensus 10-year return potential: 3.7% yield + 7.2% growth + 1.5% valuation boost = 11.4% vs. 9.4% S&P
- consensus 10-year return potential: 194% vs. 146% S&P
- average dividend growth streak: 38 years (since 1985)
- average annual volatility: 20.4% vs. 28% standalone companies and 25% aristocrats
How would you like to enjoy a 2.5X safer yield than the S&P while beating the market and with much lower volatility to boot?
That's what these aristocrats offer.
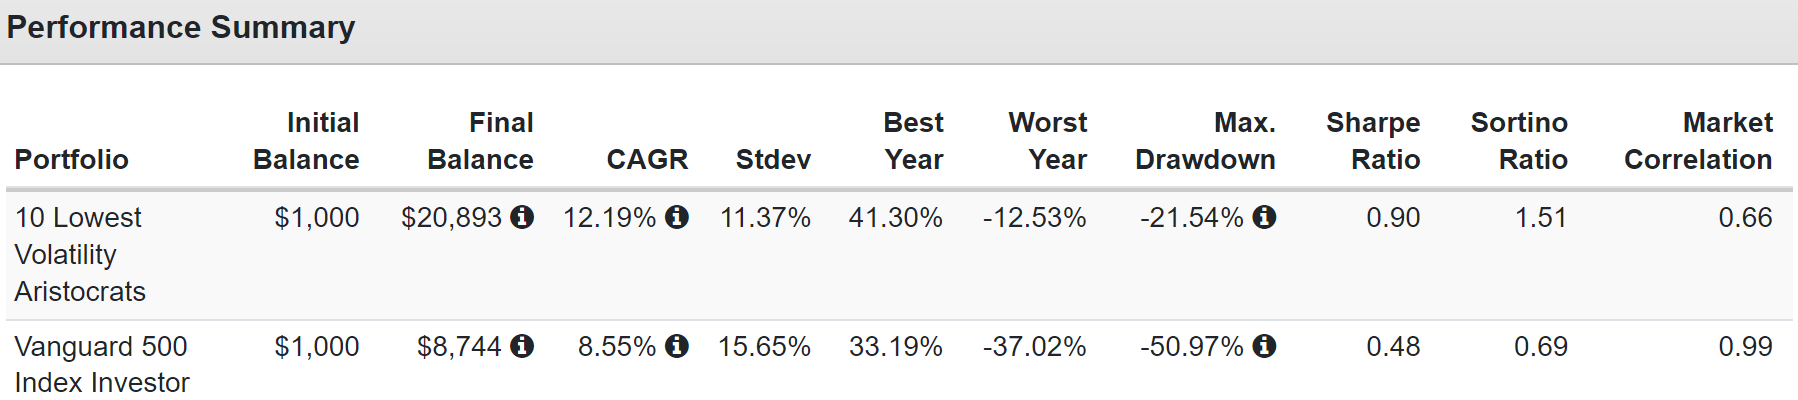
Historical Total Returns Since 1994
Portfolio Visualizer Premium
11% annual volatility is as low as a 60/40 stock/bond portfolio and 22% peak decline in the Great Recession is actually half the peak decline of the 60/40.
But with no bonds and with 2X the negative-volatility-adjusted returns of the S&P for the last 29 years.
- This portfolio captures 67% of the market's upside and 39% of its downside
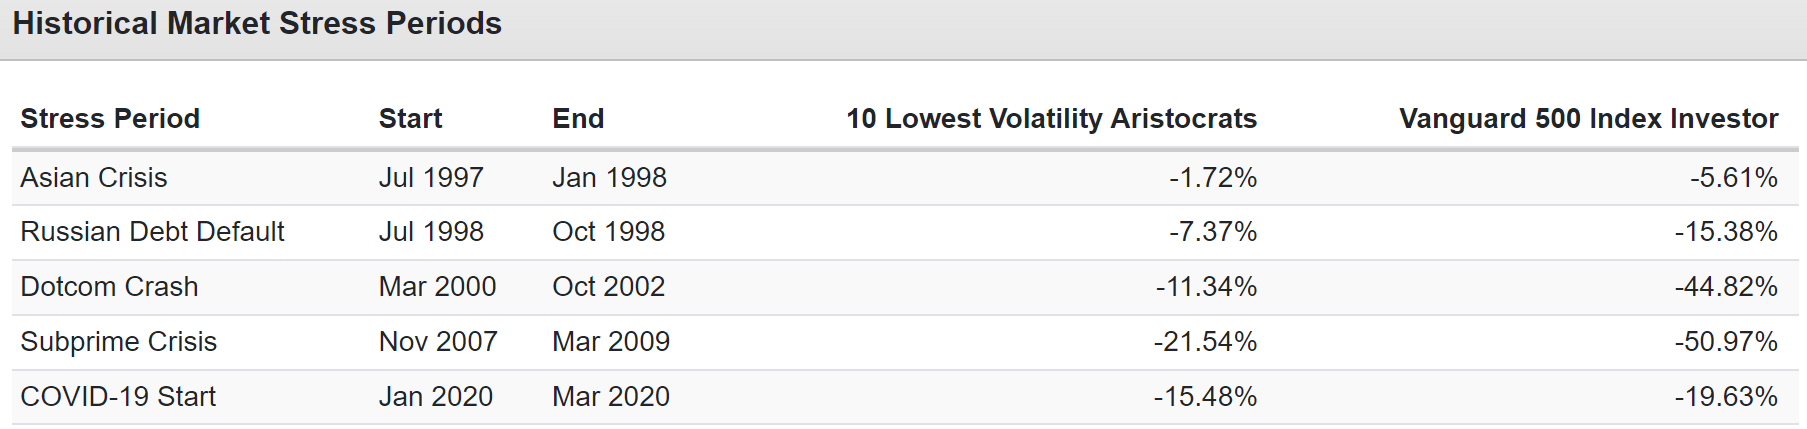
Portfolio Visualizer Premium
Significantly lower volatility in every major market downturn of the last 30 years.
| Bear Market |
| 10 Lowest Volatility Aristocrats |
| 60/40 |
| S&P |
| 2022 Stagflation |
| -14% |
| -21% |
| -28% |
| Pandemic Crash |
| -15% |
| -13% |
| -34% |
| 2018 |
| -7% |
| -9% |
| -21% |
| 2011 |
| -1% |
| -16% |
| -22% |
| Great Recession |
| -22% |
| -44% |
| -58% |
| Tech Crash |
| -11% |
| -22% |
| -50% |
| July 1998 to October 1998 |
| -6% |
| -10% |
| -22% |
| Average |
| -11% |
| -19% |
| -32% |
| Median |
| -11% |
| -16% |
| -28% |
(Source: Portfolio Visualizer Premium)
An average 66% lower peak declines than the S&P during every bear market since 1996.
40% smaller declines than a 60/40.
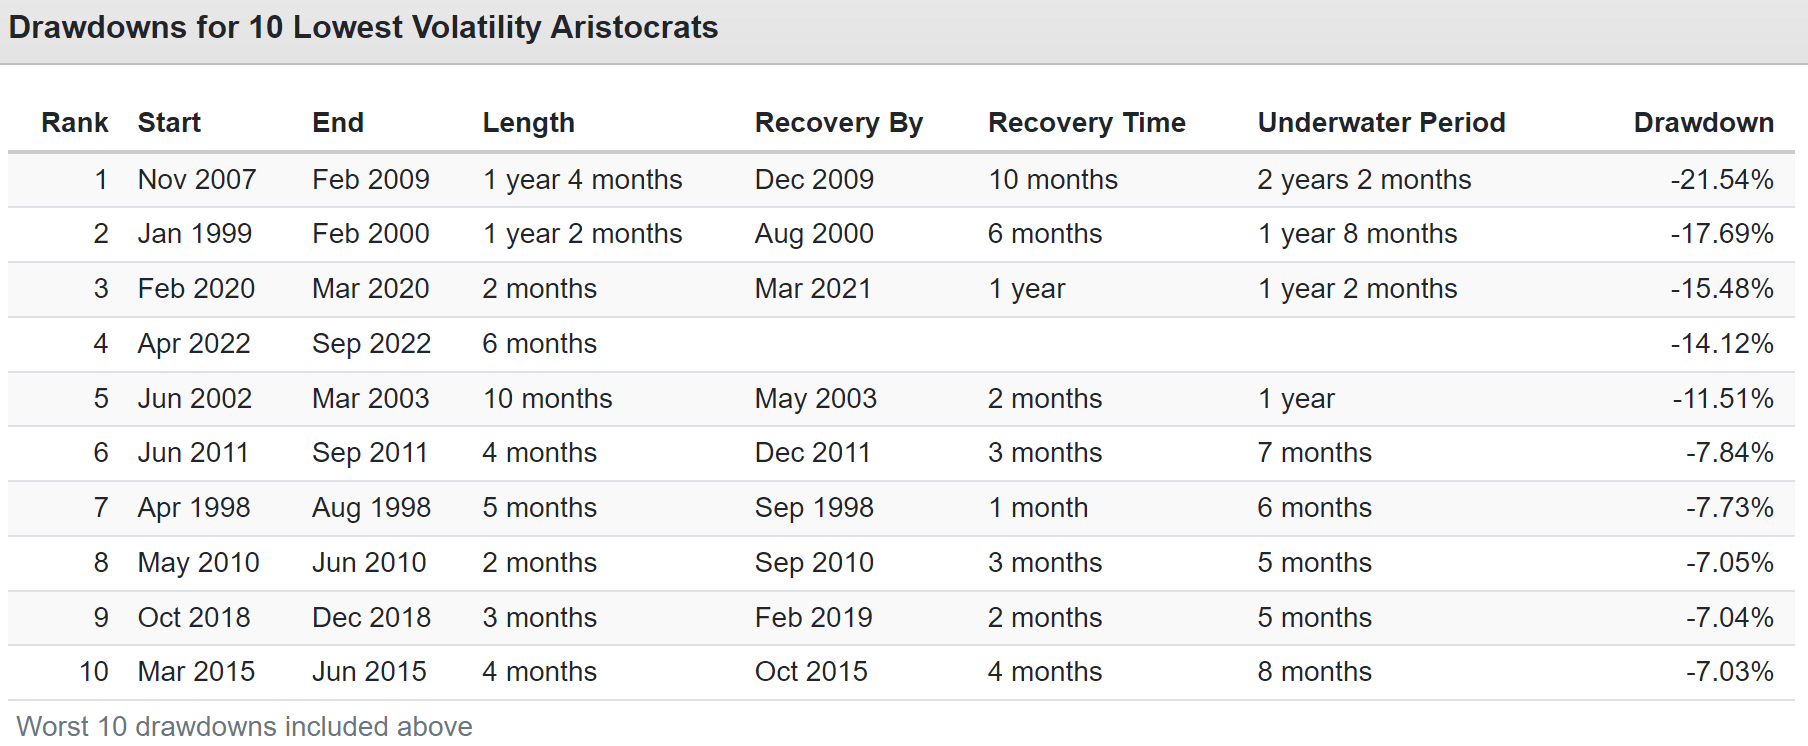
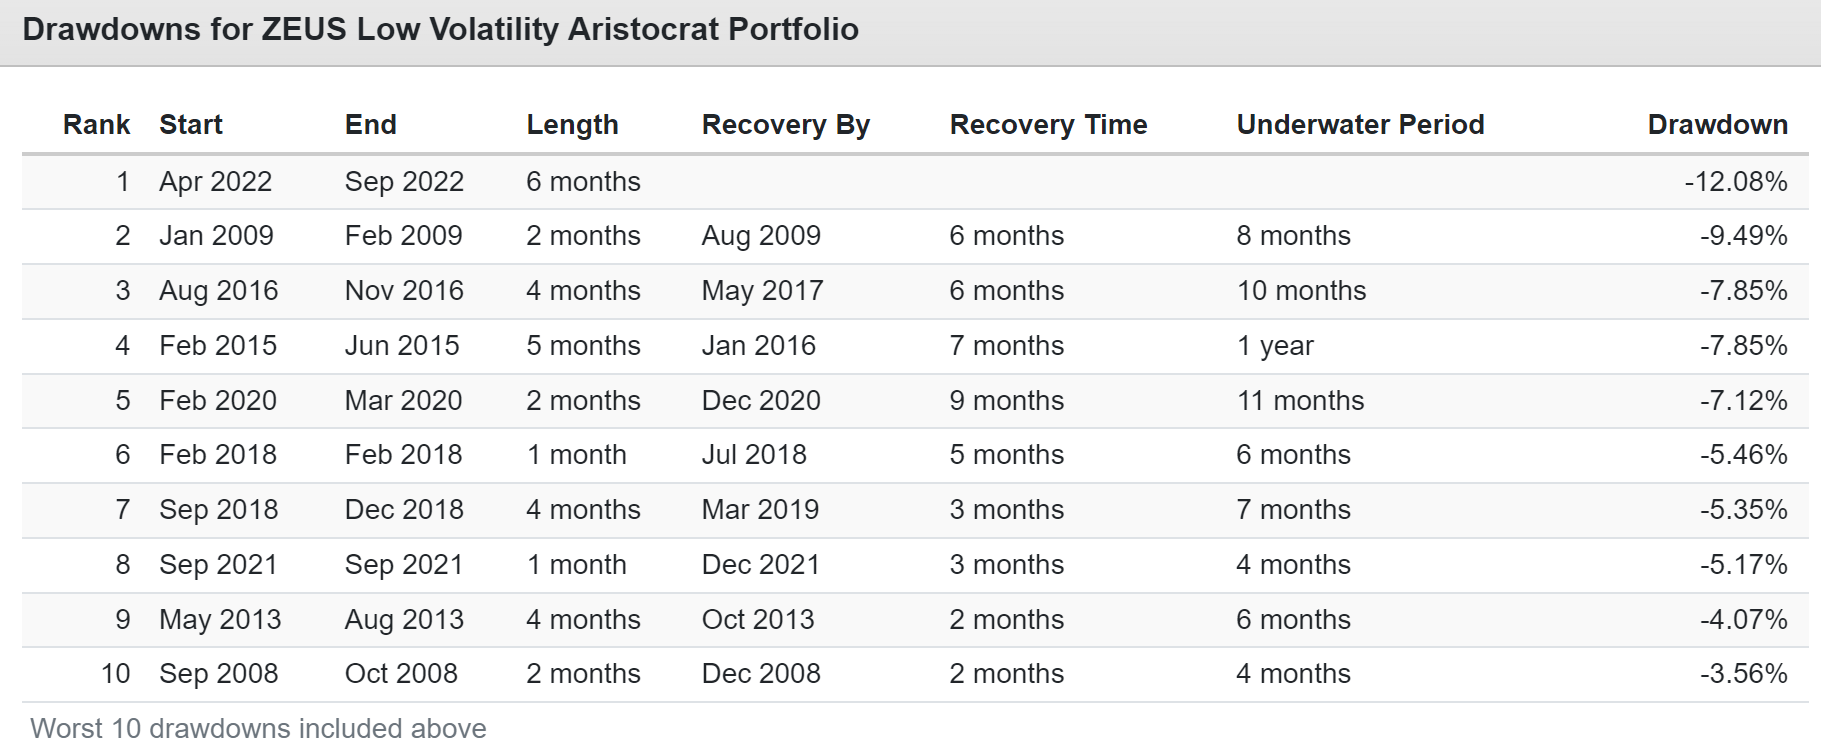
(Source: Portfolio Visualizer Premium)
The longest bear market lasted just over two years, while the S&P spent as long as 6.25 years before recovering from its worst bear market.
Income Growth-Rich Retirement Dreams Are Made Of
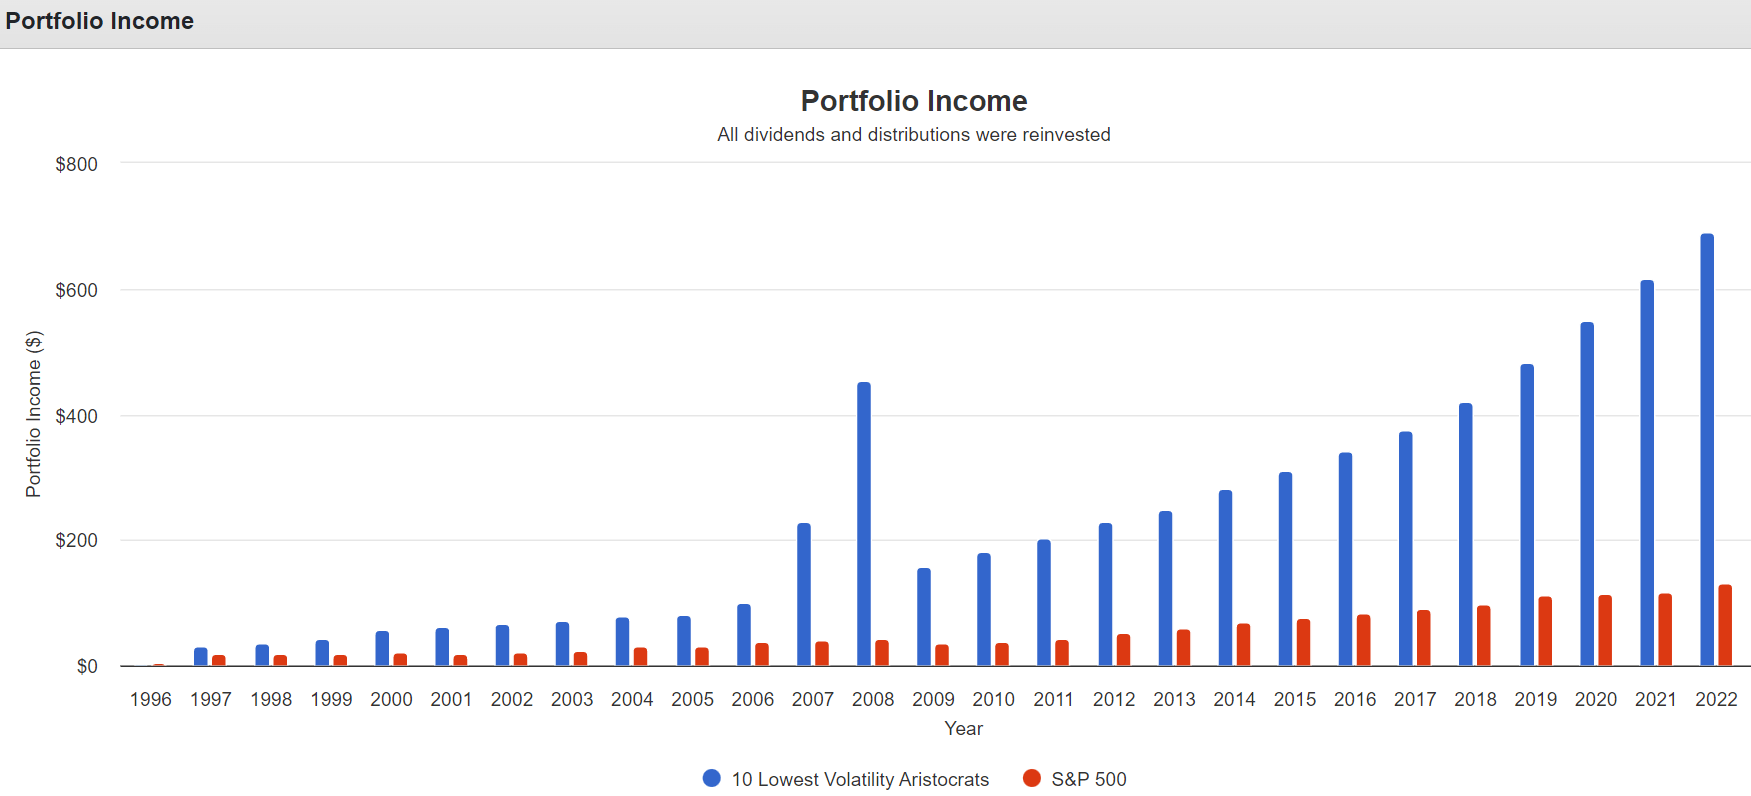
2007 and 2008 were 3 MO spinoffs ((Source: Portfolio Visualizer Premium))
Over the last 25 years:
- low volatility aristocrats: 3.1% yield to 69% yield on cost = 13.2% annual income growth
- S&P 1.8% yield to 13.1% yield on cost = 8.3% annual income growth
Better yield to start, superior income growth, rivers of dividends, and low volatility to ride out seven bear markets over the last 30 years.
How To Turn These Aristocrats Into A ZEUS Portfolio
What if even a 22% decline in the Great Recession is too much for you to stand emotionally?
Or what if you just want to boost the yield on this portfolio a bit more?
Then consider adding a 16.67% allocation to long-duration bonds like ( EDV ).
And a 16.67% allocation to managed futures like ( KMLM ).
Take a look at what this balanced Zen Extraordinary Ultra Sleep Well At Night or ZEUS low volatility aristocrat portfolio does.
- 16.66% EDV
- 16.66% KMLM
- 6.66% each of the 10 lowest volatility aristocrats
| Metric |
| 60/40 |
| ZEUS Low Volatility Aristocrat Portfolio |
| X Better Than 60/40 |
| Yield |
| 2.1% |
| 5.8% |
| 2.76 |
| Growth Consensus |
| 5.1% |
| 3.6% |
| 0.71 |
| LT Consensus Total Return Potential |
| 7.2% |
| 9.4% |
| 1.31 |
| Risk-Adjusted Expected Return |
| 5.0% |
| 6.6% |
| 1.31 |
| Safe Withdrawal Rate (Risk And Inflation-Adjusted Expected Returns) |
| 2.8% |
| 4.3% |
| 1.56 |
| Conservative Time To Double (Years) |
| 26.0 |
| 16.7 |
| 1.56 |
(Source: DK Research Terminal, FactSet)
Want to see what happens when you combine the lowest volatility aristocrats with the best hedging strategy of the last 53 years?
(Source: DK Research Terminal, FactSet)
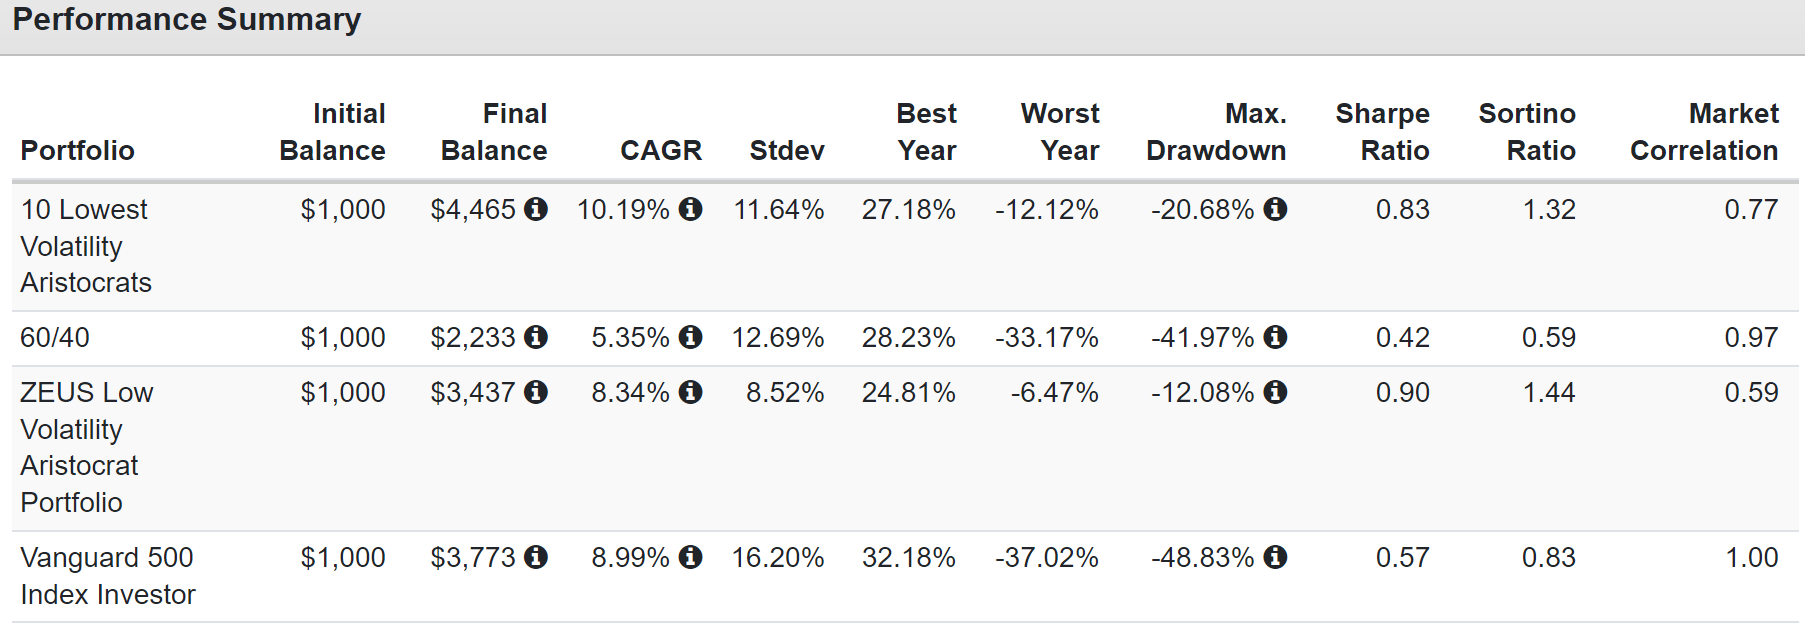
Almost matches the S&P but with less than 9% annual volatility and a peak decline of just 12%.
(Source: DK Research Terminal, FactSet)
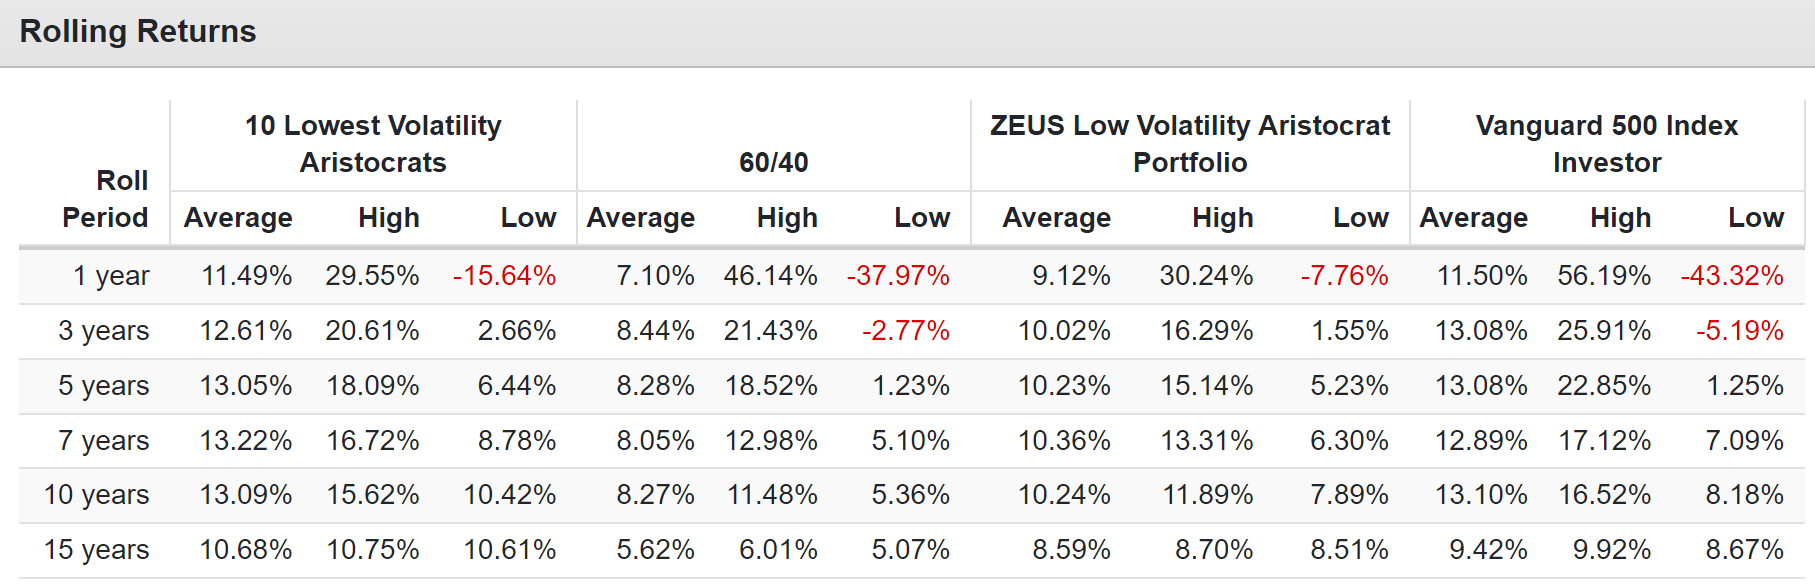
9.4% long-term consensus return forecast and 9.1% average annual rolling returns. And not a single three-year period of negative returns.
(Source: DK Research Terminal, FactSet)
That 12% peak decline wasn't in the Great Recession, it was in 2022 during the worst bond bear market in US history.
In the Great Recession, ZEUS low volatility aristocrats fell just 9.5%. Not even a correction during the second worst market crash in US history.
In fact, this portfolio hit a record high in November 2008.
And then fell 9.5% during the last two months of the Great Recession.
As Close To A Bear Market Proof Portfolio As Exists On Wall Street
| Bear Market |
| 10 Lowest Volatility Aristocrats |
| ZEUS Low Volatility Aristocrat |
| 60/40 |
| S&P |
| 2022 Stagflation |
| -14% |
| -12% |
| -21% |
| -28% |
| Pandemic Crash |
| -15% |
| -6% |
| -13% |
| -34% |
| 2018 |
| -7% |
| -5% |
| -9% |
| -21% |
| 2011 |
| -1% |
| 2% |
| -16% |
| -22% |
| Great Recession |
| -22% |
| 9% |
| -44% |
| -58% |
| Average |
| -12% |
| -2% |
| -21% |
| -31% |
| Average Peak Decline Vs. S&P 500 |
| -62% |
| -92% |
| -34% |
| NA |
| Median |
| -14% |
| -5% |
| -16% |
| -28% |
| Median Peak Decline Vs. S&P 500 |
| -50% |
| -82% |
| -43% |
| #DIV/0! |
(Source: Portfolio Visualizer Premium)
The average bear market decline since 2007 is -2%, and the median is -5%.
That's 92% smaller peak declines than the S&P and 43% smaller than the 60/40.
Stress Testing The Future With 75-Year Monte Carlo Simulation
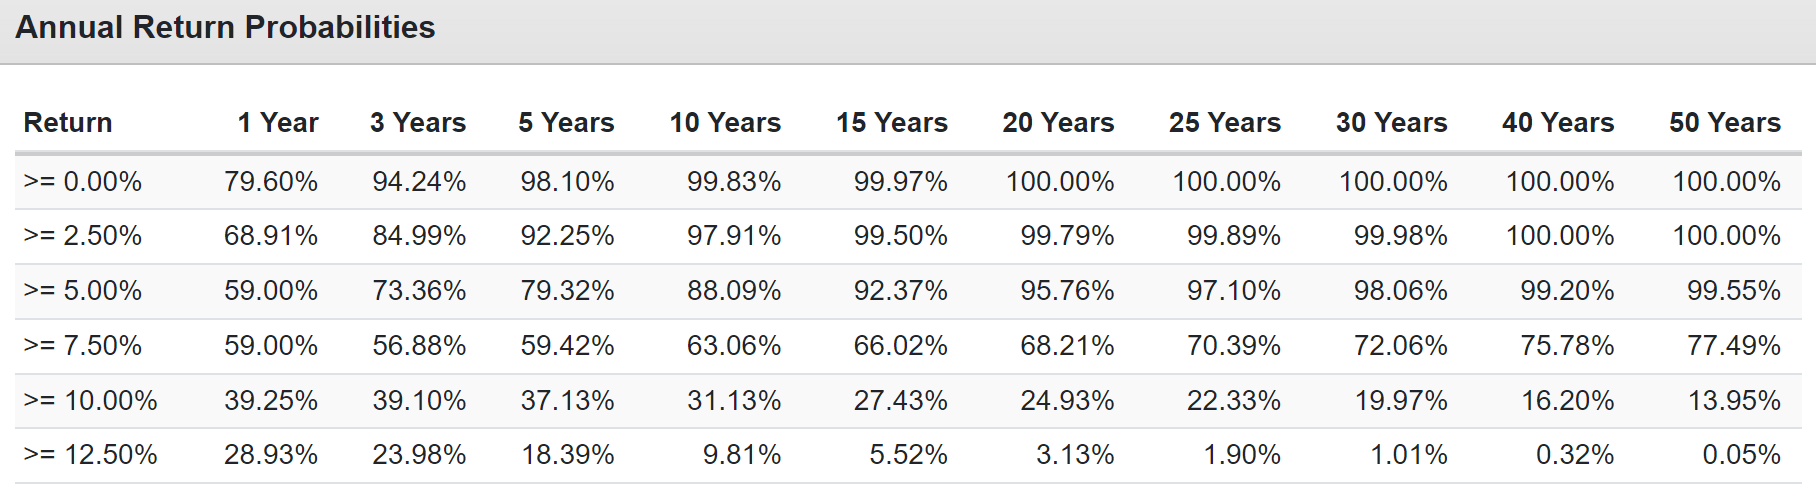
(Source: Portfolio Visualizer Premium)
If you define success as achieving 7.5% long-term returns, better than a 60/40's 7.2% historical return, this portfolio has a 77.49% chance of success over the next 50 years.
Bear Market Probabilities Over The Next 75 Years
How likely is a portfolio that falls 9.5% during the Great Recession to ever suffer a bear market?
| Bear Market Severity |
| Statistical Probability Over 75 Years |
| 1 In X Probability |
| Expected Every X Years |
| S&P More Likely To Suffer X% Decline In Any Given Year |
| 20+% |
| 0.28% |
| 357 |
| 26,786 |
| 4464 |
| 25+% |
| 0.03% |
| 3333 |
| 250,000 |
| 30+% |
| 0.00% |
| NA |
| NA |
| 35+% |
| 0.00% |
| NA |
| NA |
| 40+% |
| 0.00% |
| NA |
| NA |
| NA |
(Source: Portfolio Visualizer Premium)
You should expect this portfolio to suffer a 20+% bear market of approximately 0.28% or once every 26,786 years.
That's 4,464X less likely to fall 20+% in any given year than the S&P 500.
The probability of falling 25+% is 0.03%, or once every quarter million years.
This is as close to a bear market-proof portfolio as you can build in the real world.
The Ultimate Ultra Low Volatility High-Yield Hedge Fund (Since December 2007)
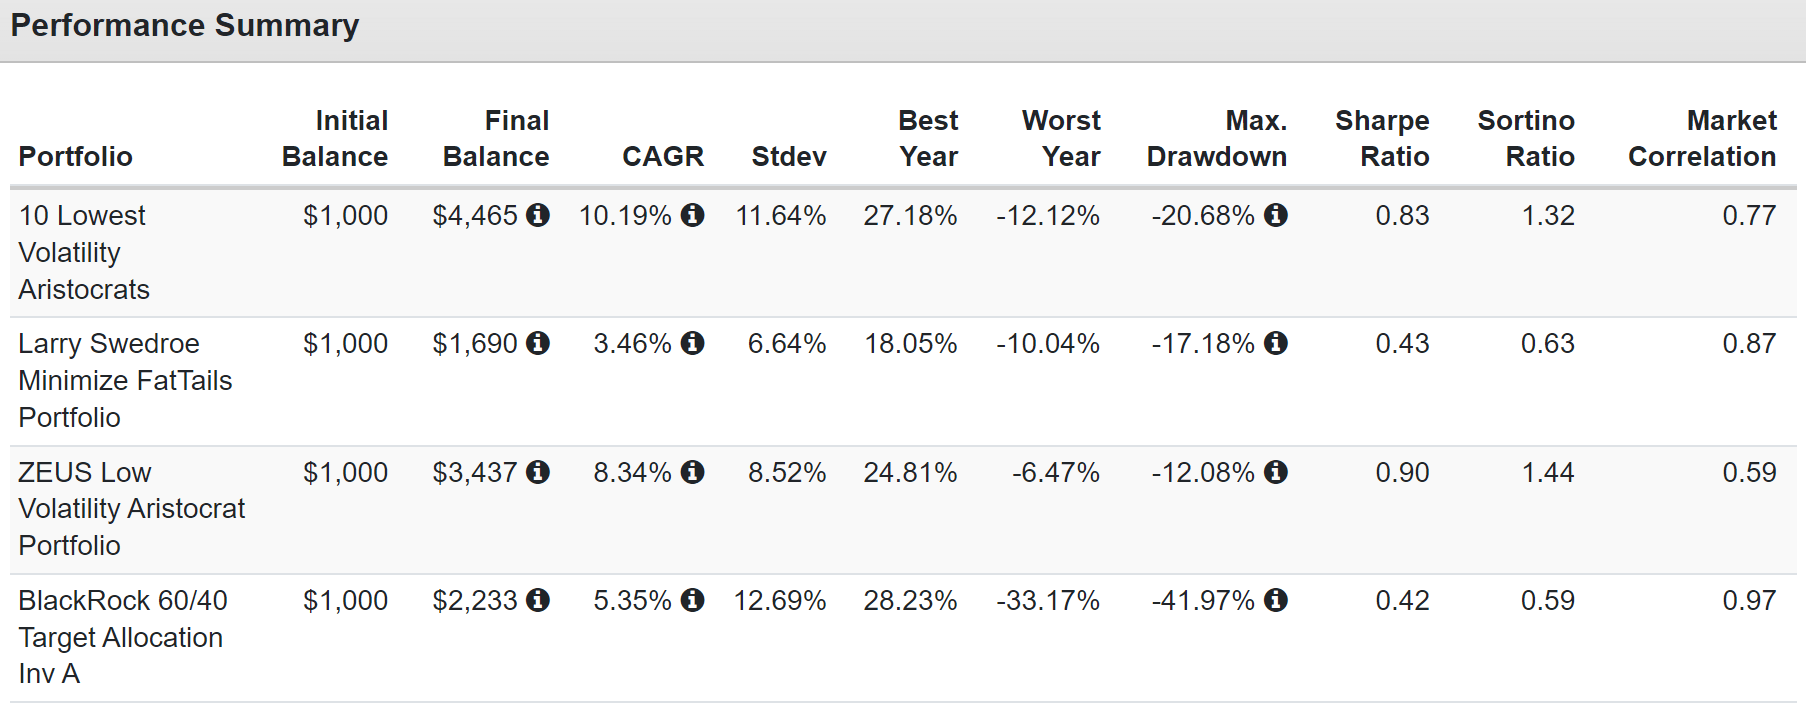
(Source: Portfolio Visualizer Premium)
Larry Swedroe is the CIO of Buckingham Strategic Wealth. This hedge fund manager designed an ultra-low volatility portfolio designed to minimize extreme events at all costs.
That includes only delivering 3.5% annual returns since 2007 but with 6.6% annual volatility, half that of a 60/40.
But ZEUS aristocrat runs circles around even Mr. Swedroe with negative-volatility-adjusted returns more than twice as high.
Why pay 5% average hedge fund fees when this portfolio costs 0.38% per year in expense ratios and is objectively far superior in every way?
Do you know what pension funds, endowments, sovereign wealth funds, and ultra-high net-worth family offices do to ensure they always have access to their funds in a bear market?
They pay hedge funds like Larry Swedroe's an average of 5% per year in fees to try to minimize volatility and maximize volatility-adjusted returns.
But with just ten ultra-low volatility aristocrats and two hedging ETFs, you can achieve far superior total returns, and much lower volatility for 1/12th the cost.
- Novartis
- Fortis
- Northwest Natural
- Arrow Financial
- NextEra Energy
- Altria
- Essential Utilities
- Automatic Data Processing
- Canadian National Railway
- Medtronic
Hedges:
- EDV: long duration US treasuries
- KMLM: managed futures
As Close To A Bear Market Proof Portfolio As Exists On Wall Street
| Bear Market |
| 10 Lowest Volatility Aristocrats |
| ZEUS Low Volatility Aristocrat |
| 60/40 |
| S&P |
| 2022 Stagflation |
| -14% |
| -12% |
| -21% |
| -28% |
| Pandemic Crash |
| -15% |
| -6% |
| -13% |
| -34% |
| 2018 |
| -7% |
| -5% |
| -9% |
| -21% |
| 2011 |
| -1% |
| 2% |
| -16% |
| -22% |
| Great Recession |
| -22% |
| 9% |
| -44% |
| -58% |
| Average |
| -12% |
| -2% |
| -21% |
| -31% |
| Average Peak Decline Vs. S&P 500 |
| -62% |
| -92% |
| -34% |
| NA |
| Median |
| -14% |
| -5% |
| -16% |
| -28% |
| Median Peak Decline Vs. S&P 500 |
| -50% |
| -82% |
| -43% |
| #DIV/0! |
(Source: Portfolio Visualizer Premium)
Worried about the debt ceiling? In 2011's debt ceiling crisis, this portfolio went up 2%.
Want to maximize your returns and earn an extra 1.5% per year? Then forget the hedges because these ten aristocrats are far lower volatility than a 60/40.
| Bear Market |
| 10 Lowest Volatility Aristocrats |
| 60/40 |
| S&P |
| 2022 Stagflation |
| -14% |
| -21% |
| -28% |
| Pandemic Crash |
| -15% |
| -13% |
| -34% |
| 2018 |
| -7% |
| -9% |
| -21% |
| 2011 |
| -1% |
| -16% |
| -22% |
| Great Recession |
| -22% |
| -44% |
| -58% |
| Tech Crash |
| -11% |
| -22% |
| -50% |
| July 1998 to October 1998 |
| -6% |
| -10% |
| -22% |
| Average |
| -11% |
| -19% |
| -32% |
| Median |
| -11% |
| -16% |
| -28% |
(Source: Portfolio Visualizer Premium)
This is the power of the world's best ultra-low volatility aristocrats.
Great yield, market-beating returns, and volatility so low it's like riding over the market's worst potholes in a Rolls Royce.
You can buy this to sleep well at night while enjoying life-changing income and wealth compounding no matter what happens with the debt ceiling, recession, inflation, interest rates, or geopolitics.
When you let the world's best companies work hard for you, one day, you won't have to.
And rather than praying for luck to retire in safety and splendor, you'll make your own luck.
For further details see:
10 Dividend Aristocrats For The Ultimate High-Yield SWAN Portfolio