DFEV - 2024 Year Ahead Outlook: iShares Investment Strategy
2023-12-06 12:15:00 ET
Summary
- We are likely at the end of the Fed’s hiking cycle, but don’t anticipate rate cuts until the second half of 2024. The shape of the yield curve and the trajectory of growth will be key drivers of returns.
- Investors piled into cash in 2023. Staying there risks missing the returns in stocks and bonds during the ‘pause period’ between the last hike and the first cut.
- 2024 will be a year to pick your spots. We see opportunities to deploy cash selectively across asset classes.
- In fixed income, we prefer pairing intermediate duration core holdings with differentiated income seeking exposures.
- In equities, we favor adding downside protection in core exposures while taking targeted risk in loveable laggards.
By Gargi Pal Chaudhuri
While conventional wisdom suggests that a rate cut boosts performance, historical data shows investors could actually be rewarded the most in a pause period, before easing begins. - Gargi Pal Chaudhuri, Head of iShares Investment Strategy, Americas at BlackRock
MACRO
We believe the Fed is likely done hiking, though the market overestimates the speed and scope of Fed easing in 2024.
We don’t see a rate cut until the second half of 2024 as inflation remains well above the Fed’s target of 2%. For investors, the focus will shift from “how high?” to “how long?” policy rates can remain tight. In our view, the pace of policy easing, the shape of the yield curve, and the trajectory of economic growth will be the key drivers of portfolio returns.
Figure 1: Investors have stockpiled cash in the face of macro uncertainty
Source: EPFR, Bloomberg. As of November 22, 2023.
In 2024, sitting in cash risks missing out on bond and equity market returns.
In the previous five hiking cycles since 1990, the Fed paused an average of 10 months between its last hike and its first cut. 1 On average, stock and bond returns have been higher during the pause period than in easing periods immediately following the first cut (Figure 2).
In 2023, global investors added a record $1.1tn to their cash holdings, the highest allocation since the pandemic. 2 While an overweight cash position made sense for some investors during rapidly rising rates, it is harder to justify now that the Fed has reached its likely terminal rate. Many investors appear to be waiting on the sidelines for more clarity around the path of policy rates; we caution that doing so now risks missing potential upside in other asset classes.
Figure 2: Pauses have paid off, even more than easing periods
| Source: Bloomberg, as of November 16, 2023. Total return analysis produced by iShares Investment Strategy. Historical analysis calculates average performance of the S&P 500 index (equities), the Bloomberg U.S. Aggregate Bond Index (bonds), and the Bloomberg U.S. Treasury Bills: 1-3 Months TR Index ('cash') in the 6 months leading up to the last Fed rate hike, between the last rate hike and first cut, and the 6 months after the first cut. The dates used for the last rate hike of a cycle are: 2/1/1995, 3/25/1997, 5/16/2000, 6/29/2006, 12/19/2018. Dates used for the first-rate cut are: 7/6/1995, 9/29/1998, 1/3/2001, 9/18/2007, 8/1/2019. Index performance is for illustrative purposes only. Index performance does not reflect any management fees, transaction costs or expenses. Indexes are unmanaged and one cannot invest directly in an index. Past performance does not guarantee future results. |
Cash was king in 2023 but changes in the shape of the yield curve signal the end of its reign.
Over the past 2 years, the 10-year term premium has been negative most of the time. In other words, investors in 10-year notes have been paying to take the risk of uncertainty around the expected path of short rates instead of getting paid to do so. A negative term premium, combined with a steeply inverted yield curve, meant that cash and short maturities outperformed for most of 2023. Normalization in both has changed the incentive structure, and the shape of the yield curve is now signaling that it’s time to consider allocating out of cash.
Figure 3: Changes in the yield curve make cash less appealing
| Source: Bloomberg, as of November 21, 2023. 2Y/10Y yield curve slope as represented by USYC2Y10 Index. 0Y term premium as represented by ACMTP10 Index. |
For equity allocations, managing macro risks in a slowing growth backdrop will be key. While we are not calling for a recession, a downshift from above-trend growth could present challenges for segments of the equity markets. We see three key risks to consumers — and, by extension, earnings (see table below). In a shifting macro environment, remaining invested can be paramount, but adding downside resiliency to core equity holdings could make sense for many investors.
Figure 4: Risks to the consumer outlook
| Table depicting outlooks in three potential macro risks to consumers: disposable income, borrowing, and savings | |
|---|---|
| Growth factor | Outlook |
| Disposable income | |
| |
| Borrowing | |
| |
| Savings | |
|
But where there are losers, there are also winners. We think reducing risk in core equity holdings allows investors to steer portfolio outcomes toward potential opportunities on the margin by deploying cash selectively within styles, industries, and geographies.
Geopolitical risks, election cycles, a worsening U.S. fiscal backdrop, and shifting central bank narratives may result in rapidly shifting equity leadership and require more frequent portfolio adjustments in 2024. ETFs can be a useful tool to efficiently adjust to rapidly changing realities.
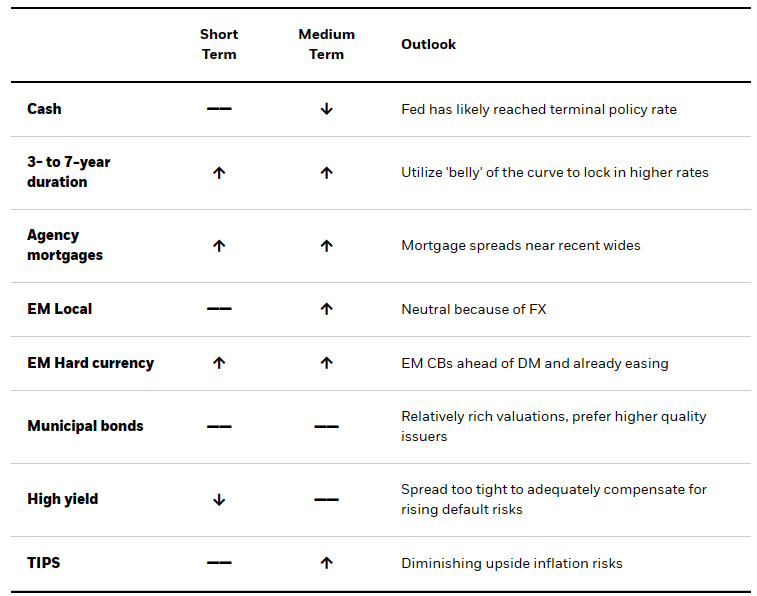
FIXED INCOME
iShares Investment Strategy views: fixed income
2024 will be a year to pick your spots in fixed income.
We see opportunities to do so along the yield curve, within spread products, and outside of the U.S.
Cash cannot benefit from falling rates like bonds can. With inflation continuing to normalize, we believe the Fed’s next move is likely a cut. In a regime of declining interest rates, current bond yields would no longer be viewed as the best expectation of total returns, but instead something closer to a floor. As rates fall, bond prices rise and provide investors with returns from price appreciation in addition to interest income. However, to capture the potential upside of price appreciation, investors would need to own duration, which is a measure of a bond’s sensitivity to changes in interest rates. As the duration of cash is close to zero, it cannot participate in such a rally.
1. We think it is time to extend in duration, but do not yet think the risk-reward justifies a move to the long-end of the curve.
We believe the intermediate portion of the yield curve represents the ‘sweet spot’, optimizing potential price appreciation, liquidity, and current yield. In our view, rates at the long end of the yield curve are not yet attractive at current levels. Before taking a significant exposure to the long end, we would prefer to see the yield curve return to a more normal shape, with an upward-sloping term structure and a positive term premium more consistent with levels before the Global Financial Crisis.
Figure 5: What we believe will drive the shape of the yield curve
| Source: BlackRock, Treasury Borrowing Advisory Committee (TBAC). Figure by iShares Investment Strategy. Factors determined by iShares Investment Strategy. Factors listed not comprehensive. Supply as represented by TBAC Financing Schedule for Q1 2024. As of November 27, 2023. Yield curve depiction is for illustrative purposes only. |
2. Real estate is a ‘loveable laggard’ that was buffeted by rising rates but may present opportunities as rates stabilize.
Since fixed-rate mortgages have an embedded prepay option, spreads in mortgage-backed securities ('MBS') have been correlated with implied rate volatility. Our expectation is that fixed income volatility will decline in 2024 as the Fed signals it will hold policy rates steady for the first half of the year. We expect that MBS spreads may narrow as implied volatility normalizes.
Figure 6: Moderating rate volatility could mean tighter MBS spreads
| Source: Bloomberg. MOVE Index as represented by MOVE Implied Rates Volatility Index, MBS spread as represented by MOASFNCL Index. As of November 21, 2023. Indexes are unmanaged and one cannot invest directly in an index. Past performance does not guarantee future results. |
Agency residential mortgage-backed securities offer an opportunity to supplement core bond allocations with a diversified income stream that can help reduce credit risk. Even after rallying throughout November, current coupon 30-year Fannie Mae mortgage-backed securities are yielding 50 basis points more than U.S. Treasuries on an option adjusted basis, above their 10-year average spread of 31 basis points. 10 We believe that exposure to mortgage-backed securities has the potential to outperform broad-based fixed income indices in 2024 as fixed income implied volatility normalizes alongside greater clarity on the path of policy rates.
3. Emerging market ('EM') debt is inexpensive as EM monetary policy has been more proactive than in developed markets ('DM').
For example, the Brazilian central bank started hiking rates a year before the Fed and is already in the easing stage of its monetary policy cycle. This monetary policy easing can help support the performance of high coupon EM bonds, particularly as U.S. and other DM rates are set to remain on hold in the first half of 2024. Importantly, this EM easing is occurring without a decline in forecasted growth. The IMF forecasts emerging market GDP growth of 4% in 2024, the same as last year. 11 Given widening rate differentials, we now prefer hard currency bonds over local currency.
Figure 7: Brazil vs. U.S. policy rates
| Source: Bloomberg. Brazil rates as represented by BZSTSETA Index, U.S. rates as represented by FDTR Index. As of November 23, 2023. Indexes are unmanaged and one cannot invest directly in an index. Past performance does not guarantee future results. |
A selective and active approach may be helpful as investors extend from cash and seek diversified income opportunities. Many investors lack the expertise to assess opportunities in more exotic classes and may benefit from a more curated approach. The BlackRock Flexible Income ETF ( BINC )allows investors to let an experienced manager ‘pick their spots’ for them via an active ETF that flexibly invests across EM, High Yield, Securitized and non-U.S. credit.
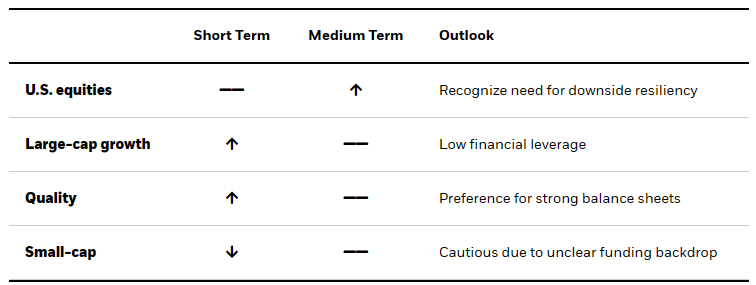
EQUITIES
iShares Investment Strategy views: U.S. equities
Figure 8: 1-year implied S&P 500 correlation
| Source: Bloomberg. Implied correlation as represented by CBOE 1Y Implied Correlation Index. As of November 27, 2023. |
Our expectations are for positive, but slowing, economic growth in 2024.
We believe that can translate to modestly positive equity index returns — albeit with significant event risk over the course of the year, and with significant differentiation under the hood.
2024 holds a variety of macro crosscurrents that can cut in different directions: receding inflation, the path of interest rates, domestic elections, and mounting geopolitical tensions. That points to a choppy path forward for equity markets and the potential for leadership to change frequently.
We therefore believe investors would be well-served to be in risk-management mode in broad U.S. equity exposures, enabling them to take deliberate risk where, and when, opportunities arise.
Investors can strive to reduce market risk in their core equity allocations by either introducing equity guardrails in the form of buffered ETFs, or by moving up in quality across sectors. Incorporating a sector-neutral quality factor approach can help investors focus on companies with strong balance sheets. But for those looking for a more defined outcome in core holdings, buffered ETFs limit some upside potential while providing a targeted level of downside protection.
Figure 9: Downside protection with buffered strategies
| Dotted grey line represents the price return of the reference asset. Solid black line represents the downside protection the fund seeks to provide on losses in the reference asset. A moderate buffer in this hypothetical scenario seeks to mitigate losses from 0-5%. The 6% cap is based on historical analysis of approximately where the cap would be set to offset the cost of the downside buffer range and is not indicative of what investors may experience. Actual caps may vary. Buffer and cap price levels are typically reset on a quarterly basis. For illustrative purposes only. |
Reducing risk in the core of a portfolio can allow investors to lean into upside opportunities, both now and as macro conditions evolve over the course of the year.
For now, we believe large-cap growth can continue to power the market.
Large-cap growth names screen strongly on low financial leverage — a well-rewarded theme in 2023’s market rally — while boasting margin resilience and stable earnings. 12 Despite the rapid pace of the Fed’s historic rate-hiking campaign, we don’t expect policy rates to be as quickly unwound. This delivers a backdrop that can continue to reward low leverage.
On the horizon, there are multiple catalysts that could cause equity leadership — and our preferred exposures — to change over the course of the year.
- A steeper yield curve and the potential for modest Fed easing in H2 2024 creates a favorable macro backdrop for large-cap financial services. A normalizing yield curve could boost net interest margins while a rally in rates may drive trading revenues at large broker-dealers and exchanges. Although regional banks earnings are slated to contract next year, consensus 12-month forward earnings for the financial sector are expected to rise 6.2% in 2024, driven in large part by financial services and insurance sub-sectors. 13
- In another scenario, a dovish Federal Reserve surprising markets with rate cuts earlier than expected could spur a cyclically driven rally.
- Under those circumstances, we could see small-caps, which currently sit at cheap valuations and underweight allocations, outperform the broader market. 14
- A comeback in ‘loveable laggards’ could also play out in sector performance. Healthcare sector ETF outflows totaled $8.7bn this year, the sharpest unwind since pre-GFC. 15 Under-owned and potentially poised for an earnings upswing, healthcare exposures, especially medical devices and pharmaceuticals, could reap rewards in a catch-up trade.
THEMATICS
Investors looking to the future can lean into select structural trends that may help diversify returns relative to cash and other assets. With the rapid adoption of ChatGPT’s generative AI and GLP-1 weight-loss drugs, 2023 has given investors no lack of evidence on how long-term trends with near-term catalysts have the potential to generate differentiated outperformance. Stepping into 2024, investors may want to continue to assess the potential impacts of AI and medical innovations, while also paying close attention to other trends such as the rewiring of globalization and future of financing. (See the 2024 Thematic Outlook for more detail.)
The success of OpenAI accelerated global understanding and adoption of generative AI, but we are still in early days. In the coming years, we could see tremendous amount of growth in product integration and enterprise level implementations , driven by an expansion of use cases and cost saving potentials.
Semiconductor companies take center stage at every step of AI adoption, from chip design to increased production and sales. In 2023, growing demand triggered an earlier cyclical recovery in the semiconductor industry. The ongoing support for domestic semiconductor research and manufacturing from the $52bn CHIPS Act in the U.S. could lead to a geographical realignment of manufacturing capacity. 16 While semiconductor valuation remains elevated, we believe the medium and long-term growth trajectory justifies an increased allocation, especially when entry level valuations become attractive.
Figure 10: Semiconductor production picked up from the cycle bottom
| Source: Industrial Production: Manufacturing: Durable Goods: Semiconductor and Other Electronic Component, FRED, Federal Reserve Bank of St. Louis. Grey areas represent U.S. recession as defined by National Bureau of Economic Research. As of November 21, 2023. |
While some mega forces take longer to manifest, we see investors starting to modify strategic allocations to capture upcoming investing trends, particularly in international markets. Rising geopolitical fragmentation means investors may need to take a more granular approach in international investing, we expect this to continue in 2024 and see opportunities in the following:
1. Over the past few years, investors have increasingly taken a modular approach in emerging markets, separating China from the broader region as China grew to be more than a third of the EM index.
This trend accelerated into 2023, as the structural slowdown in Chinese economy and on-going geopolitical tensions with the U.S. weighed on investor sentiment. Since the beginning of this year, global investors have added $4.3bn into emerging market ex-China focused ETFs, 17 as many expect the headwinds to persist.
2. Japan’s recent exit out of three decades of deflation amid the Bank of Japan’s looser monetary relative to other developed markets has sparked investor interest.
While the end of yield curve control and return of positive interest rates may cause volatility, renewed inflation and wage growth is promising for the Japanese market. Outside of the BOJ incentivizing investing, the Tokyo’s Stock Exchange corporate reforms aim to create shareholder-friendly corporate behavior for both domestic and international investors. Beginning January 2024, new tax-free measures may boost flows into risk assets, putting to work some of the $7tn of household savings currently being held in cash. 18 While Japanese equities are more expensive than last year, valuations are lower than they've been for 66% of their history, despite the large rally in 2023. 19
Figure 11: Despite strong performance this year, Japan’s valuations remain attractive
| Source: BlackRock Investment Institute, with Data from Refinitiv Datastream, as of October 31, 2023. Japanese equities represented by the MSCI Japan Index. Valuations an average of percentile ranks versus available history of earnings yield, cyclically adjusted earnings yield, trend real earnings, dividend yield, price to book, price to cash flow, and forward 12-month earnings yield. Historical range begins in 1986. |
3. In India, globalization and demographics trends go hand in hand.
India may be a beneficiary of trade rewiring to “friendlier” countries where costs are lower than developed markets. As the world’s fifth-largest economy, India is focused on expanding and taking on a larger role in global supply chains. As India became the most populous country in 2023 with a labor force participation rate of only 32.5%, we expect millions of people to join the formal labor force as the economy expands, solidifying the Indian consumer and contributing further to economic growth. 20
FOOTNOTES
1 Source: BlackRock, Bloomberg. As of November 22, 2023. The previous five hiking cycles in reference the dates of the last hike since 1990: 2/1/1995, 3/25/1997, 5/16/2000, 6/29/2006, 12/19/2018.
2 Source: EPFR, Bloomberg. Highest allocation as represented by weekly notional value of money market fund assets. As of November 22, 2023.
3 Source: Bloomberg, Bureau of Labor Statistics. Current cycle represented as period between June 2020 and November 2023. As of November 21, 2023.
4 Source: Bloomberg, Bureau of Economic Analysis. Metric calculated as change in real disposable income from 6 months prior, annualized. As of November 21, 2023.
5 Source: Bloomberg, Federal Reserve. Metric calculated as change in total consumer credit from 6 months prior, averaged. As of November 21, 2023.
6 Source: Bloomberg, Federal Reserve Bank of New York. As of November 21, 2023.
7 Source: Bloomberg. As of November 21, 2023.
8 Source: Bloomberg, Bureau of Economic Analysis. As of November 21, 2023.
9 Source: Bloomberg, Federal Reserve Bank of San Francisco . As of August 16, 2023.
10 Source: Bloomberg. As of November 27, 2023. A basis point is one hundredth of one percentage point.
11 Source: Bloomberg, IMF. As of November 20, 2023.
12 Source: BlackRock, Bloomberg. Low financial leverage exposures as represented by M2USSNQ Index, ‘well-rewarded theme’ as represented by total return outperformance relative to the broader market, SPX Index. As of November 28, 2023.
13 Source: BlackRock, Refinitiv Datastream. As of November 29, 2023.
14 Source: Bloomberg, Markit. Small-caps as represented by RTY Index, ‘cheap valuations’ as represented by P/E ratio relative to historic averages. ‘Underweight allocations’ as represented by ETF flows year-to-date relative to historical averages. ETF groupings determined by Markit. As of November 28, 2023.
15 Source: BlackRock, Markit. ETF groupings determined by Markit. As of November 23, 2023.
16 Source: CHIPS and Science Act of 2022 . As of November 20, 2023.
17 Source: BlackRock, Markit. ETF groupings determined by Markit. As of November 27, 2023.
18 Source: Bank of Japan Research of Statistics Department, as of September 20, 2023.
19 Source: BlackRock Investment Institute, with Data from Refinitiv Datastream, as of October 31, 2023. Japanese equities represented by the MSCI Japan Index. Valuations an average of percentile ranks versus available history of earnings yield, cyclically adjusted earnings yield, trend real earnings, dividend yield, price to book, price to cash flow, and forward 12-month earnings yield. Historical range begins in 1986.
20 Source: Bloomberg, as of November 21, 2023.
© 2023 BlackRock, Inc. All rights reserved.
Carefully consider the Funds' investment objectives, risk factors, and charges and expenses before investing. This and other information can be found in the Funds' prospectuses or, if available, the summary prospectuses, which may be obtained by visiting the iShares Fund and BlackRock Fund prospectus pages. Read the prospectus carefully before investing.
Investing involves risk, including possible loss of principal.
International investing involves risks, including risks related to foreign currency, limited liquidity, less government regulation and the possibility of substantial volatility due to adverse political, economic or other developments. These risks often are heightened for investments in emerging/ developing markets or in concentrations of single countries.
There can be no assurance that performance will be enhanced or risk will be reduced for funds that seek to provide exposure to certain quantitative investment characteristics ("factors"). Exposure to such investment factors may detract from performance in some market environments, perhaps for extended periods. In such circumstances, a fund may seek to maintain exposure to the targeted investment factors and not adjust to target different factors, which could result in losses.
There can be no guarantee that the Fund will be successful in its strategy to provide downside protection against Underlying ETF losses. The Fund does not provide principal protection or non-principal protection, and, despite the Approximate Buffer (the “Buffer”), an investor may experience significant losses on their investment, including the loss of their entire investment. A blended portfolio of Expiring Options and New Options during a Rebalance Period will impact the Fund’s ability to realize the full benefit of the Buffer or may subject the Fund’s return to an upside limit that is slightly lower or higher than the Approximate Cap (the “Cap") for the applicable Hedge Period. Accordingly, investors may bear losses against which the Buffer is anticipated to protect and be subject to an upside limit that is lower than the Cap. In the event an investor purchases Fund shares after a Hedge Period begins or sells Fund shares prior to the end of the Hedge Period, the returns realized by the investor will not match those that the Fund seeks to provide. In periods of extreme market volatility, the Fund’s return may be subject to downside protection significantly lower than the Buffer and an upside limit significantly below the Cap. A new cap is established during each Rebalance Period and is dependent upon current market conditions. As such, the Cap is likely to change, sometimes significantly, from one Hedge Period to the next.
The Fund invests in FLEX Options that derive their value from the Underlying ETF. FLEX Options are subject to counterparty risk, which is the risk that the other party in the transaction will not fulfill its contractual obligation, and may be less liquid than other securities. The value of FLEX Options may be affected by interest rate changes, dividends, actual and implied volatility levels of the Underlying ETF’s share price, and the remaining time until the FLEX Options expire. Because of these factors, the Fund’s NAV may not increase or decrease at the same rate as the underlying ETF’s share price.
Diversification and asset allocation may not protect against market risk or loss of principal.
Specific companies or issuers are mentioned for educational purposes only and should not be deemed as a recommendation to buy or sell any securities. Any companies mentioned do not necessarily represent current or future holdings of any BlackRock products. For actual fund holdings, please visit the respective fund product pages.
Fixed income risks include interest-rate and credit risk. Typically, when interest rates rise, there is a corresponding decline in the value of debt securities. Credit risk refers to the possibility that the debt issuer will not be able to make principal and interest payments.
Non-investment-grade debt securities (high-yield/junk bonds) may be subject to greater market fluctuations, risk of default or loss of income and principal than higher-rated securities.
An investment in the Fund is not insured or guaranteed by the Federal Deposit Insurance Corporation or any other government agency and its return and yield will fluctuate with market conditions.
TIPS can provide investors a hedge against inflation, as the inflation adjustment feature helps preserve the purchasing power of the investment. Because of this inflation adjustment feature, inflation protected bonds typically have lower yields than conventional fixed rate bonds and will likely decline in price during periods of deflation, which could result in losses. Government backing applies only to government issued securities, and does not apply to the funds.
An investment in fixed income funds is not equivalent to and involves risks not associated with an investment in cash.
Funds that concentrate investments in specific industries, sectors, markets or asset classes may underperform or be more volatile than other industries, sectors, markets or asset classes and than the general securities market.
Commodities' prices may be highly volatile. Prices may be affected by various economic, financial, social and political factors, which may be unpredictable and may have a significant impact on the prices of commodities.
There is no guarantee that dividends will be paid.
There can be no assurance that an active trading market for shares of an ETF will develop or be maintained.
This material represents an assessment of the market environment as of the date indicated; is subject to change; and is not intended to be a forecast of future events or a guarantee of future results. This information should not be relied upon by the reader as research or investment advice regarding the funds or any issuer or security in particular.
The strategies discussed are strictly for illustrative and educational purposes and are not a recommendation, offer or solicitation to buy or sell any securities or to adopt any investment strategy. There is no guarantee that any strategies discussed will be effective.
The information presented does not take into consideration commissions, tax implications, or other transactions costs, which may significantly affect the economic consequences of a given strategy or investment decision.
This material contains general information only and does not take into account an individual's financial circumstances. This information should not be relied upon as a primary basis for an investment decision. Rather, an assessment should be made as to whether the information is appropriate in individual circumstances and consideration should be given to talking to a financial professional before making an investment decision.
The information provided is not intended to be tax advice. Investors should be urged to consult their tax professionals or financial professionals for more information regarding their specific tax situations.
The Funds are distributed by BlackRock Investments, LLC (together with its affiliates, "BlackRock").
The iShares Funds are not sponsored, endorsed, issued, sold or promoted by Bloomberg, BlackRock Index Services, LLC, Cboe Global Indices, LLC, Cohen & Steers, European Public Real Estate Association (“EPRA® ”), FTSE International Limited (“FTSE”), ICE Data Indices, LLC, NSE Indices Ltd, JPMorgan, JPX Group, London Stock Exchange Group (“LSEG”), MSCI Inc., Markit Indices Limited, Morningstar, Inc., Nasdaq, Inc., National Association of Real Estate Investment Trusts (“NAREIT”), Nikkei, Inc., Russell, S&P Dow Jones Indices LLC or STOXX Ltd. None of these companies make any representation regarding the advisability of investing in the Funds. With the exception of BlackRock Index Services, LLC, who is an affiliate, BlackRock Investments, LLC is not affiliated with the companies listed above.
Neither FTSE, LSEG, nor NAREIT makes any warranty regarding the FTSE Nareit Equity REITS Index, FTSE Nareit All Residential Capped Index or FTSE Nareit All Mortgage Capped Index. Neither FTSE, EPRA, LSEG, nor NAREIT makes any warranty regarding the FTSE EPRA Nareit Developed ex-U.S. Index, FTSE EPRA Nareit Developed Green Target Index or FTSE EPRA Nareit Global REITs Index. “FTSE®” is a trademark of London Stock Exchange Group companies and is used by FTSE under license.
©2023 BlackRock, Inc or its affiliates. All Rights Reserved. BLACKROCK, iSHARES, iBONDS, LIFEPATH, ALADDIN and the iShares Core Graphic are trademarks of BlackRock, Inc. or its affiliates. All other trademarks are those of their respective owners.
iCRMH1223U/S-3257588
This post originally appeared on the iShares Market Insights.
Editor's Note: The summary bullets for this article were chosen by Seeking Alpha editors.
For further details see:
2024 Year Ahead Outlook: iShares Investment Strategy