ACTV - 4 Charts That Matter Today
2023-06-28 20:28:52 ET
Summary
- We love the power of charts.
- Here are four charts that are important for investors today.
- We examine market breadth, liquidity, jobless claims, and GDI vs GDP.
"A picture is worth a thousand words, but a chart is worth a thousand pictures."
This is our original motto. As visual learners, we value the power that charts wield for data analysis and interpretation. There is not a single investment decision that we make without the use of charts.
Today, we're sharing four important charts that matter today and provide a little context about why they are so important.
Chart #1
S&P 500 Breadth
The S&P 500 has performed well in 2023, gaining over 14% YTD. Analogs are plentiful about how equity markets tend to perform for the next 6 months following such strong performance and the overwhelming consensus is bullish. Market commentary is now flooded with "new bull market" declarations.
Over 90% of the S&P 500's gain this year has been concentrated in the top 7 stocks. These stocks include Apple ( AAPL ), Microsoft ( MSFT ), NVIDIA ( NVDA ), Alphabet ( GOOG ), Meta ( META ), Amazon ( AMZN ), and Tesla ( TSLA ). All of these stocks are mega cap stocks. Most have strong balance sheets and are involved in tech. The best performing among them have perceived advantages in the A.I. space.
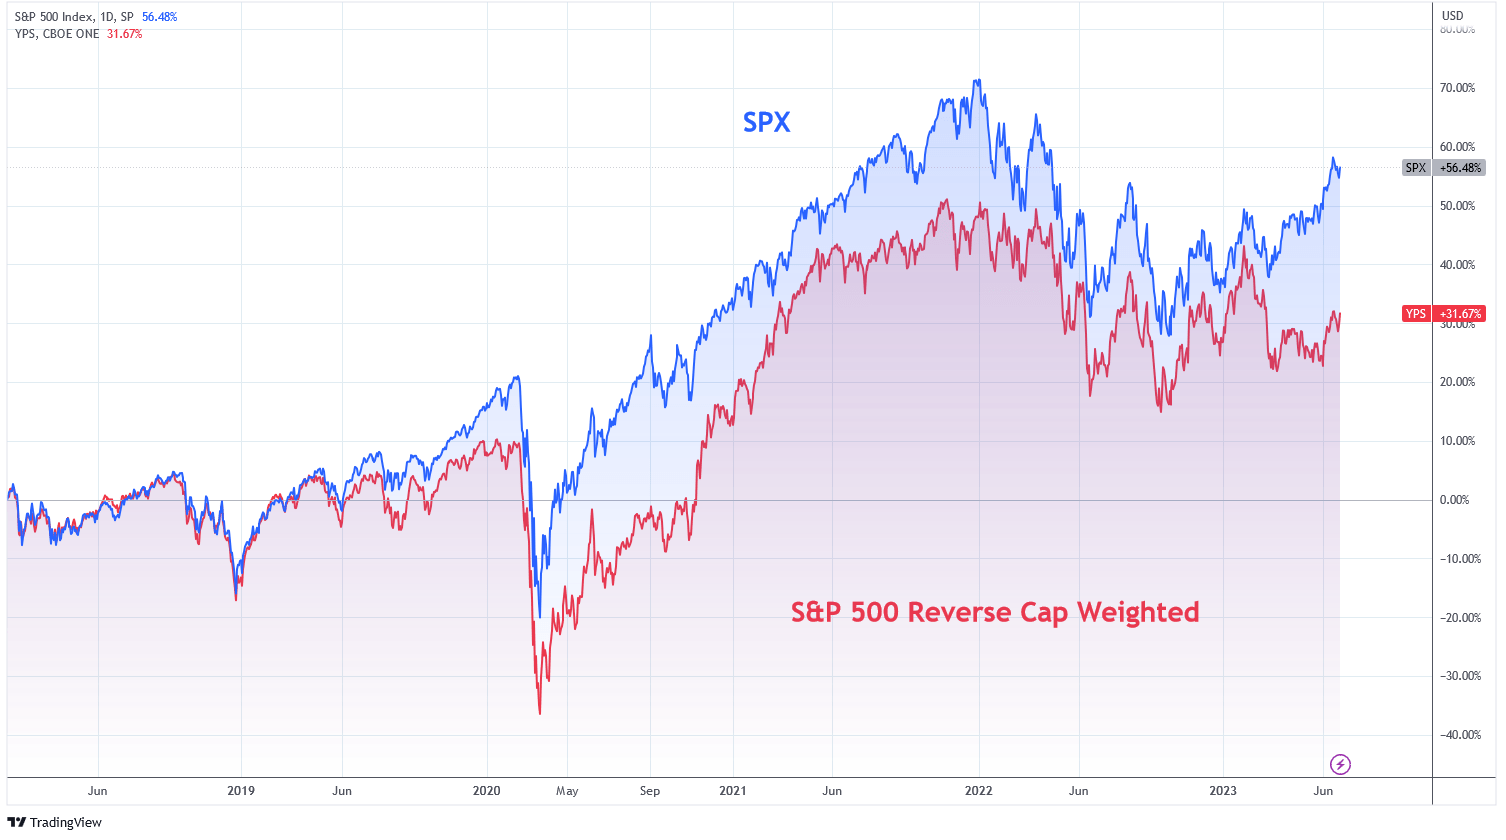
Our first chart shows the stark contrast between these top performing stocks and the rest of the S&P 500. Market participation breadth is uncharacteristically low. The S&P 500 is a market cap weighted index. This results in overweight allocation to large cap companies. Below is the S&P 500 compared to the reverse market cap weighted S&P 500 index, which under-weights the largest cap companies (i.e. the opposite of the S&P 500). This reverse weighted index is down on the year. Breadth has started to improve recently.
Charts by TradingView (adapted by author)
Chart #2
U.S. Liquidity and Equities
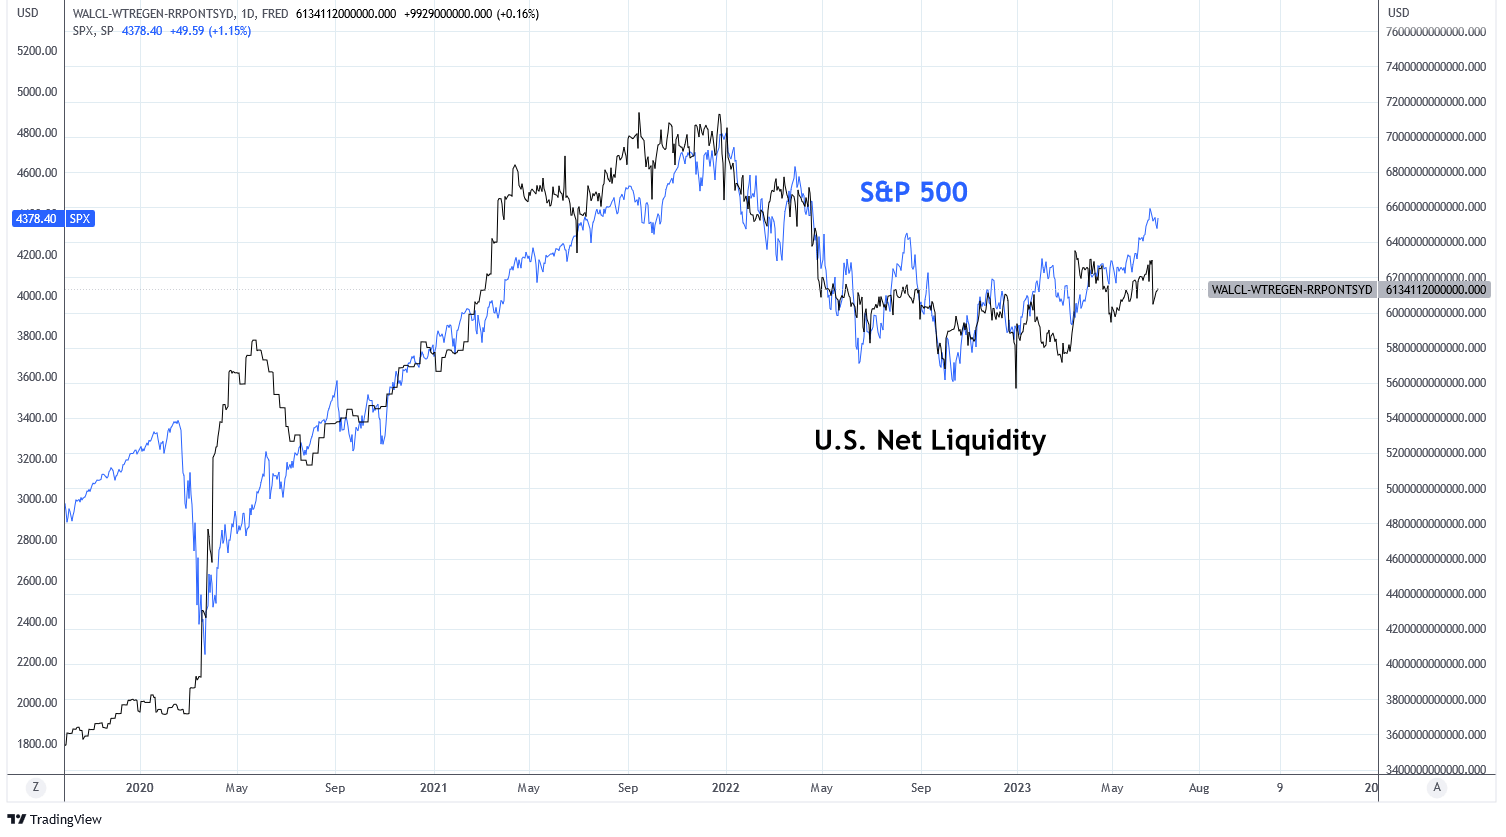
Liquidity is a powerful market driver and often determines market direction above all else. While the Fed has continued its quantitative tightening, U.S. net liquidity has been on the rise in 2023. This is certainty having a positive impact on risk assets. If the Treasury General Account is raised without a commensurate decline in Reserve Repo Operations liquidity could decline.
Charts by TradingView (adapted by author)
Chart #3
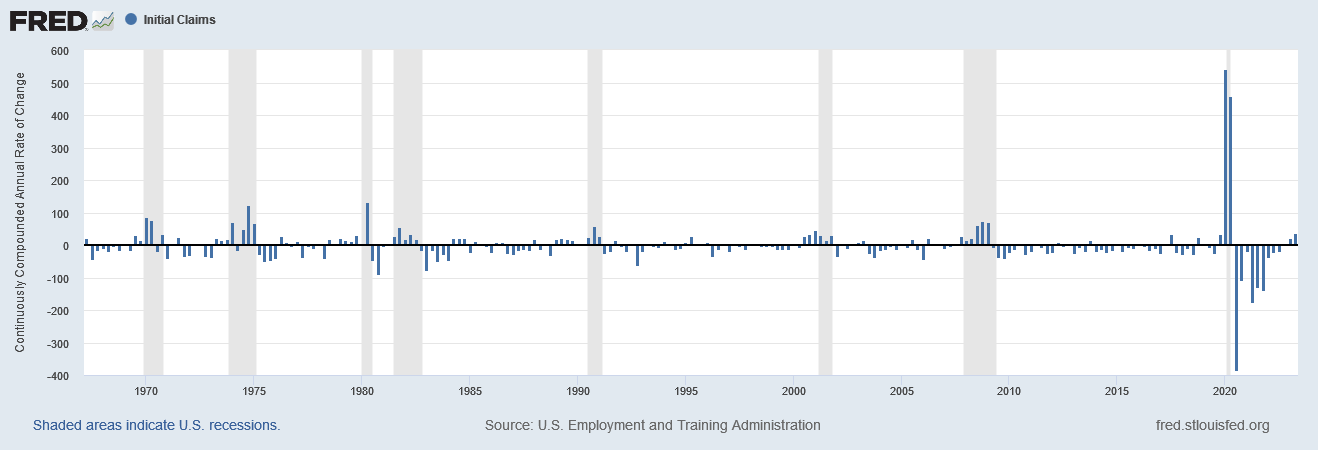
U.S. Initial Jobless Claims
The strength of the jobs market, including a low unemployment rate of 3.7% and 10 million job openings, is widely cited as an indicator of economic strength. The trend in Initial jobless claims has now turned from negative to positive for 2 consecutive quarters. In Q2 2023, initial claims were rising at an annualized rate of 36%. The trend has the potential to point towards further employment weakness ahead.
Federal Reserve Economic Data | FRED | St. Louis Fed
Chart #4
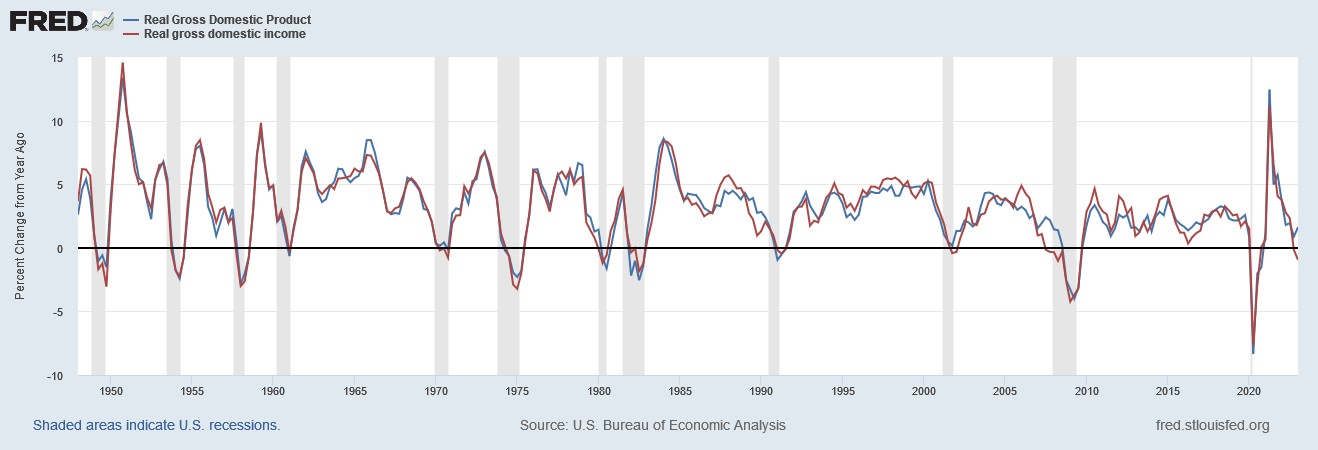
U.S. Real Gross Domestic Product and Real Gross Domestic Income
U.S. Real GDP has remained stable after posting two consecutive negative quarters in 2022. We believe that real GDP may be lower than reported as official inflation statistics sometimes fail to capture the full effect of price inflation. Real Gross Domestic Income, in contrast, has been negative for two consecutive quarters. The relationship between GDP and GDI is closely correlated. GDI may be forecasting negative GDP numbers, as it did in 2007 and 1989.
Federal Reserve Economic Data | FRED | St. Louis Fed
Conclusion
Markets are at a pivotal point. The new bull market thesis would require economic data to follow equities in a turnaround. Recent equity performance is largely a result of liquidity and narratives. These are some of the most important data to keep an eye on. Based on history, we remain conservative in our risk profile.
For further details see:
4 Charts That Matter Today