YRI:CC - Acquisition Mode - B2Gold Mining And Agnico Eagle Mines (Technical Analysis)
Summary
- Quick background on Agnico Eagle Mines Limited and B2Gold Corp.
- Fundamentals that make them attractive vs peers.
- Technical Analysis, and key supports.
- Nuggets on Gold from Lyn Alden.
Contributed by Mark Malinowski.
Who are these companies?
B2Gold Corp. ( BTG ) at $3.6B USD market cap is a mining company headquartered in Vancouver that operates three mines. While that is relatively small, that does put it in the top 20 for gold miners by market cap. It operates the Fekola Mine in Mali, the Masbate Mine in the Philippines and the Otjikoto Mine in Namibia. It has additional development projects in the Philippines and Colombia. B2Gold has also just put out an offer to purchase Sabina Gold & Silver Corp. (SBB:CA) as an in-kind shares transaction, which will push their market cap up around 25% toward $4.5B USD.
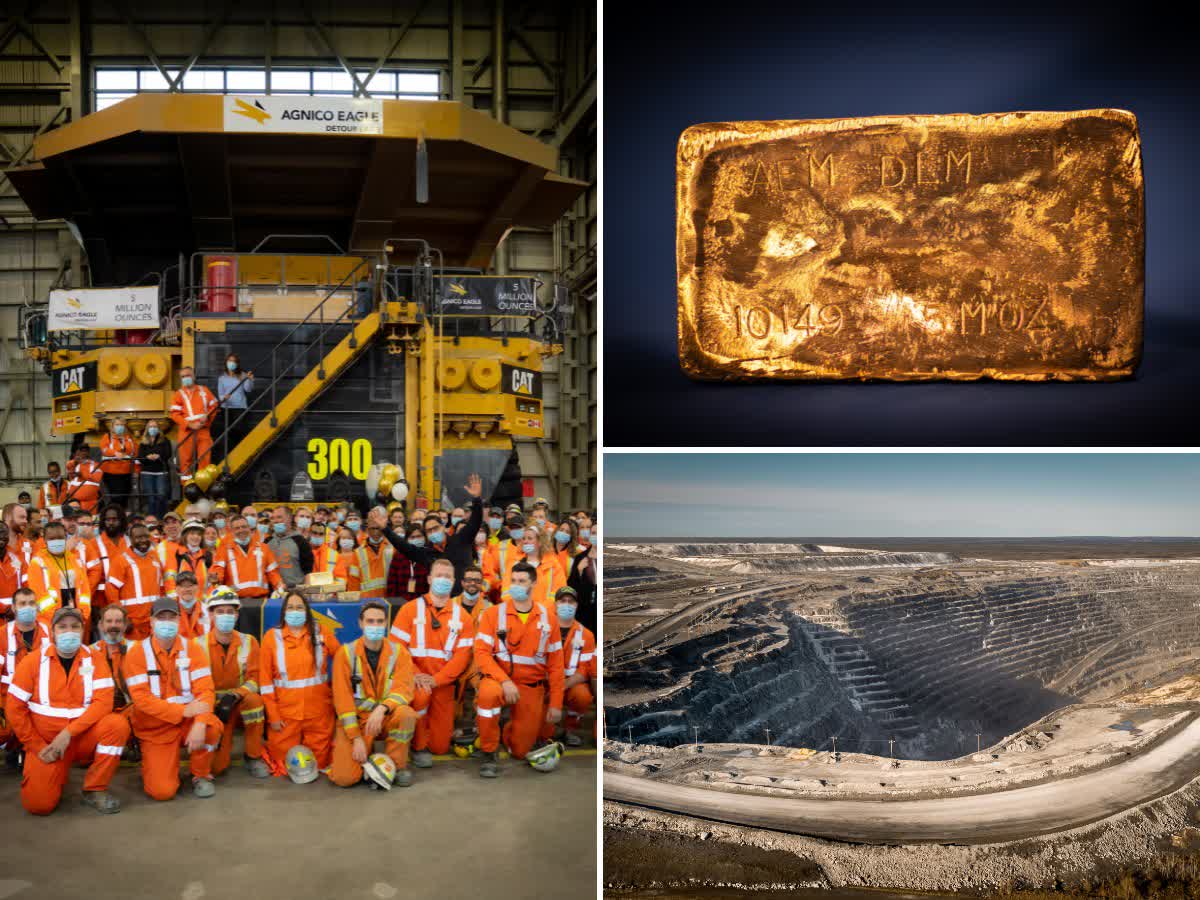
Agnico Eagle Mines Limited ( AEM ) is a senior miner and a component of the GDX ETF ( GDX ). At just over $20B, USD it ranks fourth just behind Barrick ( GOLD ), Newmont Corporation ( NEM ), & Franco-Nevada ( FNV ). Last year it effectively merged with another senior miner, Kirkland Gold, which was focused heavily on Canadian mining operations. This diversification North of the 49th parallel, along with synergies in logistics, infrastructure and administration, has improved Agnico’s All In Sustaining Cost ((AISC)) per ounce produced despite inflationary pressures when compared with last year. It also has an offer to purchase Yamana Gold ( AUY ) (YRI:CA) (expected to close in March 2023) which will increase production within Canada even further.
Fundamentally Speaking
Both these companies pay a reasonable dividends. In USD (Based on Feb 17th data):
BTG current yield = 4.83%
AEM current yield = 3.52%
Why is this important?
This means they are generating cash flow, even as prices for gold and silver have been drifting lower and sideways for almost 2 years.
The current cost of borrowing for companies has increased significantly, with the Fed raising rates 8 times since March 1, 2022. These two companies have been effectively merging by issuing shares to keep their costs down, instead of borrowing. This has kept debt levels low, which enhances their ability to make investment decisions that are smart, instead of making them out of fear, as the cost of borrowing increases.
Comparing Apples to Apples:
The P/E ratio for BTG, with its recent price drop on announcing the acquisition of Sabina Gold and Silver, is at a paltry 11.3. Most intermediate miners typically trade closer to a P/E of 20 (Example Yamana Gold being purchased by AEM) and some of those have dipped into negative EPS during this pullback in gold and silver prices, while BTG has remained cash flow positive.
Agnico Eagle, on the other hand, with its post-earnings price drop is trading at a P/E of around 30, but it continues to grow. After the completion of the acquisition of Yamana, AEM will have a Market Cap a mere stone's throw away (10%) from Barrick Gold Corporation, which currently trades at a P/E of ~70.
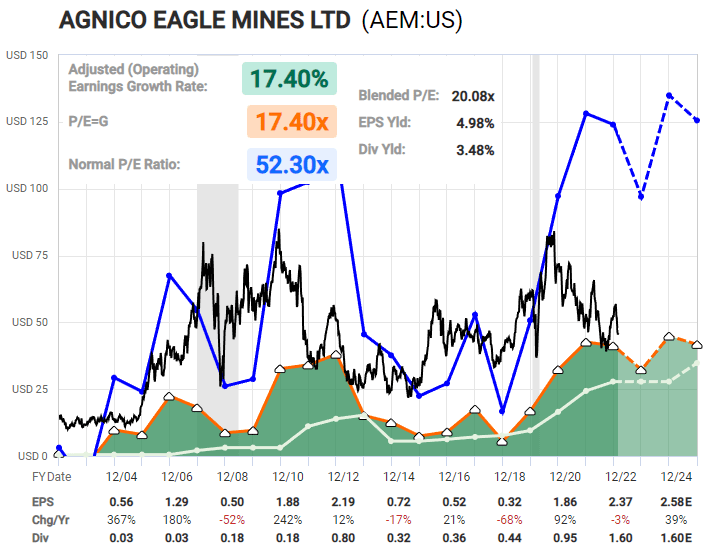
While Lyn Alden usually finds FAST Graphs more noisy than helpful for miners in general, she was happy to share the one for AEM. Although it is far from a deep value company it is bouncing off a touch of the orange line, which has been helpful in the past.
AEM FAST Graph provided by Lyn Alden (FAST Graph - Lyn Alden)
Lyn says that on mining companies, while management decisions are important, the direction of gold is also of key importance.
“I view gold as building a pretty good long-term base ever since it began consolidating in mid-2020. The Fed's ongoing tightening is putting some pressure on it but that can only on for so long, and so as we look out in the years ahead I think gold is rather well-positioned for an upside break-out.
Higher interest rates by the Fed can slow down private sector lending, but increases interest on public debt and therefore increases fiscal deficits, which are a source of new money creation. The 2020s decade is likely to be defined by varying levels of fiscal-driven inflation, and if this starts to be seen by market participants as a longer-term problem, then gold is likely to be among the major beneficiaries.” -Lyn Alden.
What do we like?
We like companies with strong balance sheets and strong operations in safe operating environments, like Canada and the USA. The stability in government and regulatory requirements creates clear conditions for investment decisions. Both of these companies are increasing their holdings in Canada with the currently planned acquisitions and are doing it in a way that doesn’t increase their debt.
Technically Challenging
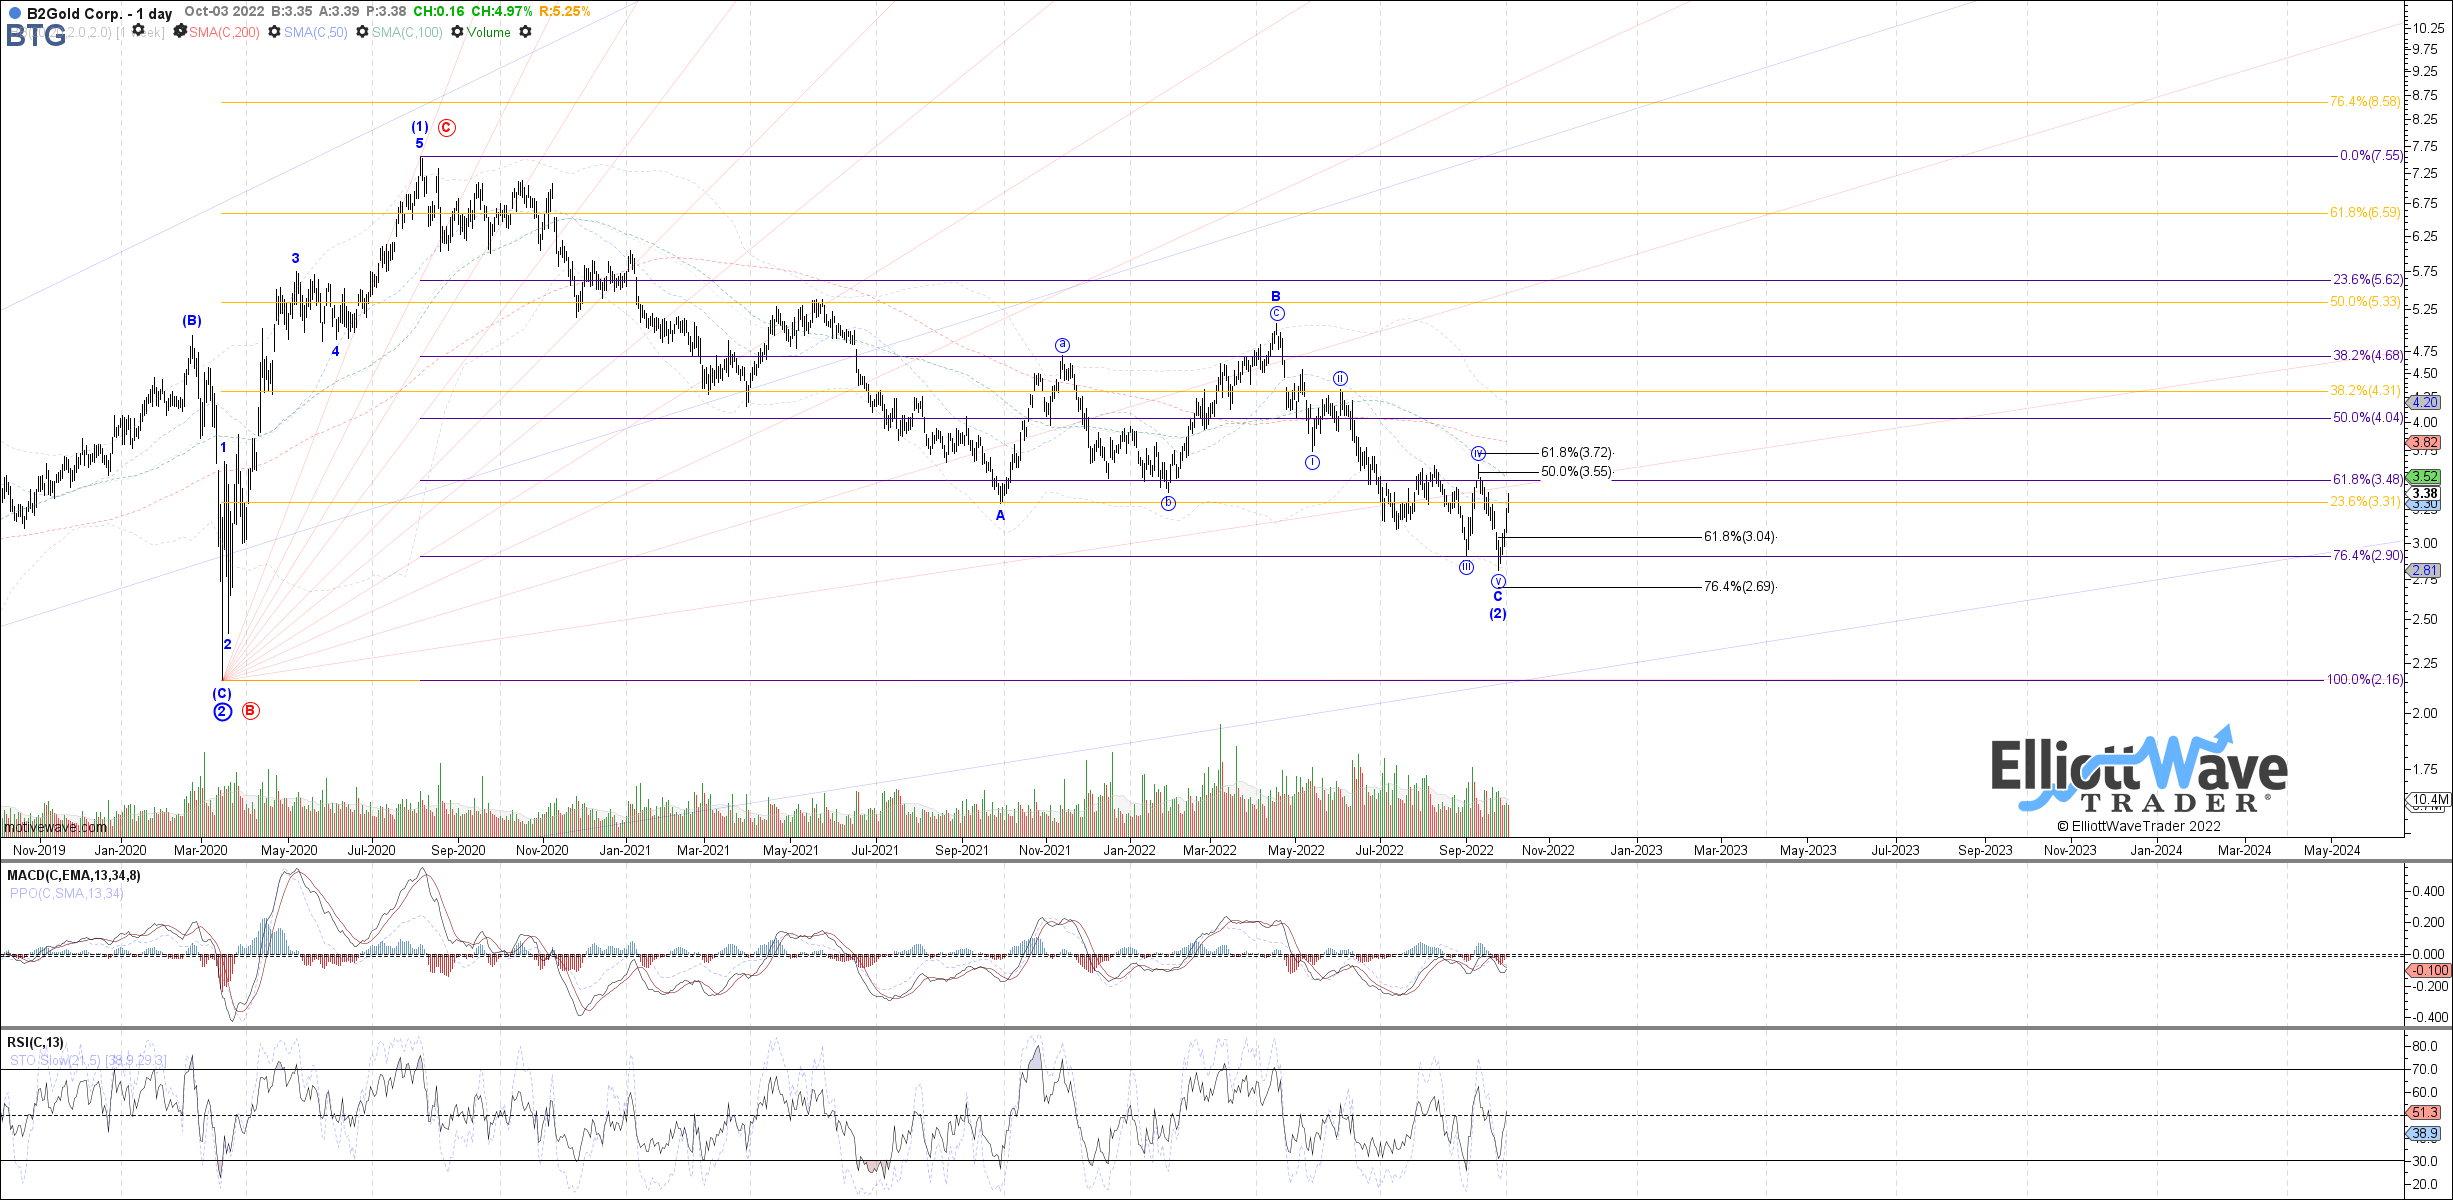
The technical view on these companies is also very similar. Back in October of 2022 Garrett Patten in the Metals Miners & Agriculture service (part of Elliott Wave Trader), identified a potential bottom for both these companies.
The analysts noted that B2Gold was coming into support after a long consolidation in a very complex pattern and had bounced but had not yet provided a clear indication of a bottom, we look for 5 waves up from a low and 3 waves down as a corrective retrace pattern for the greatest clarity.
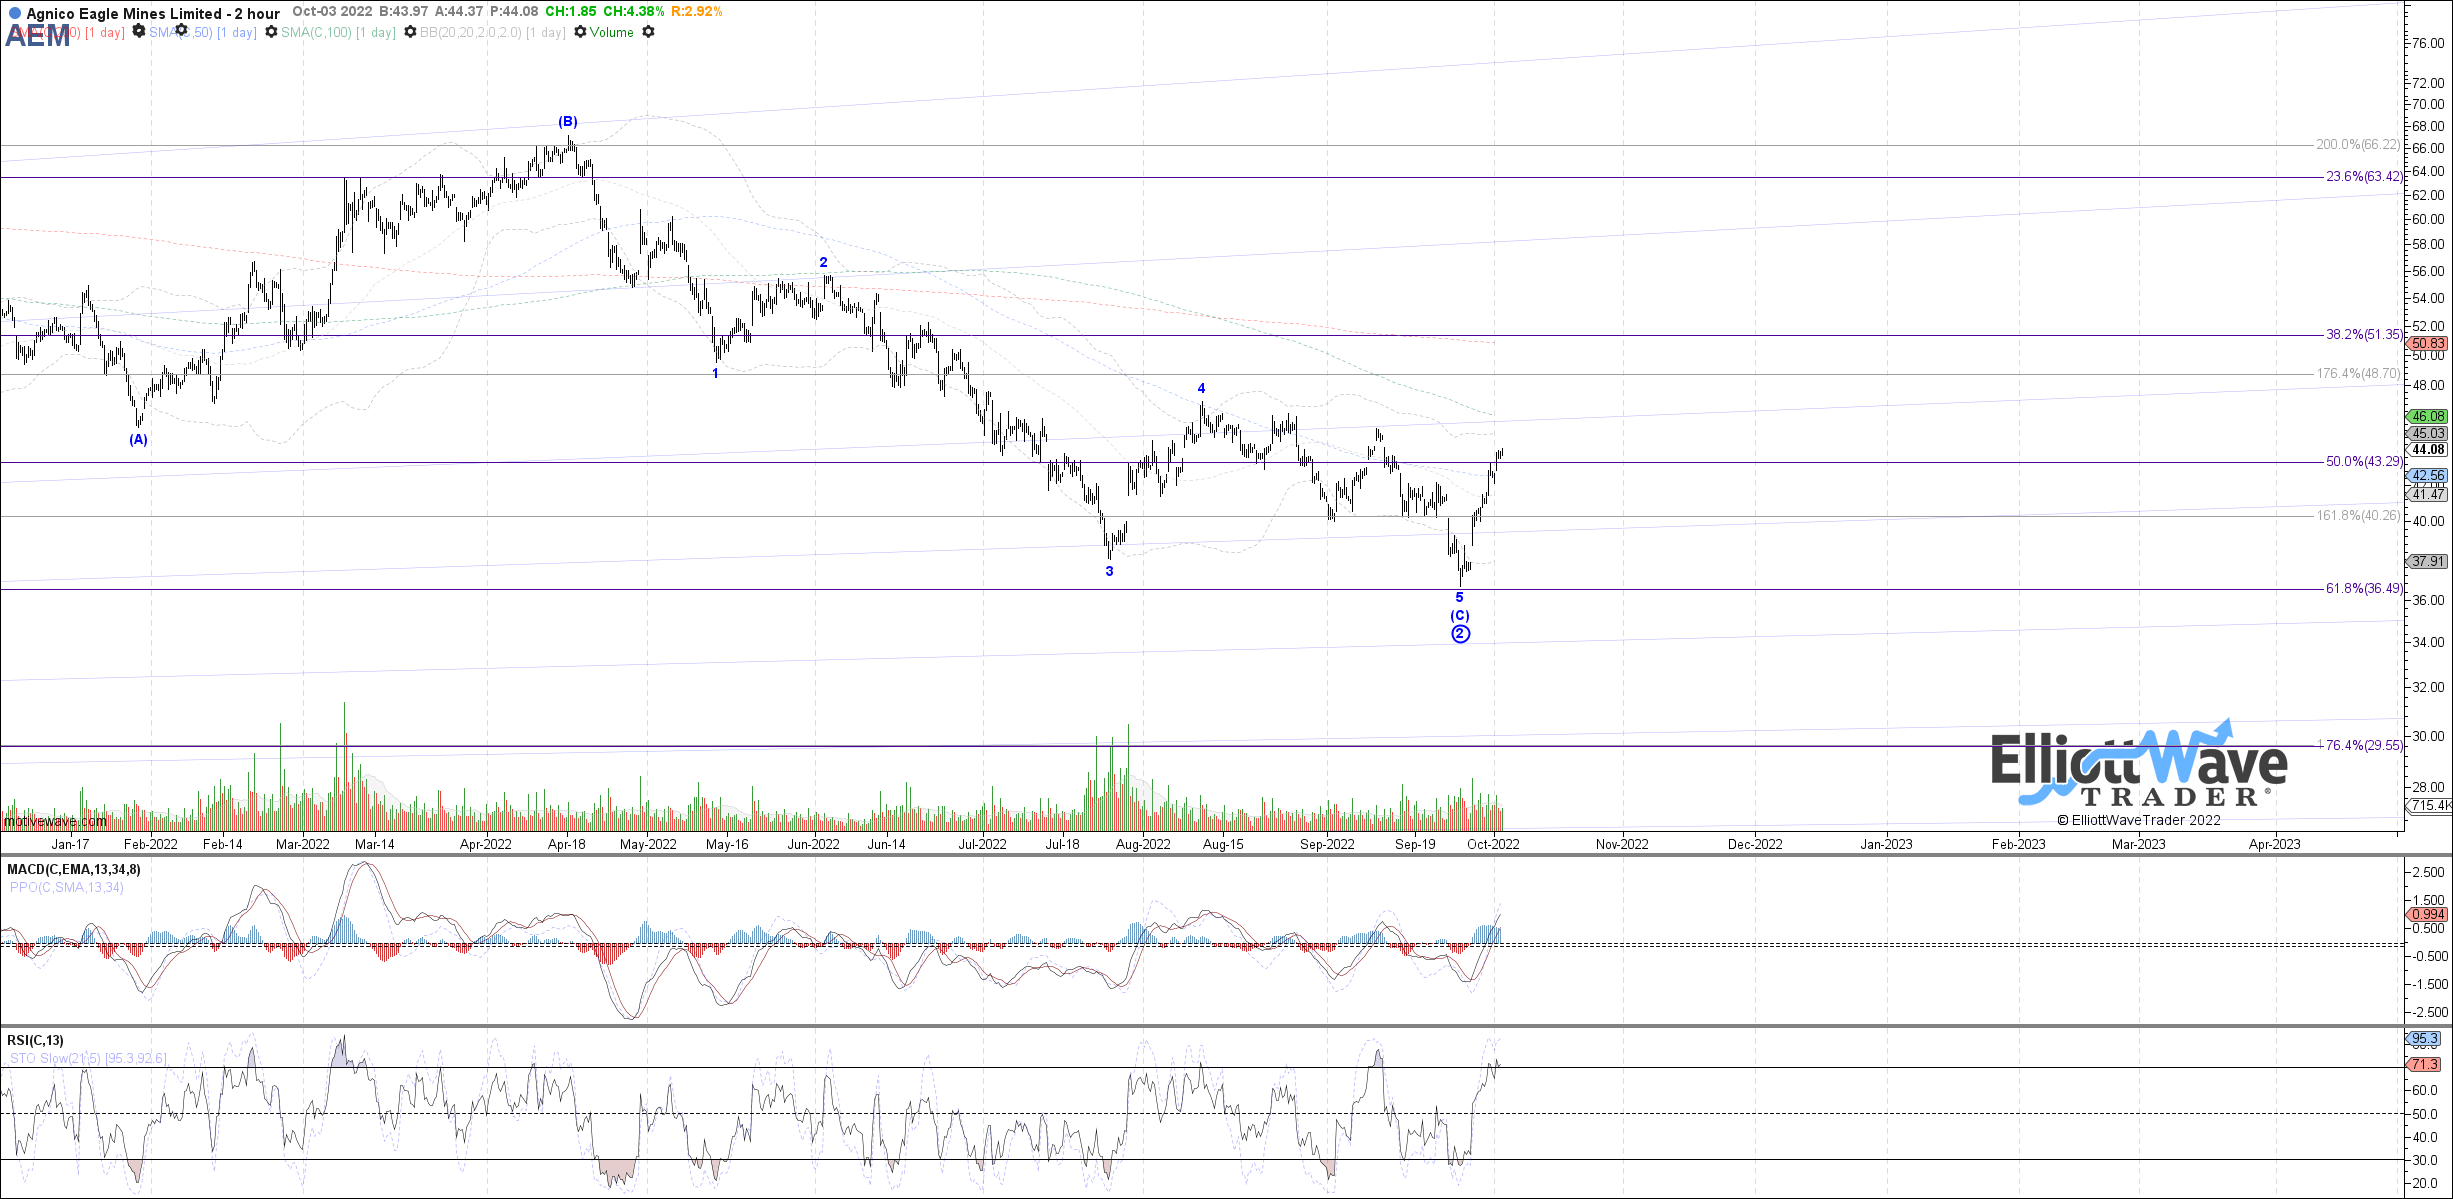
Oct 3, 2022 BTG Daily Chart from Garrett Pattern (Garrett Patten, EWT) AEM Oct 3, 2022 2hr Chart from Garrett Pattern (Garrett Patten, EWT)
On AEM , the likely bottom at a larger degree was shown, but subwaves inside the start of a new swing move were not yet clear.
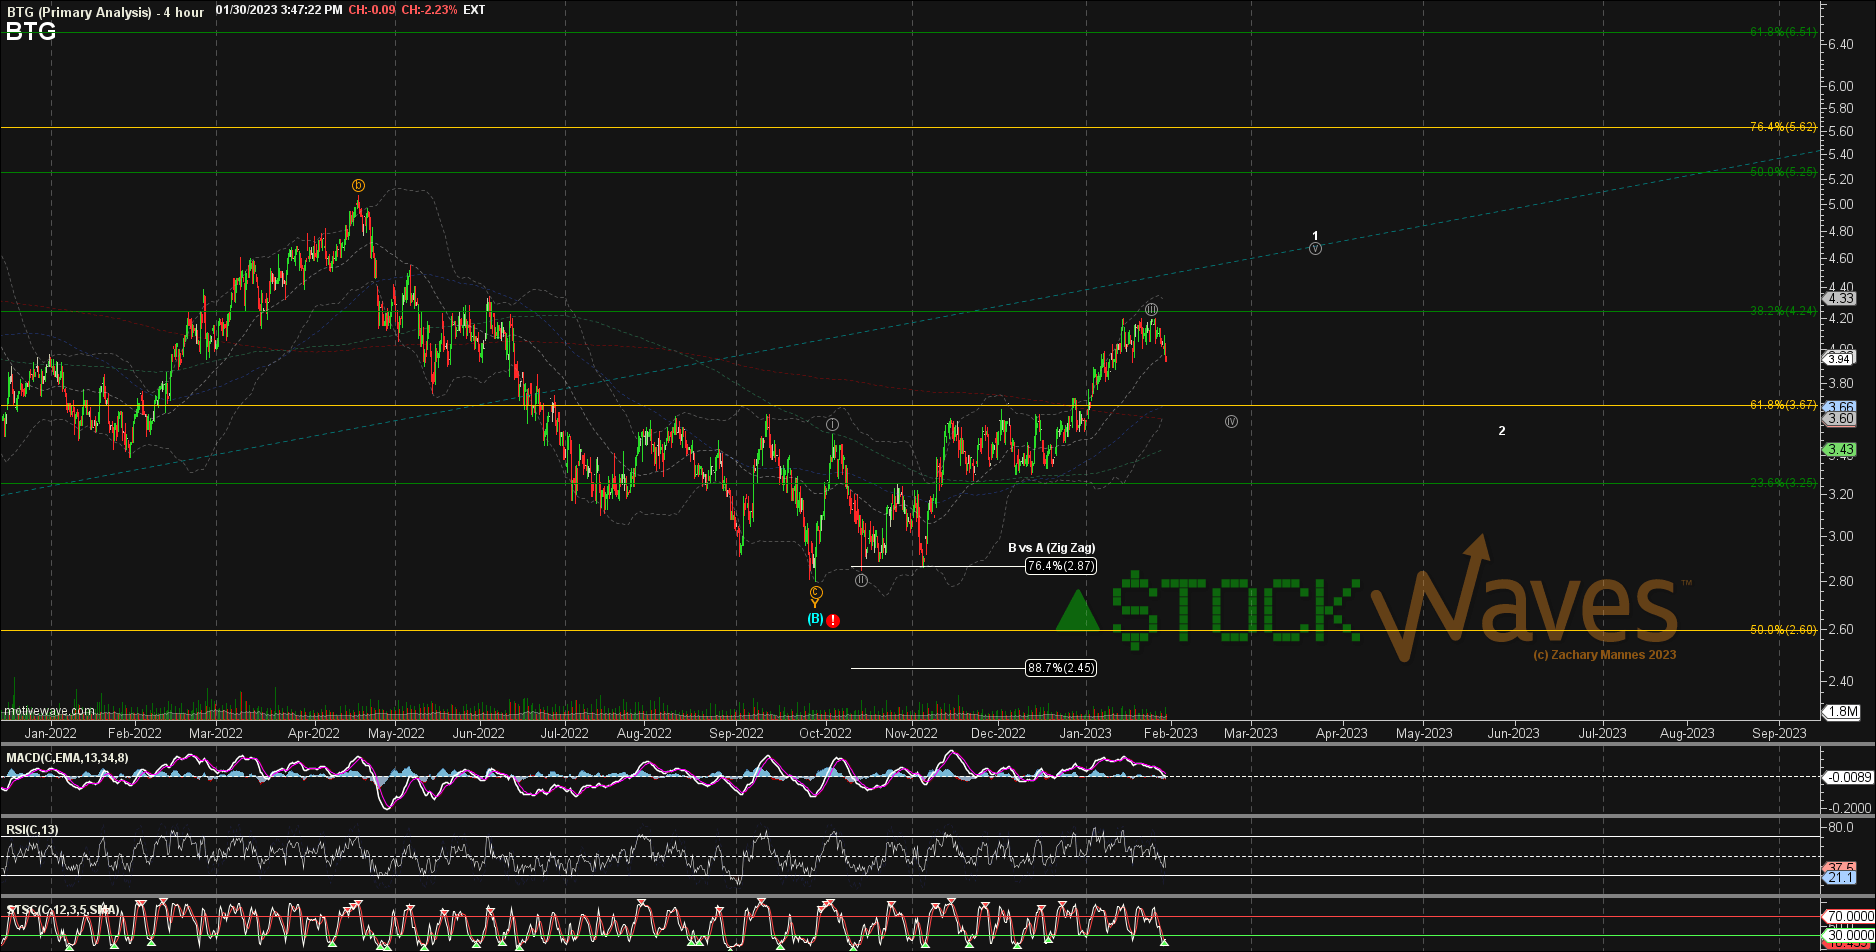
Fast forward through December and January and the leading diagonal pattern continues to play out, including multiple warnings as topping indications were noted in late January, allowing members to make independent decisions about how to position their portfolios.
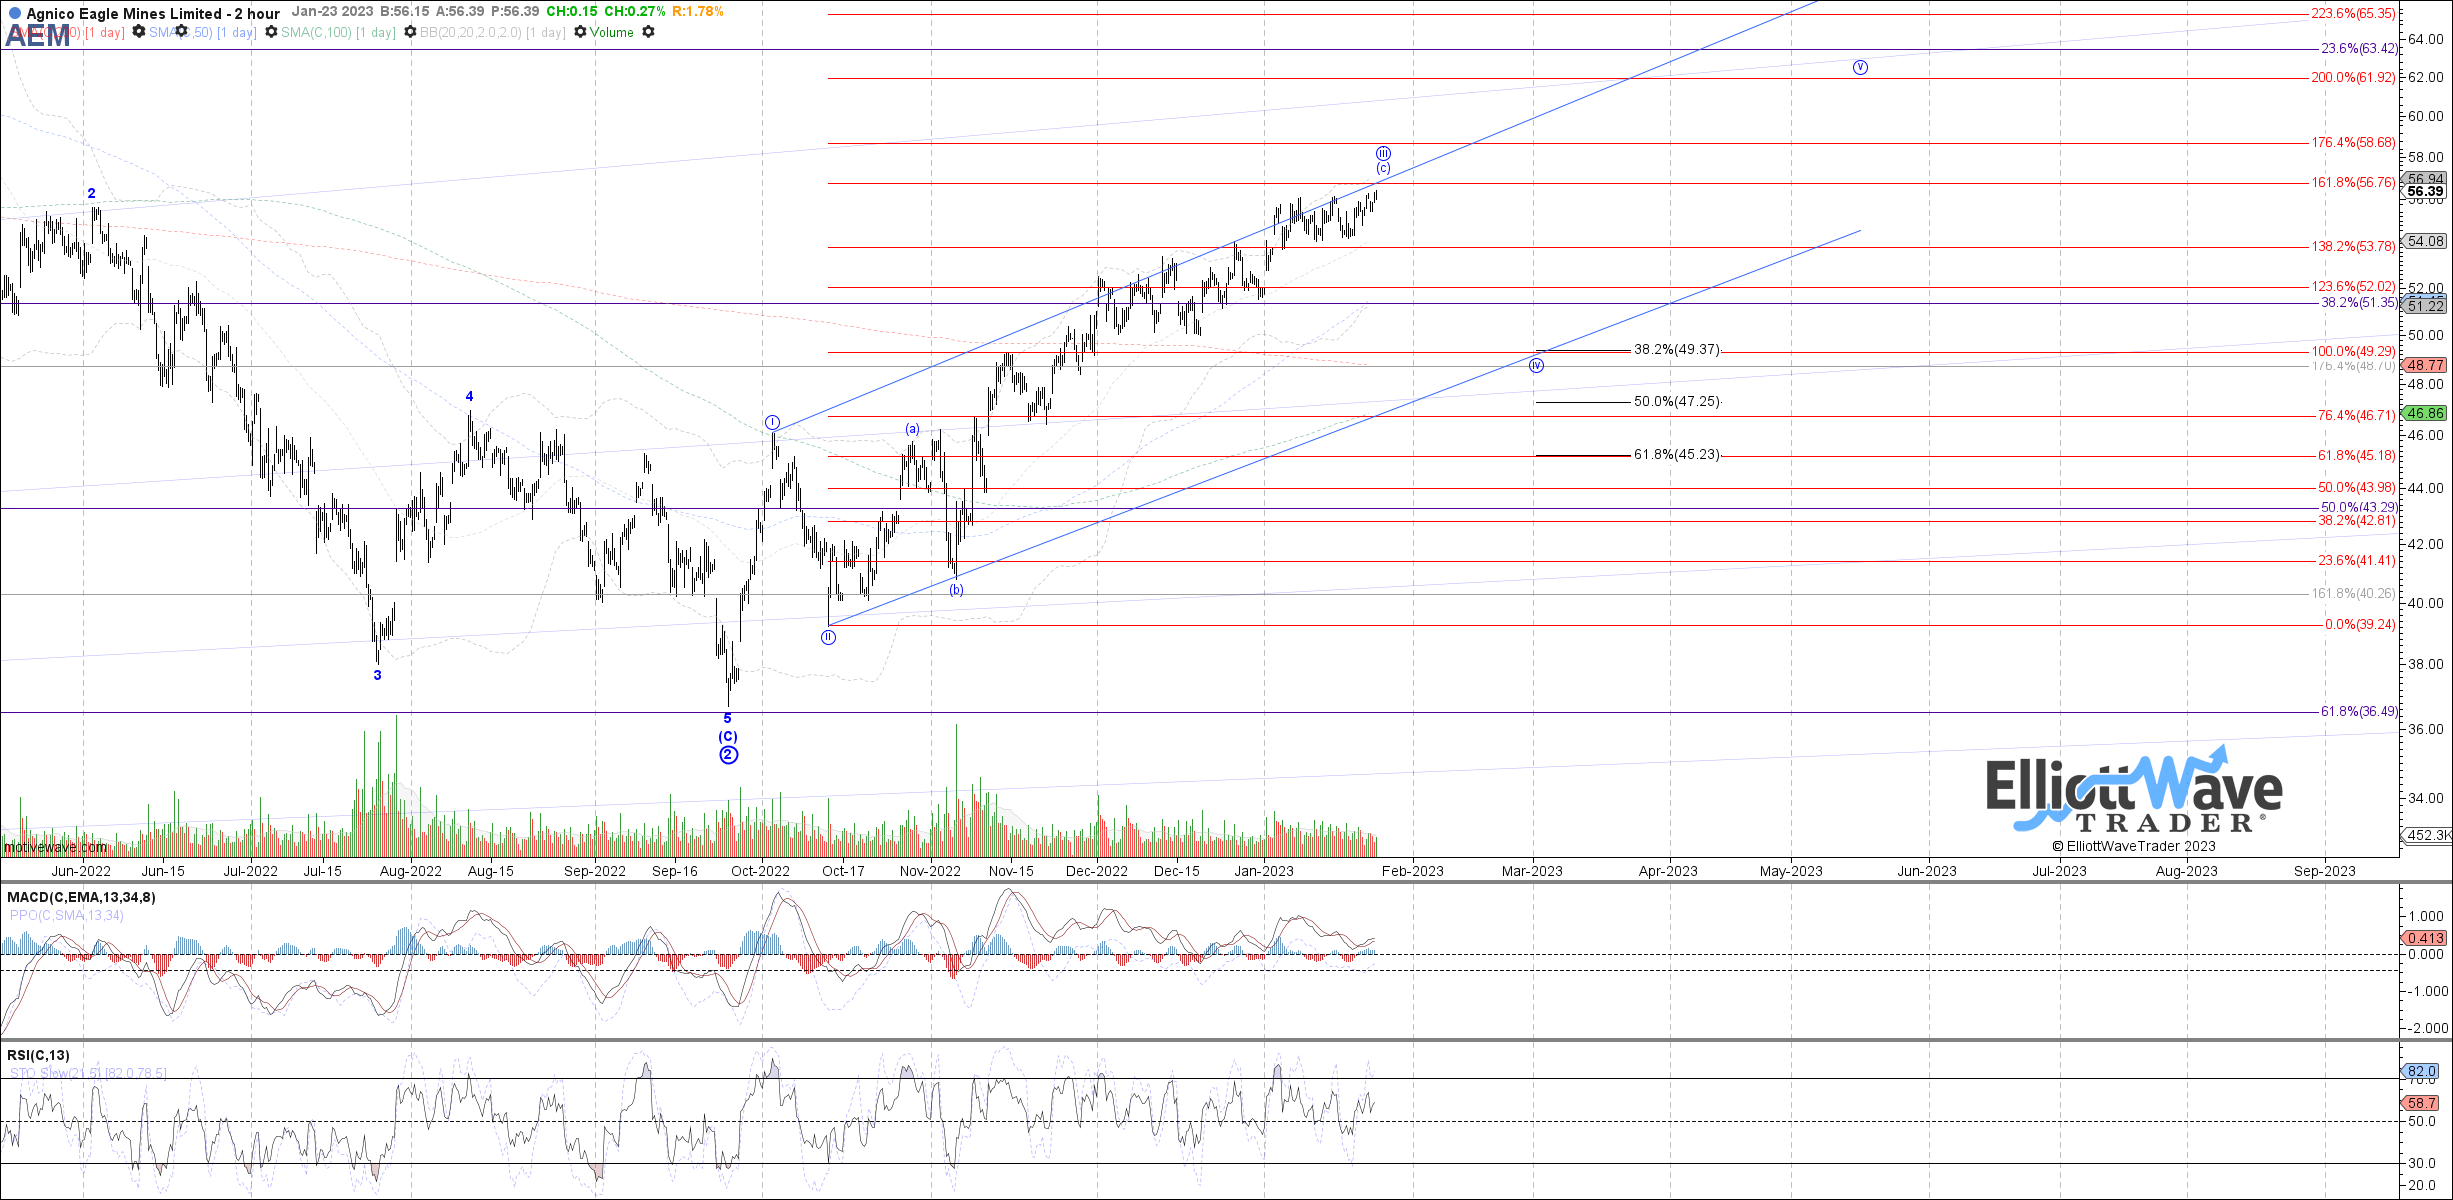
BTG chart from Jan 30 (4hr) showing fade starting. (Zac Mannes, EWT) AEM Jan 23 chart from Garrett showing a pending local top. (Garrett Patten, EWT)
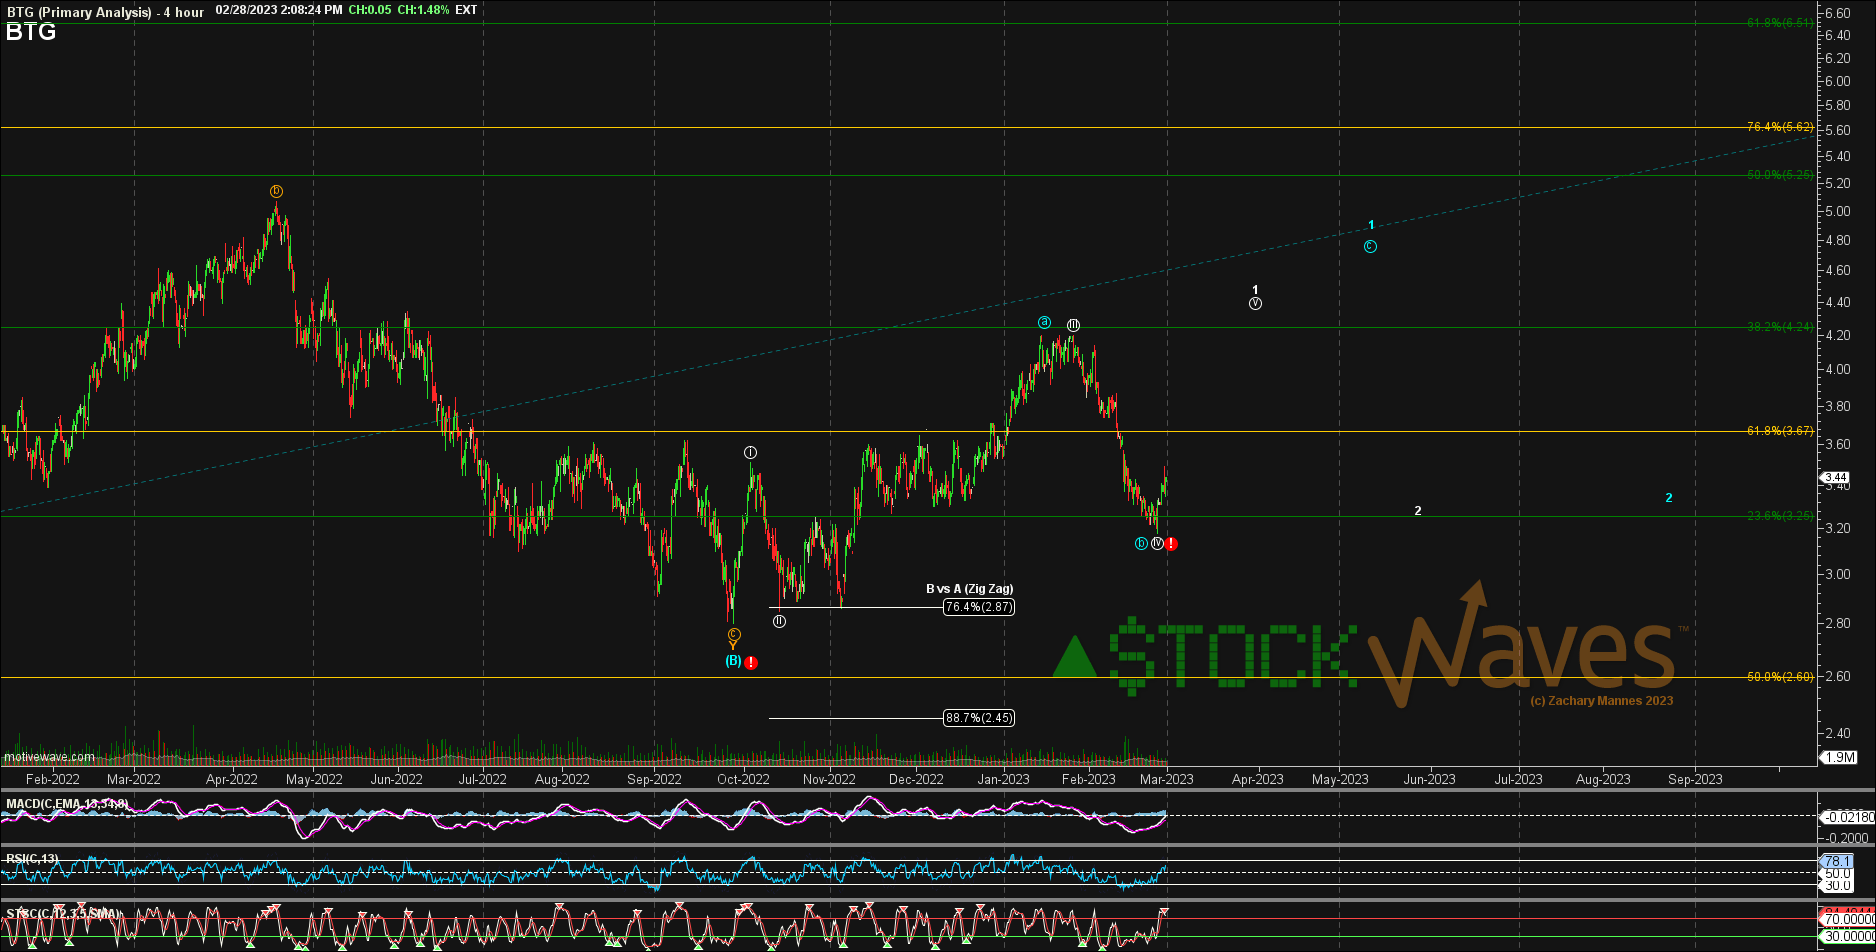
BTG - Has near term support at $3.18 with the next lower support at $3.09. First indications of bottom in place are a price move through $3.62 and then over $3.95. The near term price target is $4.39. It is not yet clear if BTG will provide a more standard five waves up for wave 1 of the larger degree ((C )) wave off the 2022 low or if it is getting an “abc” up for a larger wave 1 but in a larger “Diagonal” pattern.
BTG chart Feb 28 showing a move off support. (Zac Mannes, EWT)
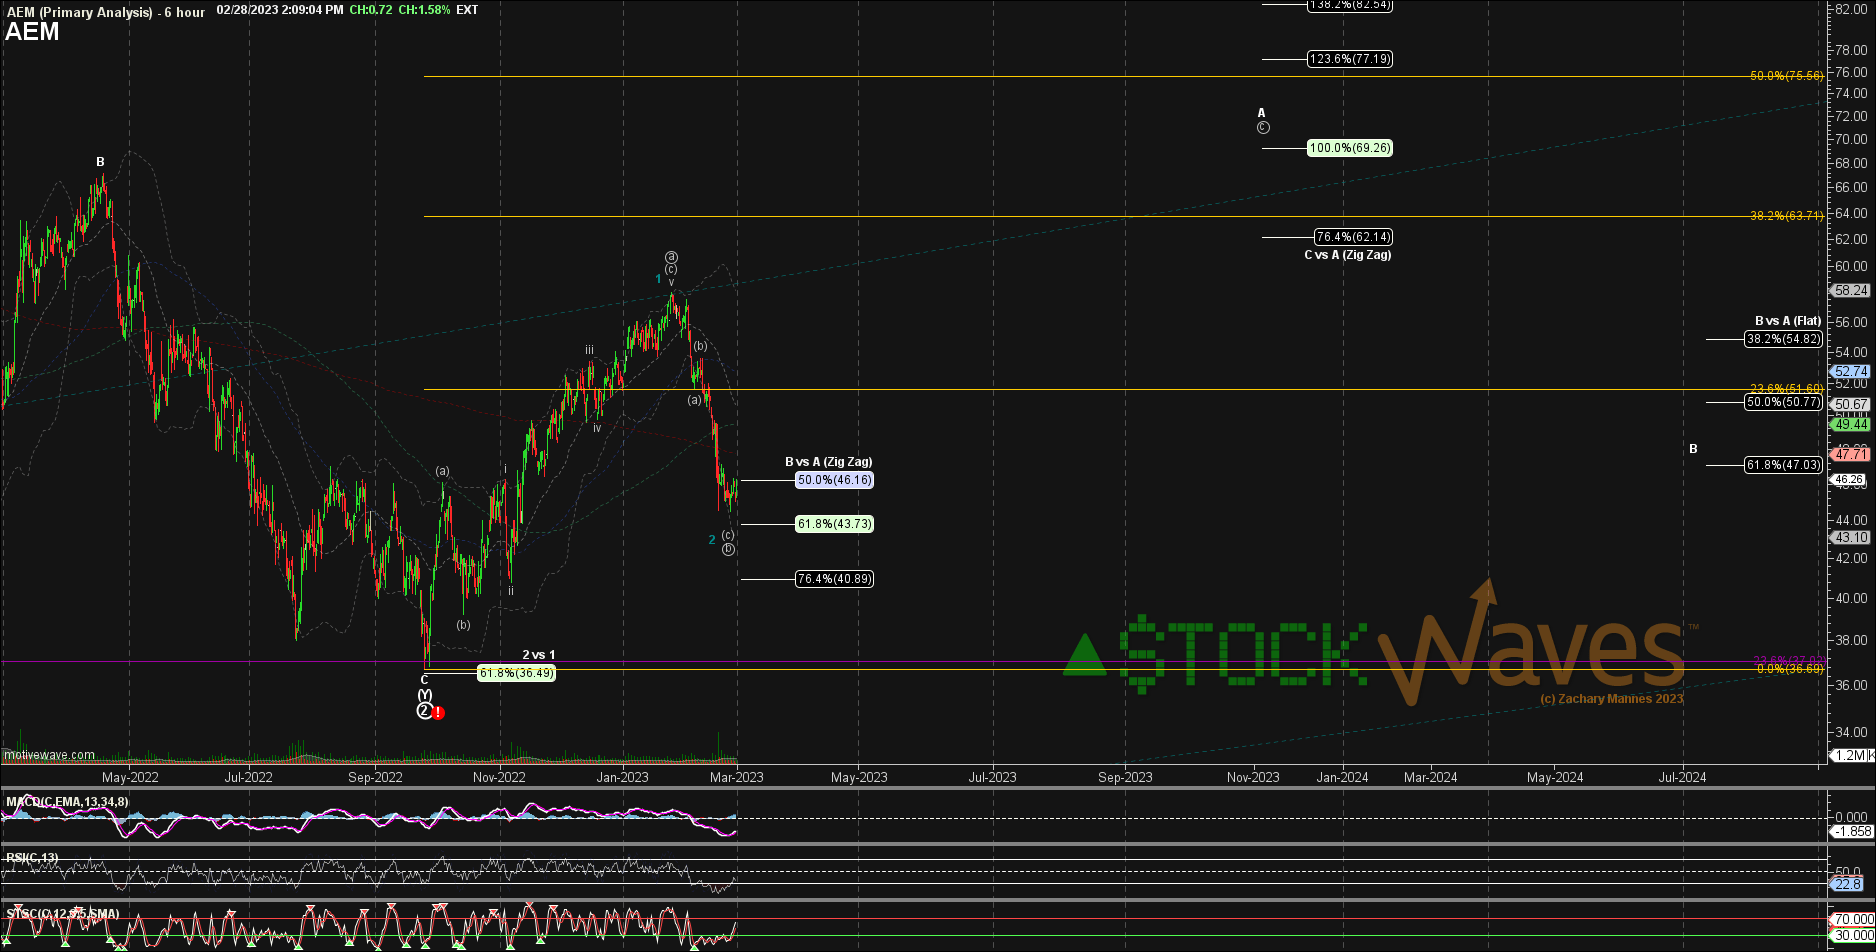
AEM - Has gotten very close to ideal support at $43.73, this is its 61.8% Fibonacci retrace level of the entire move up from the 2022 low. Should that fail to hold, the next lower Fibonacci support is at $40.89.
Initial indications of a near term bottom in place are a price move over $49.65 and then over $52.53.
The first target is $61.92 in for 2023, but has the potential to be much higher, longer term.
AEM chart Feb 28 showing a move off support. (Zac Mannes, EWT)
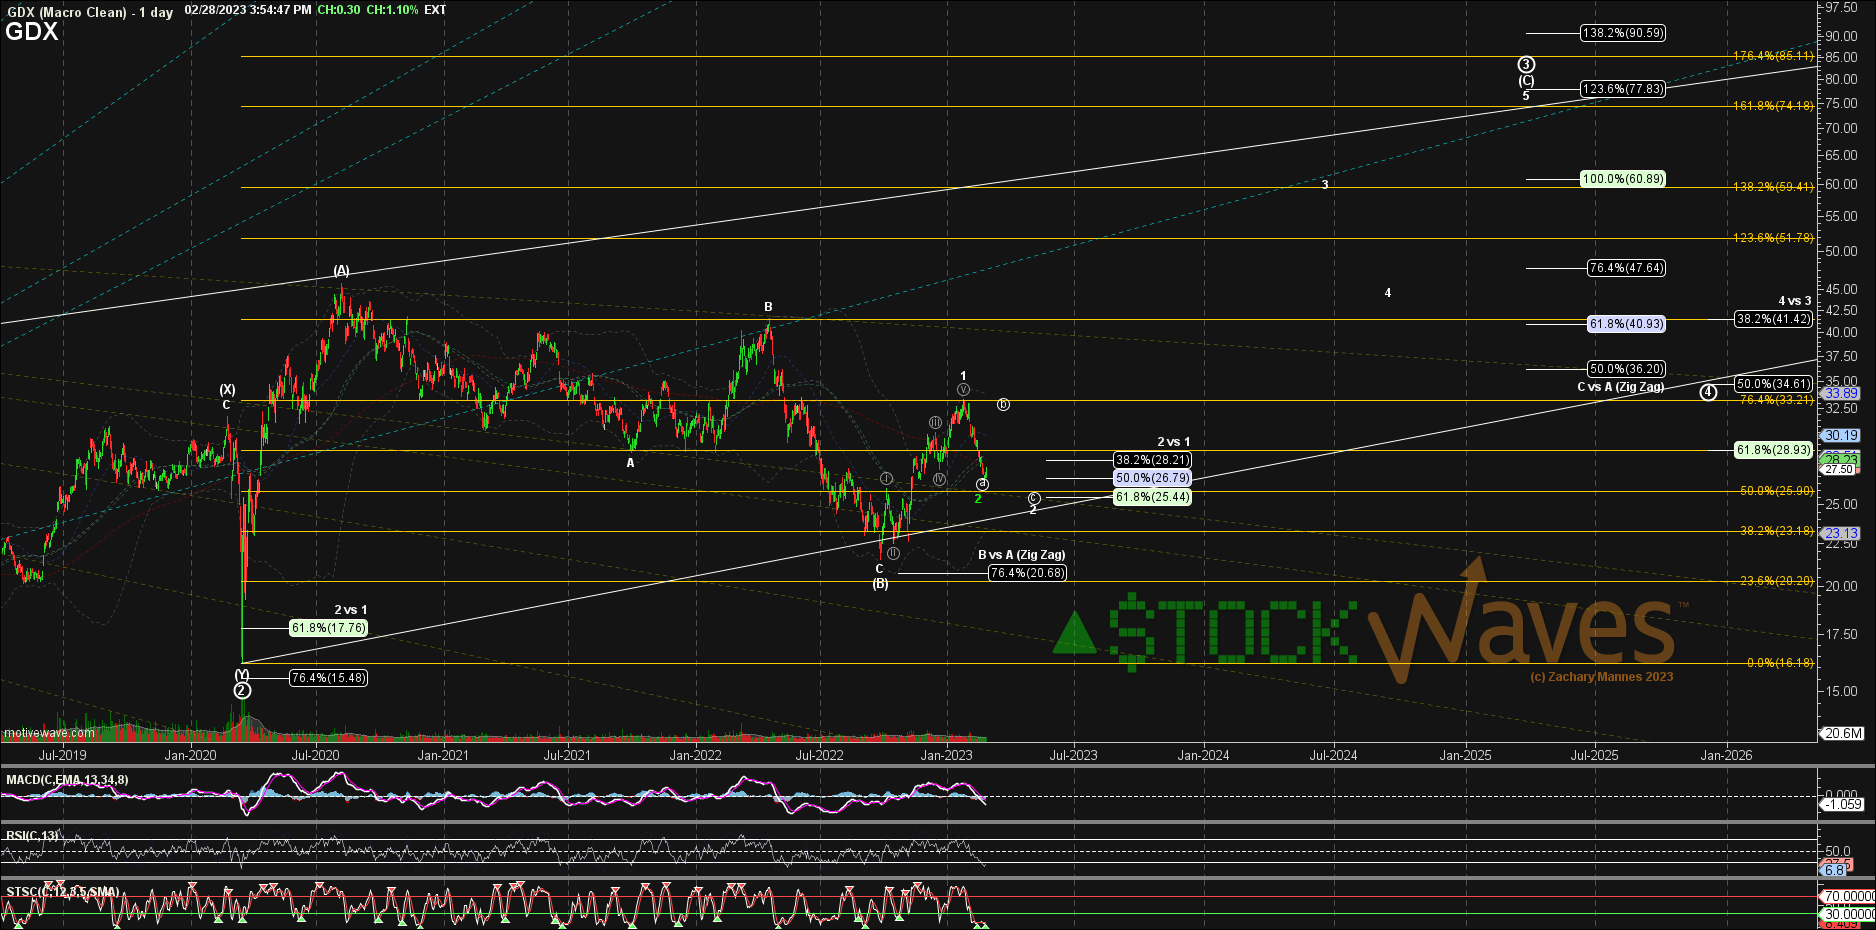
Many stocks in the Mining sector are showing signs of various Diagonal patterns rather than standard Impulse moves. While this can be one of the most challenging patterns to navigate. When the path is laid out clearly, there are actually many more trade opportunities over a longer period of time and therefore it can actually be more rewarding. While still possible for the large move projected in GDX off the 2022 low to itself turn into a Diagonal (it is already part of a much larger diagonal) so far it is acting more impulsive. We have a solid five waves up off the September low, and are working on a cleaner abc retrace for a three wave retrace as wave 2.
GDX Daily chart Feb 28 showing a move off support. (Zac Mannes, EWT)
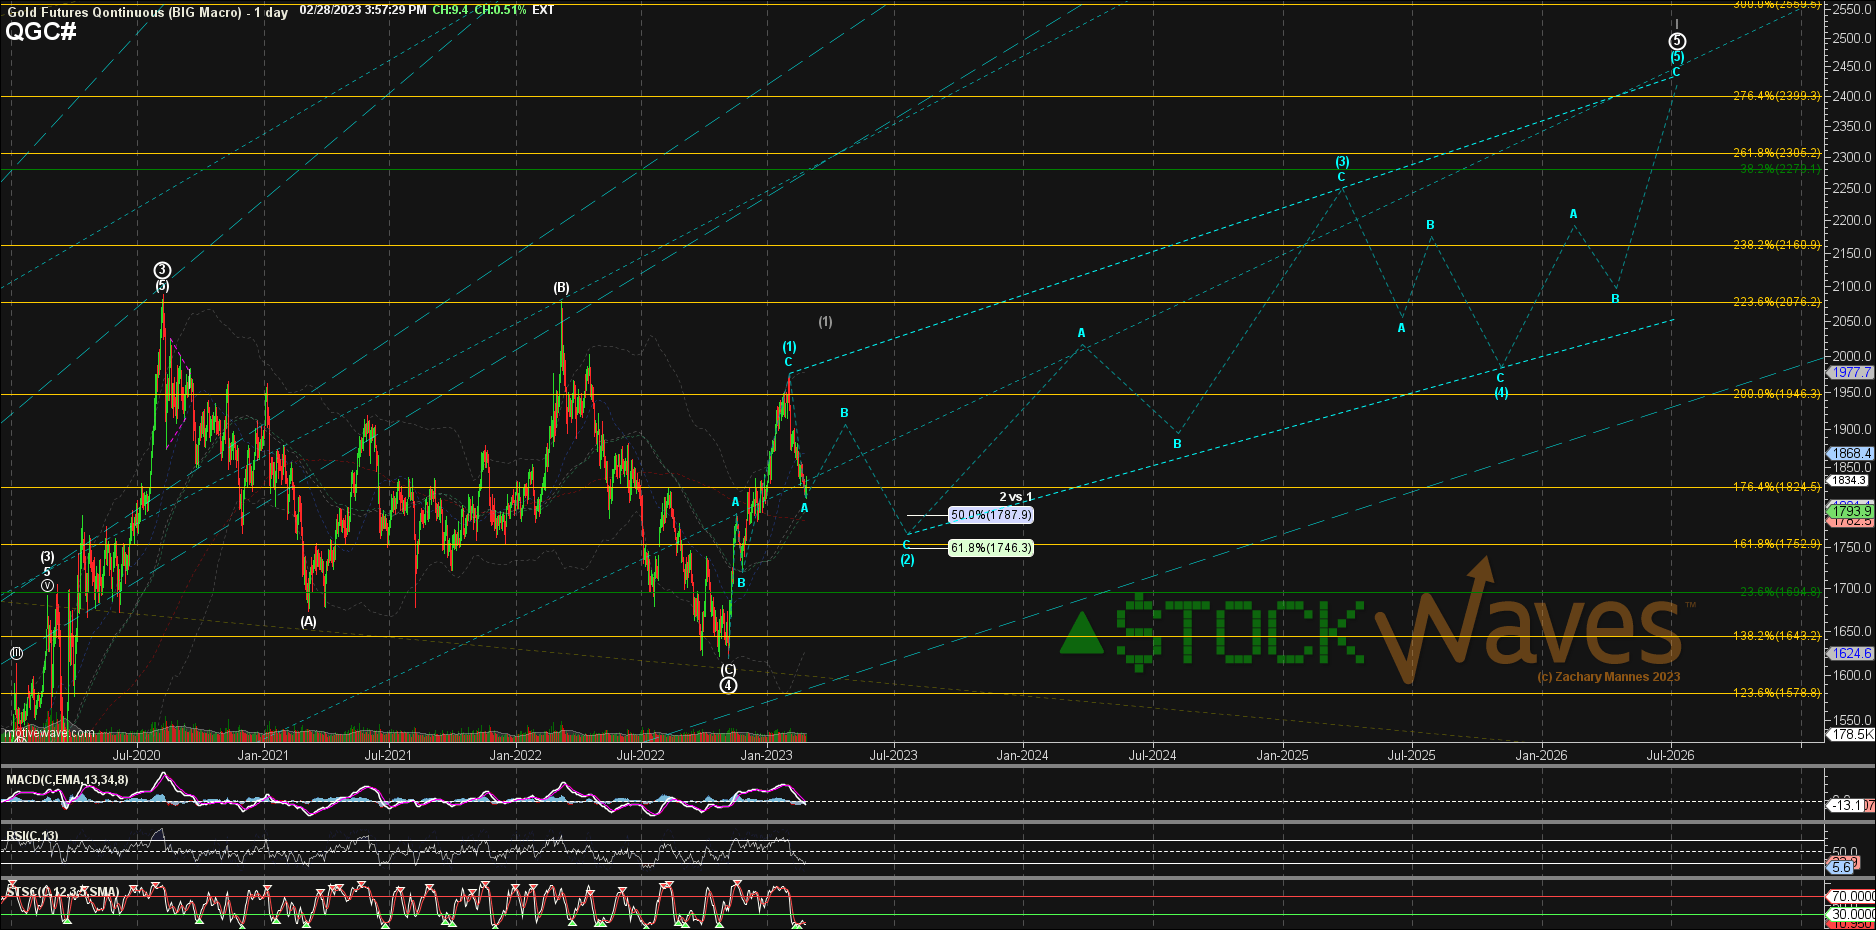
We see the price of gold and silver significantly higher over the next 2 years and as Avi Gilbert, The Market Pinball Wizard recently posted a public target for Gold on January 17, 2023 , this aligns well with the increased profit potential for these two growing companies over the next few years.
Gold futures Daily chart Feb 28 showing a move off support. (Zac Mannes, EWT)
Longer term, there is a very bullish view of metals in the coming years. But how should one take advantage of that opportunity?
In our Metals Miners & Agriculture service, we provide similar Wave Setups to those in our Stock Waves services. Here we highlight high probability favorable Risk:Reward setups on charts displaying clean subwaves in good Elliott Wave patterns and specify Support, Invalidation, Resistance, and Target levels. We post these as the charts are entering or turning up from actionable support zones.
We hope to roll out a version of the Metals Miners & Ag service on the Seeking Alpha Market Place soon, in the meantime you can still get MMA at a 50% discount when it is combined with Stock Waves.
For further details see:
Acquisition Mode - B2Gold Mining And Agnico Eagle Mines (Technical Analysis)