MLPA - AMLP: Ample Shareholder Value
Summary
- The low capex in traditional energy production will sustain energy prices.
- The low capex in the midstream energy infrastructure sector sustains strong free cash flow generation.
- This translates into a very low risk of dividend cuts and allows MLPs to return shareholder value through dividends and buybacks.
- Our favourite Midstream MLP ETF is AMLP.
After the boom and bust in the midstream energy sector capital discipline has returned. Capex is low and this leads to rising free cash flows which will support higher dividends and buybacks. In the past MLPs performed badly when they (had to) cut dividends. Currently, balance sheets are in good shape and the risk of dividend cuts is low.
It is often said that the energy infrastructure sector is not impacted by commodity prices, but this is not indeed the case. This is currently rather an advantage than a disadvantage: the outlook for energy is good.
A great way to get exposure to this promising sector is the ALPS Alerian MLP ETF ( AMLP ).
Midstream MLPs
The oil and gas industry supply chain can be divided in three broad categories:
- Upstream,
- Midstream, and
- Downstream.
Upstream refers to the exploration, extraction, and production of oil and gas. This includes activities such as drilling wells, hydraulic fracturing, and offshore platforms.
Downstream involves the refining and marketing of petroleum products. It covers the production of refined products such as gasoline, diesel, and petrochemicals, as well as the distribution and marketing of these products. Downstream activities also include the operation of retail fuel stations, petrochemical plants, and distribution centres.
Downstream involves refining oil and gas into consumable products and delivering them to end users.
Midstream connects the upstream with downstream. These companies own and operate the pipelines, storage facilities and processing plants.
Midstream can be divided in three sub-sectors:
- Gathering and processing,
- Transportation, and
- Storage and terminals.
Figure 1 gives more details about those three sub-sectors and confirms the traditional view of the midstream sector: the yields are high and the commodity linkage is low. Midstream companies get paid by the amount of oil they are transporting through their pipelines no matter what the price of oil is at that moment or how volatile the oil price is.
Figure 1: Midstream sub-sectors (Meteka)
In these inflationary times it's worth noting that midstream companies work with long-term contracts that often have built-in inflation adjustments.
Master Limited Partnerships (MLPs) are a type of business structure that combines the tax benefits of a partnership with the liquidity of publicly traded stocks. MLPs are typically involved in the energy sector, such as pipeline companies, and they generate income from natural resources such as oil and gas.
MLPs tend to have high dividend yields due to the fact that they are required to distribute a significant portion of their profits. This structure allows MLPs to minimize their tax burden and pass on the savings to investors in the form of higher yields. Additionally, MLPs often operate in energy-related industries, such as oil and gas production and transportation, which tend to generate stable cash flows that support consistent dividend payments. It comes as no surprise that MLPs are quite popular among income-oriented investors. But this hasn't always been the case.
Midstream Boom and Bust
In 2014 President Obama declared that "for the first time in nearly two decades, we produce more oil here in the United States than we buy from the rest of the world." This boom in energy production had its consequences on the midstream sector.
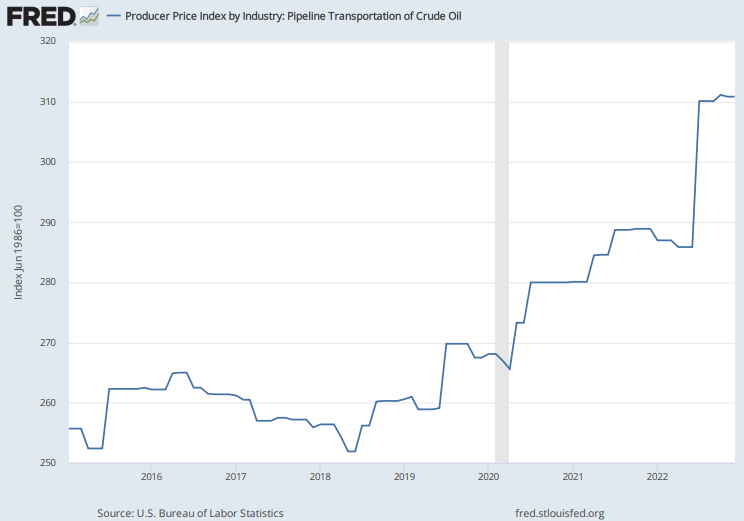
Total pipeline capacity expanded 42% from 2006 to 2017. But as always, more competition drove prices down. The massive expansion of capacity, driven by massive investment in new pipelines, caused the price of transporting oil to stagnate between 2015 and 2020.
Figure 2: Producer Price Index by Industry: Pipeline Transportation of Crude Oil [FRED]
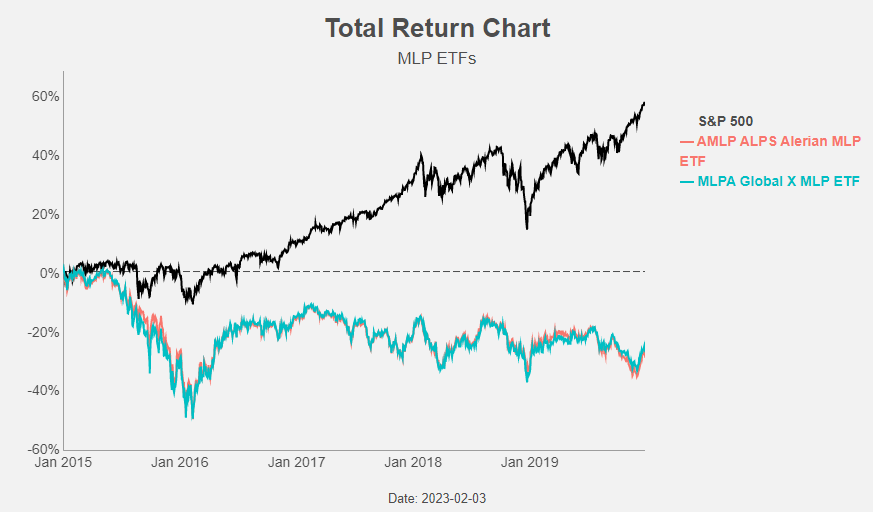
In the same period the (total) returns of MLPs were very meagre. Many MLPs had to cut their dividends and this disappointed many investors.
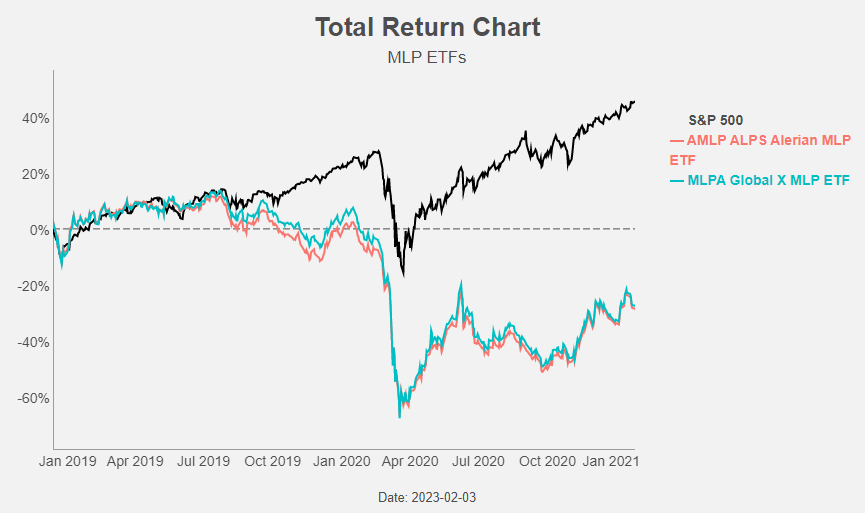
Also the onset of the pandemic, crashing energy markets, and significant uncertainty led to another round of dividend cuts in 2020 and again a very bad performance for MLPs.
Of course this period of over-investment was followed by a period of low capex. US Midstream capex halved in 2020 and is expected to remain on those lower levels for the foreseeable future.
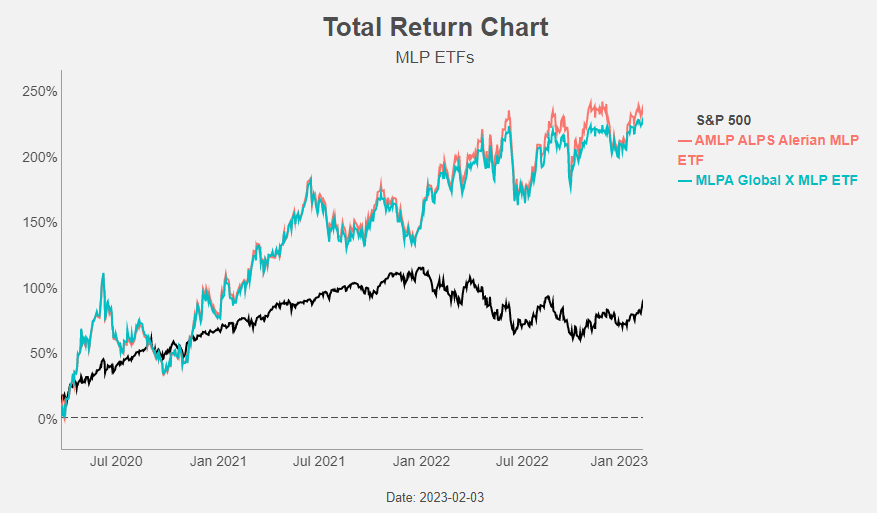
This lower capex has improved returns for investors. Since the start of the Covid-crisis MLPs have outperformed the S&P 500.
Capex discipline
Midstream companies are considered to have a low commodity linkage. They get paid by the volumes they are transporting through their pipelines no matter what the price of oil is at that moment or how volatile the oil price is.
But, is this really the case? Pipeline volumes might in the short term be unaffected by swings in energy prices, but in the longer term the transported volumes depend on how much oil is drilled. And the amount of oil that is drilled depends of course on the price of oil.
This higher than assumed link with energy commodity prices is not necessarily a bad thing in our eyes because we are positive on the energy sector.
Capex discipline is not only present in the midstream but in the whole energy sector. The ongoing underinvestment in exploration and production leads to a lower supply for years to come and this will support energy prices.
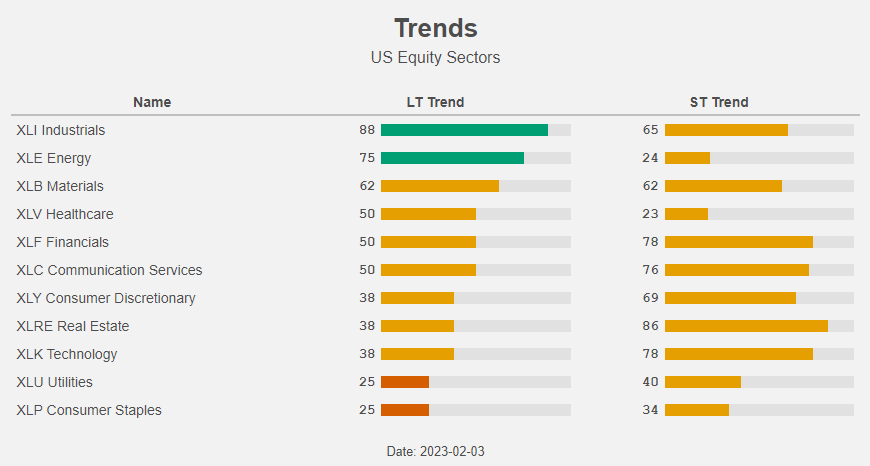
Despite a fairly low oil price, the energy sector remains one of the equity sectors in a long term uptrend (together with Industrials).
The lower capital expenditures also have a positive impact on the free cash flow generation of midstream companies This creates room for on the one hand the reduction of leverage and on the other hand for dividends and/or buybacks. And, most importantly maybe, the risk of dividend cuts is very low going forward.
Figure 7: US Midstream Capital Allocation (Brookfield)
Valuation
The strong free cash flow generation and the expected juicy dividends and buybacks are major trump cards for midstream companies, but what about the valuation?
MLPs are cheap relative to their own history and compared to e.g. REITs and Utilities.
Figure 8: Valuations (Global X)
And when we compare the dividend yield of MLPs to other income oriented sectors, like bonds, REITs and utilities, they come out on top.
Figure 9: Dividend yields (SS&C ALPS Advisors)
The Alerian MLP Infrastructure Index (AMZI) and Alerian Midstream Energy Select Index (AMEI) are the underlying indexes for AMLP and the Alerian Energy Infrastructure ETF ( ENFR ) respectively.
AMLP
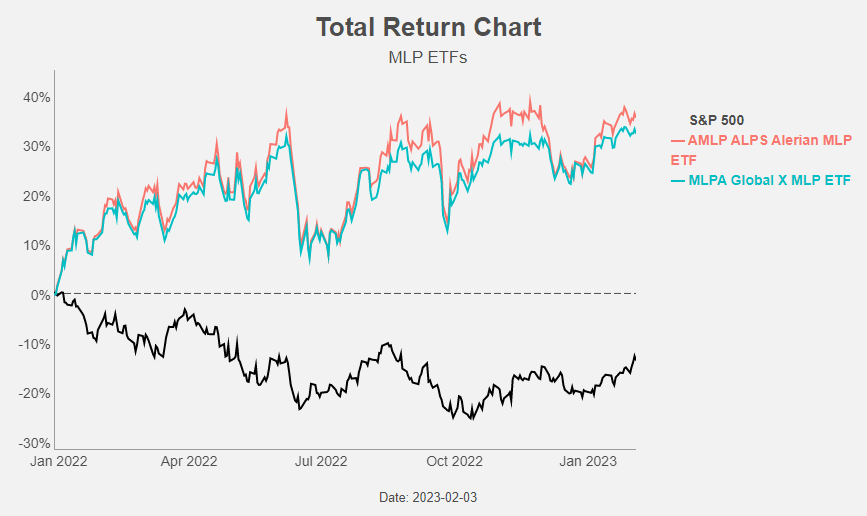
Our favourite MLP ETF is the ALPS Alerian MLP ETF.
Despite a higher expense ratio (0.87% vs 0.45%) AMLP is outperforming the Global X MLP ETF ( MLPA ).
All of AMLP's holdings are also part of MLPA. So, it seems that the additional names in MLPA are not really adding to the performance.
AMLP has also a slightly higher dividend yield (7.24% vs. 7.12%).
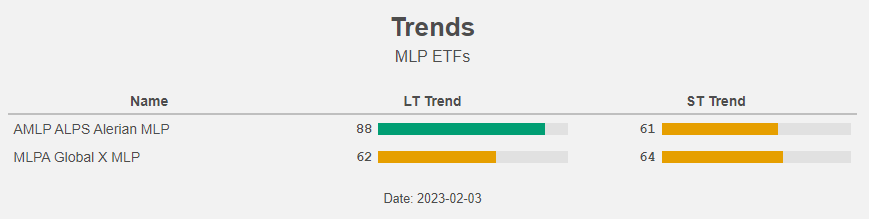
And the long term trend is also looking better for AMLP compared to MLPA.
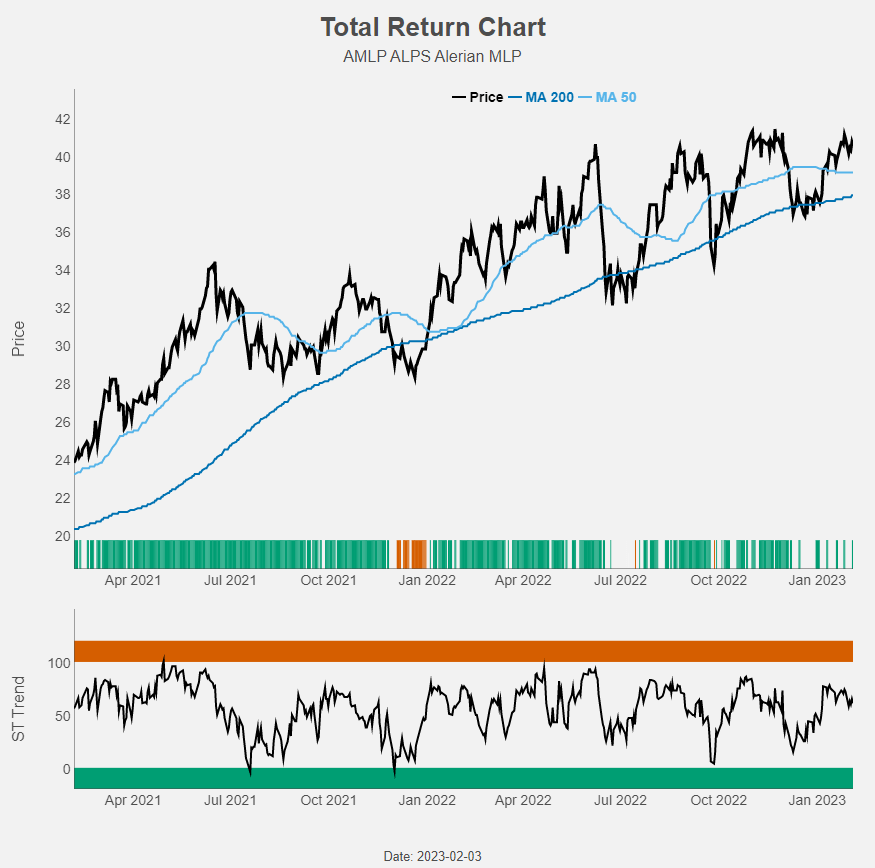
When the LT trend is clearly up, we get a green light/colour. Vice versa, when the LT trend is clearly down, we see a red light/colour. In between the colour is orange.
The ribbon in the price-part of the chart shows the LT trend-colour, while the lower part of the chart shows the ST trend. We left out the orange colouring to avoid overloading the chart.
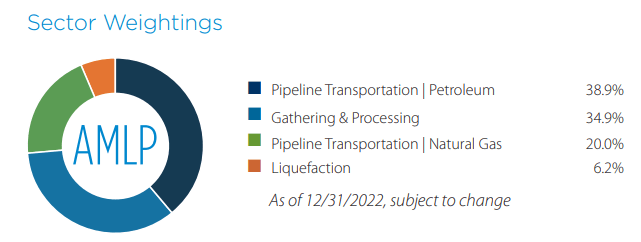
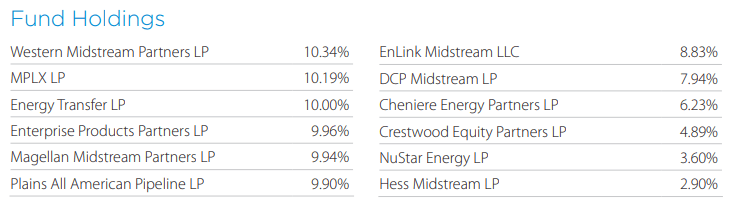
Below you can find the top 10 holdings and the sector weights to get an idea what's inside the ETF.
Conclusion
Low capex in the midstream energy sector are again leading to higher transportation costs. This results in strong free cash flow generation and higher dividends and buybacks in the coming years.
In the past MLPs performed badly when they (had to) cut dividends. Currently, balance sheets are in good shape and the risk of dividend cuts is low.
The low capex in the upstream sector are supportive of energy commodity prices. This is important because the linkage between midstream companies and commodity prices is higher than generally assumed.
Our preferred ETF in this promising sector is the ALPS Alerian MLP ETF: buy and enjoy the ample shareholder return!
For further details see:
AMLP: Ample Shareholder Value