AMEH - Apollo Medical: Struggling To Turn Incremental Capital Into Market Value
2023-05-18 13:17:24 ET
Summary
- Apollo Medical's top-line growth is once again commendable, underlined with performance across the portfolio.
- This hasn't pulled to the gross or operating lines however, and there's just 7% of revenues backed by OCF.
- Capital allocation decisions haven't yielded positive returns above the hurdle rate, adding to investor frustration.
- Net-net, reiterate hold.
Investment Summary
The investment case for Apollo Medical Holdings, Inc. (AMEH) remains balanced and thus supports a hold rating on the company in my opinion. Despite a strong top-line performance in Q1 FY'23 this didn't carry vertically down the P&L nor onto cash earnings. Further, adding to the last AMEH publication, namely: "[I] see flat earnings growth for AMEH into FY23, caused by rising OpEx and the macroeconomic climate", findings from the most recent AMEH analysis corroborate these similar headwinds going forward. The market has repriced AMEH off FY'22 highs and investors have agreed with the $1.6–$1.7Bn range in market cap, evidenced by the flat trading range since June last year.
Net-net, I continue to rate AMEH a hold until catalysts to price change emerge. I believe the market has baked in all of the company's forward expectations accurately at the current market value.
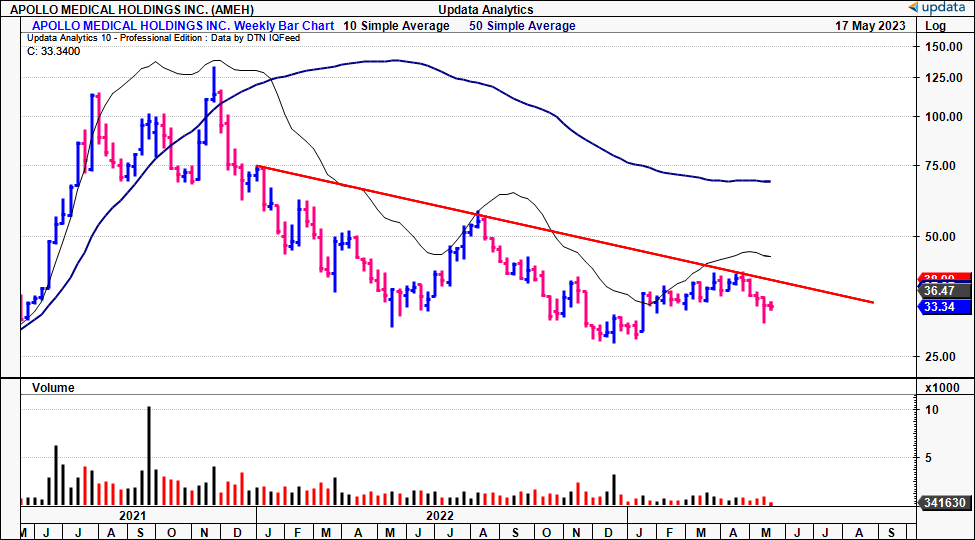
Fig. 1 – AMEH long-term downtrend
First quarter – economic pressures continue
AMEH continues growing its top-line at a reasonable cadence, underlined by incremental investments in infrastructure, technology and human capital. Q1 revenues came in 28% up YoY to $337mm on ~$30mm in adj. EBITDA. Growth was underscored by the care partners segment, yet its care enablement business also performed well. Unfortunately, as you will see here today, these growth numbers weren't conducive to shareholder value in my opinion. First, to the quarterly numbers:
1). Divisional Breakdown
Care enablement ("CE") revenues lifted 400bps to $30.6mm, contributing 8.9% to the top-line. As mentioned, the upside was contained at the top-line:
- CE operating income slipped ~50% YoY to just $5.7mm ($0.12/share). AMEH put the collapse to capital allocation decisions, citing investments into growth investments, preparing the firm to take on global management risk contracts.
- You can expect a few points of fees to control these contracts as well, adding further to the already tight margin pressures. At the 16% trailing gross margin, this is already an ask for CE at just $4.8mm in quarterly gross for the CE division. It also finished the quarter with 1.3mm managed lives, with ~50% of these pooled within its care partners ("CP") business.
Speaking of the CP segment, it drove the bulk of upside in Q1 and grew 30% YoY to $315mm. This appeared to be organic with contributions from membership growth and a more favorable payer mix. Unlike CE, the company booked ~28% growth in operating income to $22mm. This looks to be the key growth segment going forward, because the firm can manage its medical loss ratio and variable costs as revenues grow. AMEH also booked 25% growth in its care delivery ("CD") segment, with a $25mm print in turnover that pulled to $1.1mm in operating loss.
2). Earnings quality, gross capital productivity, cash flow/burn
As the top-line ratchets higher, the degree of operating cash flow and gross margin underneath these revenues is dwindling. Figure 2 illustrates both the cost of AMEH's revenues and gross profit margin each quarter on a rolling TTM basis. The firm's operating cash flow is then calculated and shown against turnover each period, shown as a percentage.
As shown, both gross margin and OCF backing revenues have tracked lower since 2021, as the cost margin stretches up to c.84% of trailing revenues. That is big and illustrates one key point that AMEH bulls may be overlooking, and that's the company's ability to make money, both on the income and cash side. In my opinion, the numbers suggest AMEH has a large job ahead of itself to turn the situation around, for multiple reasons:
- One, only 7.4% of trailing revenues were backed by OCF in Q1, in-line with the previous quarter. Longer-term (2-years), the range is 7–10%, and this is not a fantastic number in my opinion. I'd be looking more to the 15–20% range to evidence AMEH could hold a reasonable FCF margin – unsurprisingly, just 6.4% in the TTM.
- The gross productivity on AMEH's asset base suggests it needs to make up headroom to create value on its capital investments. This is an important point. The company is capital dense, but not capital intensive – 1.5x capital turnover in Q1. We've also got $560mm in equity holding up $992mm in assets at the time of writing. You'd expect this to drive a higher ROIC and market valuation, but it's not the case, because the income doesn't pull down below the top-line (remember those 84% cost margins from earlier). Alas, the rolling average of AMEH's gross ROA has crested along $0.19–$0.21 for each dollar put to work in the firm's productive assets. This isn't a high number, and reflects the c. 16–18% gross profit margins from revenue. But more importantly, if it sees just $21 in gross, from the income it generates, it is difficult to see this translating to additional market valuation over time in my opinion. The market would be looking to at least a 1:1 ratio in gross profitability to assets in my estimate.
Fig. 2
Fig. 3
Second, to the economic characteristics of the business. The market rewards companies in situations where capital is more valuable in their hands versus the general investor's. If you're committing capital to a firm's equity you want it to appreciate with the valuation of the business. But investors will typically only pay a higher multiple when the value of $1 is less valuable in their hands than parked in a company's common stock.
It boils down to capital allocation. The value of $1 is quite easy to track across the tenor of a bond, for example. Similar in commodities, thanks to demand/supply and futures markets. Less so in equities though. Still, if you can get 12% by investing in benchmark instruments (long-term market returns), you'd expect the next best opportunity in your playbook to be generating that kind of return.
Capital is valuable in a firm's hands when it can generate high economic earnings. In the investors eyes, the company is simply a conduit between the equity value (assets – liabilities), and the investors, owners of the equity value. Hence, as the 'owners of the business', you best hope your business is producing returns on its own (i.e. "your") capital, in order to attract further investment and higher market valuations. High economic earnings means a firm can put funds at work into various new growth opportunities, and generate return on these investments above the 12% hurdle rate. That way, the value of $1 is higher in the company's hands than in the investors.
Slippage in this domain is a key leakage in the investment value of AMEH in my opinion. Figure 4 tracks the value of $1 in both AMEH's hands and a hypothetical investor's, getting the 12% hurdle rate return, from September 30, FY'20 to the date of writing.
Whereas for the investor, $1 compounds each period, it fluctuates for AMEH given the variance in its ROICs [Figure 5]. As you can see, from 2020-mid 2022, the trajectory was quite similar, however, began to diverge last year, amid the pullback in economic earnings and gross profitability. This is key to the market's re-valuation of AMEH to the downside, in my opinion. It is difficult for AMEH to command investment when it is unable to compound profits from the capital invested in the business, (i.e., the "owner capital") above the hurdle rate. There is no desire to accept further risk and deviate from the benchmark without the additional upside potential.
Fig. 4
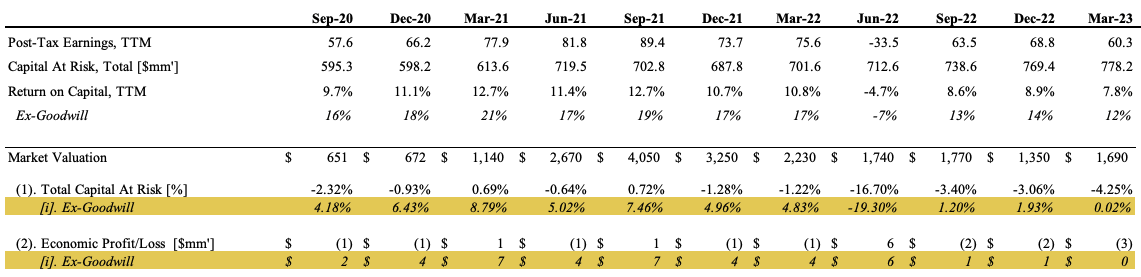
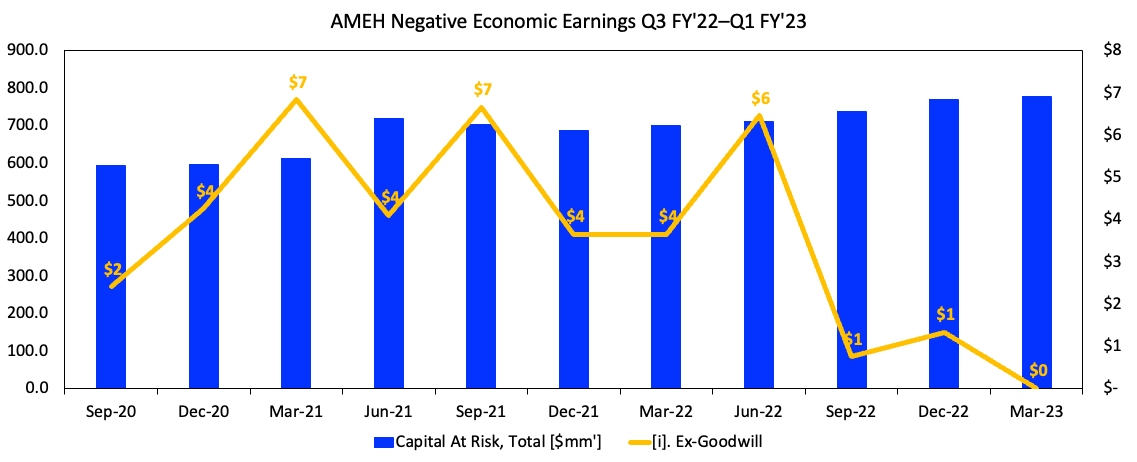
Further analysis of this same data is observed in Figure 5 and Figure 6. Here, the company's total capital at risk is shown along with corresponding price delta, and economic earnings on a rolling TTM basis. Also shown, is the post-tax earnings produced on capital at risk including and excluding goodwill. The dollar economic earnings (profit or loss) is calculated as the economic profit/loss in percentage multiplied by the NOPAT produced.
You can note that, across the entire testing period, economic profits have been thin and/or absent for the company. The same is true even when reconciling for goodwill. Specifically:
- AHEM generated a $4mm net economic loss on its investments over this period, a 5% loss on a $90mm incremental investment.
- This fits with the broader set of findings that AMEH hasn't managed to create value for shareholders despite its strong top-line growth.
Intelligent investors aren't going to be attracted to a $1mm in value add when their company is investing north of $770mm and more each quarter. Not in my best estimation, and not when there's so many other selective opportunities available. In my opinion, this aligns with what we've seen from the market in pricing AMEH last 2-3 years. It will accurately prescribe fair value over time in my opinion. Hence, to see AMEH rate lower over 2-years with no recovery is telling.
Fig. 5
Fig. 6
Valuation
Irrespective of one's viewpoint, being asked to pay 25x forward earnings commands an impressive resume from the company applying for our investment. That is $25 for every $1 in earnings – you would want growth, high earnings yields, consistency, and tremendous value-add for every $1 you put at risk. Mind you this is a 33% premium to the sector as well. Unfortunately, I'm not seeing these kind of factors on offer here. Sure, the market has priced AMEH at 2.8x book value, which may or may not be a representation of value. In support, tangible book value has increased 390% for the company since Q4 FY'20, along with 46% gain in total book value.
At AMEH's current $1.59Bn market cap at the time of writing, the market estimates $190mm in post-tax earnings from AMEH, presuming the 12% discount rate ($190/0.12 = $1,583). This is not too far a stretch from the current numbers, but doesn't suggest the market is expecting tremendous growth potential, around 13% CAGR in post-tax earnings over the next 5-years, getting you to the $1.59Bn today (($100x1.13^5)/0.12 = $1,580). To me this doesn't suggest investors will reward AMEH any time soon with higher market valuations. It is already priced at a premium, and hasn't attracted bullish investment for some time now. I believe the $1.6Bn market cap may accurately capture the forward expectations, and this supports a hold. Net-net, reiterate hold, with $30–$35 the price target range.
For further details see:
Apollo Medical: Struggling To Turn Incremental Capital Into Market Value