ARCC - Ares Capital Vs. Blue Owl Capital: One Has The Edge
2023-11-28 12:49:57 ET
Summary
- Ares Capital and Blue Owl Capital are two of the largest BDCs with dividend yields of nearly 10%.
- OBDC has a higher NII coverage ratio than ARCC, giving it more scope to pay special dividends.
- OBDC's portfolio has a smaller percentage of underperforming investments compared to ARCC, indicating a somewhat lower risk of rising non-accruals.
Ares Capital ( ARCC ) and Blue Owl Capital Corporation ( OBDC ) are two of the largest business development companies [BDCs] and both offer dividend yields of nearly 10%. They also both offer reasonable net investment income [NII] coverage ratios suggesting that their dividends remain safe and are unlikely to be cut. However, OBDC has seen a much higher NII coverage ratio than ARCC in 2023 which has given it more scope to pay special dividends. This leads me to favor OBDC over ARCC from a dividend perspective.
I also slightly favor OBDC from a portfolio outlook perspective. While both BDCs have solid investment portfolios, a much higher percentage of ARCC’s underlying investments are performing below expectations than at OBDC. This leads me to conclude that ARCC is currently facing a somewhat greater risk of rising non-accruals than OBDC. Furthermore, In terms of valuation, ARCC trades at a slight premium to NAV, while OBDC trades at a slight discount. OBDC's discounted valuation, growing dividend, and NAV per share make it a slightly preferred choice over ARCC.
Their portfolios and balance sheets
ARCC and OBDC are primarily debt focused BDCs with more than 80% of each of their respective portfolios being made up of debt investments. However, there are quite a few variations in the composition of their portfolios. In the case of OBDC, around 69% of its portfolio is made up of first lien senior secured debt and a further 14% in second lien senior subordinated debt.
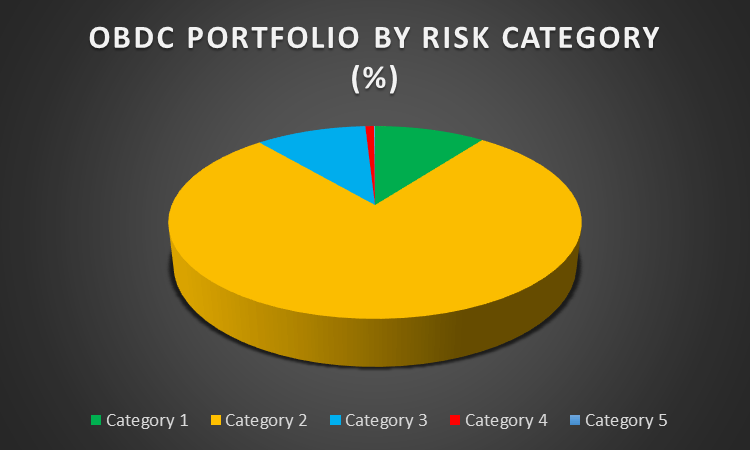
The majority of OBDCs debt portfolio is categorized as category 2 in terms of its internal risk rating. Debt investments assigned this rating are generally performing as expected. However, in recent quarters there has been a decline in investments rated in category 1. OBDC has seen four consecutive quarterly declines in the percentage of its portfolio in category having gone down from 12.6% at the end of 2022 to 10.3% in its most recent quarter. In the case of category 1 loans the borrower is performing significantly above expectations.
Author created based on data from company filings
While the decline in category 1 loans as a percentage of the portfolio is worth monitoring it does not give rise to substantial concern. In fact, the decline in category 1 loans is to be expected as borrowers are increasingly exposed to higher interest expense considering that around 98% of OBDCs portfolio is a floating rate portfolio. In my view, its more surprising that such a large portion of OBDC’s portfolio has remained in category 1 despite the substantial rise in interest rates over recent quarters.
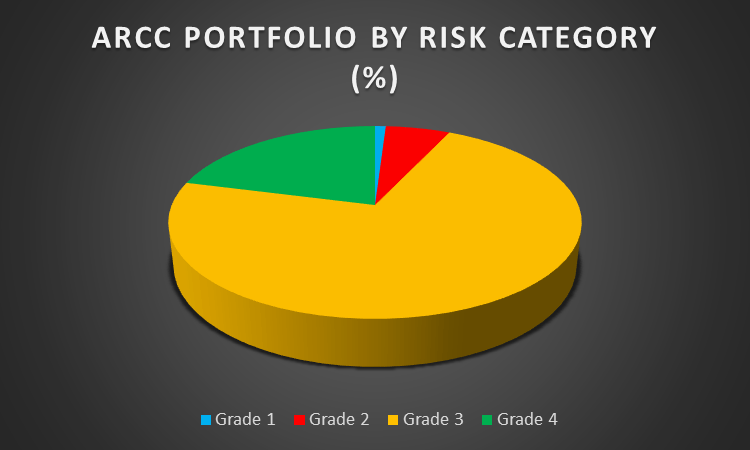
In the case of ARCC, around 43% of the portfolio is composed of first lien senior secured debt and a further 22% in second lien senior subordinated debt. Around 72% of ARCC’s portfolio is rated as Grade 3 in terms of its internal risk rating. This risk rating is assigned to borrowers who are performing in line with the BDCs expectations at the time of origination. This also signals that there are no concerns in respect of the bulk of ARCC’s portfolio at the moment.
Author created based on data from company filings
However, the percentage of its portfolio rated as Grade 2 gives rise to some cause for caution. The BDC assigns a risk grade of 2 where there has been a substantial rise in the risk of recovering the initial investment cost since its origination or acquisition. This increase in risk may be attributed to factors like deteriorating performance and failure to adhere to debt covenants. Nevertheless, payments are typically not overdue by more than 120 days. The portion of ARCC’s portfolio rated in this category has remained fairly constant in the past three quarters but still merit close attention given the increased risk associated with these investments.
Despite these concerns, the percentage of ARCC’s portfolio rated in grade 4 is particularly promising. This category represents the least amount of risk, and the underlying company has generally exceeded expectations. With more than 20% of ARCC’s portfolio in this category, it is clear that the bulk of its investments are performing in line with expectations at the time of origination or acquisition and in a large number of cases is exceeding those expectations.
Despite ARCC having a greater number of portfolio companies performing above expectations, I rate OBDC slightly higher in terms of portfolio outlook. A much smaller portion of OBDC’s portfolio companies is performing below expectations than at ARCC. The risk of rising nonaccruals at ARCC appears much higher than at OBDC with a fairly substantial portion of its portfolio in Grade 1 where the underlying companies are performing much worse than expected
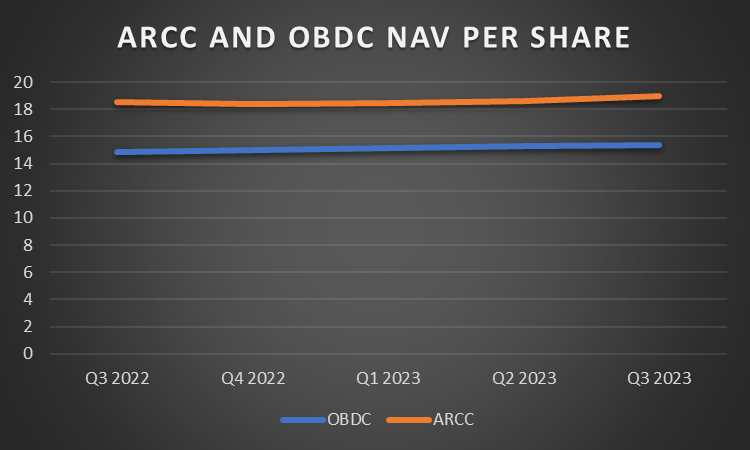
Both ARCC and OBDC have a history of growing their NAV per share in the longer term. ARCC saw a decline in NAV per share in the fourth quarter of 2022 but these declines were over a single quarter and within two quarters NAV had again exceeded the NAV per share value seen prior to the decline in the fourth quarter of 2022. This decline in NAV per share was driven by mark-to-market losses as the fair value of some investments had to be adjusted downwards amidst much higher than usual spreads and volatility in fixed income markets.
Author created based on data from company filings
These declines were not unique to ARCC and were indeed experienced by several other BDCs which I have covered such as Gladstone Capital ( GLAD ). The single quarter of NAV declines at ARCC is not accordingly a material factor in my evaluation of the stocks. While it may appear from the chart that these factors did not impact OBDC, this would be incorrect as OBDC (or ORCC as it then was) saw declines in NAV per share in the second quarter of 2022. At the time its management noted that –
Our NAV per share was $14.48 versus our first quarter NAV of $14.88. This was largely driven by the decline in share value of our portfolio due to market adjustments from the impact of wider credit spreads.”
Much like ARCC, OBDCs NAV per share has fully regained this temporary decline in NAV per share and exceeds the high NAV per share prior to these declines. The ability to grow NAV per share is important in the context of BDCs as investors are not generally willing to pay a premium to NAV for a BDC with a declining NAV per share. In my view, OBDC and ARCC are equals in the NAV growth category and I do not rate either BDC higher than the other on this basis.
The safety of the dividends
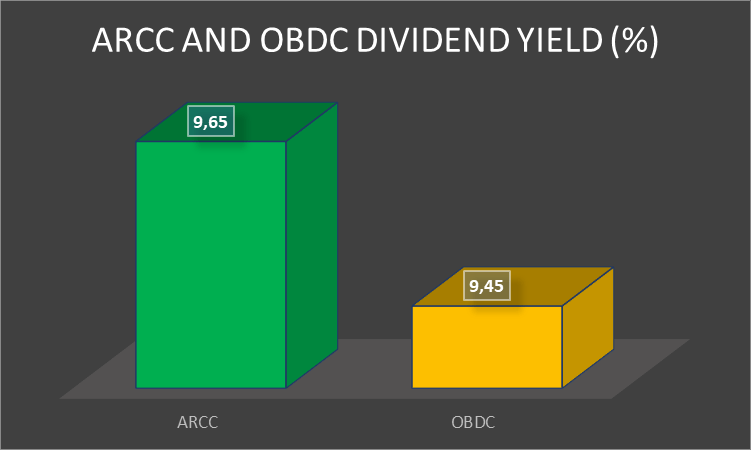
ARCC currently offers a dividend yield of 9.65% while OBDC offers a dividend yield of around 9.45%. The difference in the yield is minor and does not in itself give rise to a preference for either of the BDCs. However, when factoring in special dividends OBDC would obtain a slight edge as it has declared multiple special dividends in 2023 while ARCC has not declared any special dividends for 2023.
Author created based on data from BDC Universe
In the third quarter OBDC also reported net investment income [NII] per share of $0.49 which was well above the regular quarterly dividend of $0.33 (now increased to $0.34 per share). If the special dividend of $0.08 per share is factored in OBDC still reported an NII coverage ratio of more than 114% and without factoring in the special dividend the NII coverage ratio for the third quarter was around 140% showing that there is still substantial scope for further special dividends. The case for further special dividends is also supported by the recent statements made by management in its earnings call in which it was said that –
For the fourth quarter of 2023, our board has increased our regular dividend to $0.35 per share, which we believe is still a very comfortable level relative to our earnings power, and we expect to continue to declare and pay supplemental dividends quarterly to provide further distributions to shareholders .”
ARCC on the other hand reported NII per share of $0.52 per share, which was also comfortably above its quarterly dividend per share of $0.48 per share. This means that in the third quarter of 2023 ARCC’s dividend coverage ratio stood at around 108%. While this is a comfortable dividend coverage ratio it leaves much less scope for special dividends at ARCC than at OBDC at the moment.
Author created based on data from BDC Universe
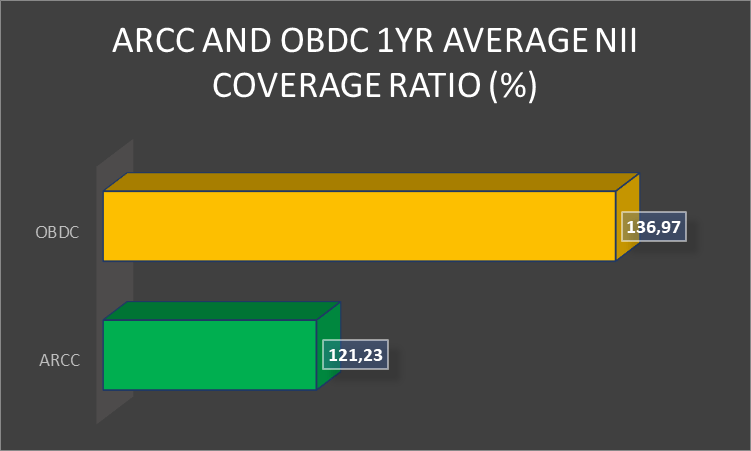
OBDC’s one year average NII coverage ratio at around 137% is also much greater than the 122% witnessed at ARCC. This leads me to conclude on the dividend front that while both BDCs have solid coverage, OBDC is the dividend leader for now. It has much greater scope than ARCC at the moment to continue paying special/supplemental dividends and is more likely to increase its ordinary dividend in the near term. The high NII coverage ratio also provides OBDC with a more comfortable earnings buffer should rates decline and bring about lower NII for debt focused BDCs such as ARCC and OBDC.
Valuation
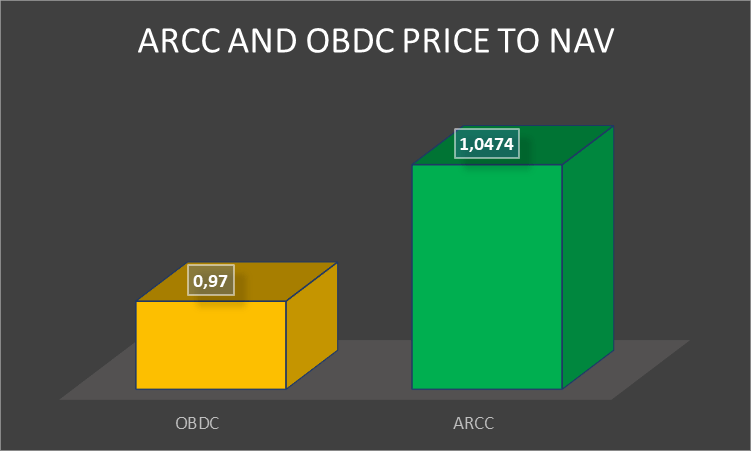
ARCC is currently trading at a slight premium to NAV of around 4.7% which is broadly in line its 3-year average premium to NAV of just over 5%. OBDC, in turn, trades at a slight discount to NAV of around 3% which is at a premium to its 3-year average discount to NAV of around 8%.
Author created based on data from BDC Universe
OBDC’s recent outperformance has likely contributed to the gradual rerating of the stock. Despite this rerating, it still offers an attractive entry point given that it has a growing dividend and NAV per share while the stock itself trades at a discount to NAV. This leads me to slightly prefer OBDC over ARCC from a valuation perspective even though I consider both to be trading at reasonable valuation levels.
Conclusion
ARCC and OBDC stand out as the two largest BDCs, both presenting attractive dividend yields of nearly 10%. While both BDCs maintain a predominant focus on debt investments, there are notable differences in the composition of their portfolios.
OBDC's portfolio is primarily comprised of first lien senior secured debt (69%) and second lien senior subordinated debt (14%). The majority of its debt portfolio falls under category 2 in terms of internal risk rating, indicating generally expected performance. However, there has been a decline in category 1 loans, reflecting a potential impact from increased interest expenses due to the predominantly floating rate nature of OBDC's portfolio.
On the other hand, ARCC's portfolio consists of 43% first lien senior secured debt and 22% second lien senior subordinated debt. While 72% of ARCC's portfolio is rated as Grade 3, signaling performance in line with expectations, a noteworthy portion is rated as Grade 2, indicating a substantial increase in the risk of recovering initial investment costs.
In terms of dividend safety, ARCC offers a dividend yield of 9.65%, slightly higher than OBDC's 9.45%. However, OBDC gains an edge with its declaration of multiple special dividends in 2023, reflecting a robust Net Investment Income coverage ratio. OBDC's NII coverage ratio is higher than ARCC's, providing more flexibility for special dividends.
Considering valuation, ARCC trades at a slight premium to NAV (4.7%), while OBDC trades at a slight discount to NAV (3%). OBDC's recent outperformance, its discounted valuation, growing dividend, and NAV per share make it a slightly preferred choice over ARCC. However, in my view, both these BDCs are trading at reasonable valuation levels. Nevertheless, while both ARCC and OBDC have their strengths and considerations, OBDC appears to have a slight advantage in terms of portfolio outlook, dividend safety, and valuation, making it a more favorable choice for me at the moment.
For further details see:
Ares Capital Vs. Blue Owl Capital: One Has The Edge