AMZN - Bank Of Nova Scotia Is Forming A Bottom And The 6% Yield Looks Enticing
Summary
- Shares of BNS look to have formed a bottom over the past several months.
- BNS has a dividend that can be traced back to 1933, and its 6.02% dividend yield is very enticing as its payout ratio is under 60%.
- BNS looks to be attractively valued compared to its peers.
I'm not currently invested in any Canadian Banks directly, but I track them with the big U.S. banks for my research since I'm a shareholder of Bank of America ( BAC ) and Citigroup ( C ). The Bank Of Nova Scotia ( BNS ) has been on my radar for some time, and its declining share price has created an interesting entry point. The dividend yield from BNS has been pushed to 6%, and this really caught my eye. I'm not necessarily interested in BNS for capital appreciation, but from a dividend perspective with prospects for capital appreciation, BNS fits within my investment profile. I have different portfolios for different investment goals, and from a capital appreciation aspect, I feel there are better opportunities to deliver market-beating returns, such as Amazon ( AMZN ) at its current level. When I look at BNS from a dividend perspective, its $3.11 dividend represents 52.62% of its current EPS, making the 6% yield well covered. Now that a bottom looks to have formed, I'm seriously considering dipping my toes in the water as BNS looks to be a good addition to my Dividend Harvesting Series on Seeking Alpha, and possibly my main dividend portfolio.
A bottom is forming in BNS and shares are looking attractive
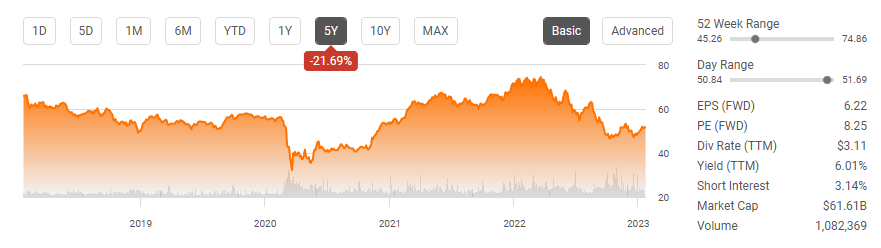
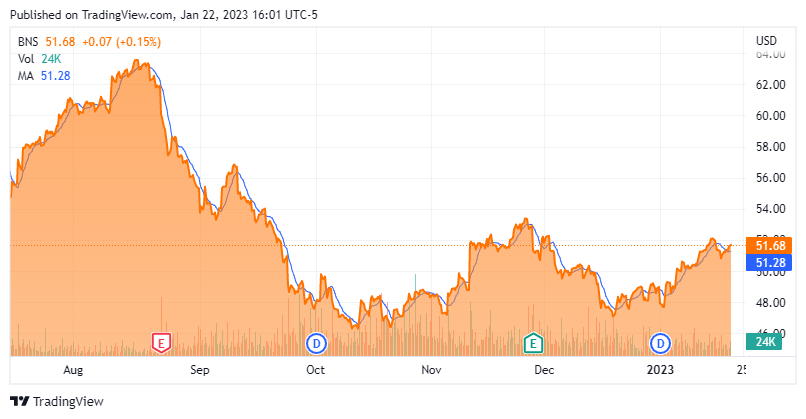
BNS reached a high of $74.86 around 3/21/22 and fell -36.24% over the next seven months as it closed at $47.55 on 10/21/22. Since then, BNS has been establishing a bottom as it trades in and out of the $50 level. Each time BNS approached the $45 - $46 level, it found support and bounced back into the $ 50's. I'm not much of a technical analysis person, and if you have read my previous articles, I'm much more interested in conducting a financial analysis on the income statement, balance sheet, and cash flow statement.
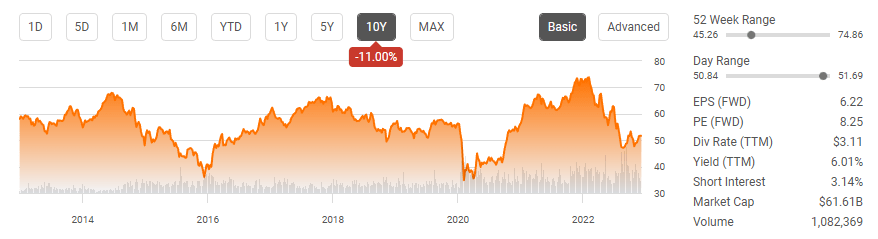
Looking back on BNS's 10-year chart, it suffered a -47.08% decline from 7/21/12 to 1/11/16, then recovered to $66.18 on 11/13/17. BNS was slowing declining into the covid-crash then dropped off a cliff with the market, retesting its 10-year lows in the mid to low $30s. BNS rallied to 10-year highs over the next two years as shares spent a small period of time exceeding $70.
By looking at the charts and knowing that this would be an investment geared toward income, I have to ask myself the following question. Would I be OK making an investment that trades relatively sideways, spending periods of time above and below my initial price, and after 10 years having the asset be down -11%? Before I answer, I want to explain that these are the questions I ask myself going into an investment, and what's right for me may not be right for anyone else, as my investment parameters fit my personal risk tolerance threshold. I would recommend that each investor establishes what they are comfortable with and have a clear set of investment parameters to judge potential investments by.
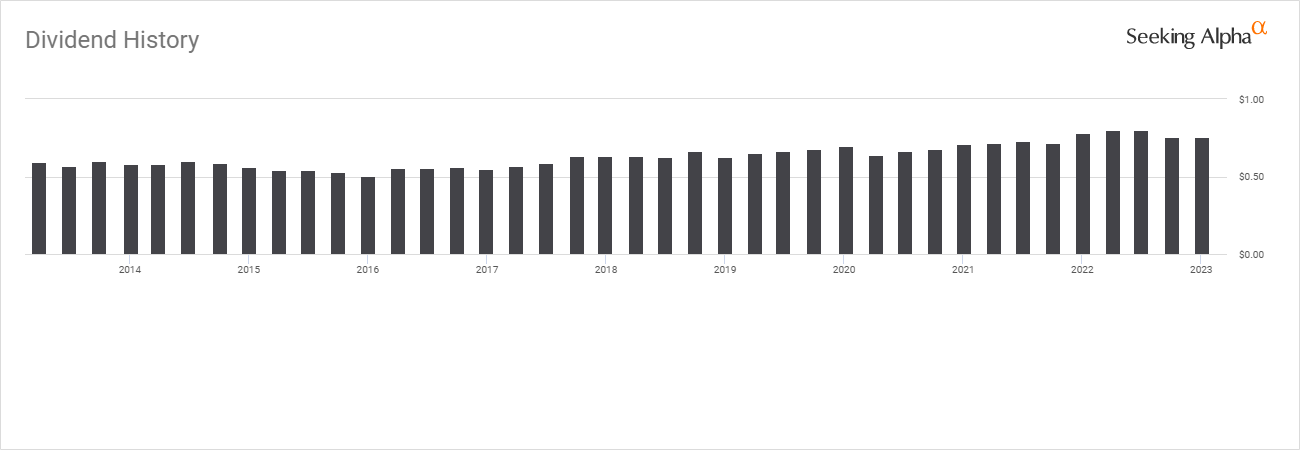
Since this is a dividend investment, I need to look at the dividend history. BNS declared its initial dividend in 1833 and has continuously made its dividend payments to shareholders. Over the past decade, BNS has paid $25.97 in dividends. If I had purchased 100 shares on 1/21/13, it would have cost me $5,806. Today the initial investment would be worth $5,167 for a loss of -$639 or -11%. Over this period, I would have generated $2,597 in dividend income. To save me a lot of work, I will assume that I took the dividends as cash. Today my net investment would be worth $7,764 ($2,597 of dividend income + $5,167 (100 shares)). Some people would rather just put their money in an index fund, and I wouldn't disagree with that idea as it's a great hands-off approach to investing. For me, I would be perfectly comfortable with the initial capital being down -$639 (-11%) to generate $2,597 of dividend income, especially since I would be reinvesting the dividends each quarter and benefiting from the powers of compound interest.
Looking at the 10-year chart and BNS's dividend history, shares at a 6% yield look very enticing. Taking a long-term approach, I would be very comfortable adding shares at this level, reinvesting the dividends, and if shares end up making new 10-year lows, dollar cost averaging into the position. With a dividend history going back to 1833, BNS has created an operational track record of financial stability that is almost impossible to replicate.
How BNS is valued compared to its peers
Since BNS is a bank, I have a different methodology of how I compare it against its peers. Here are the different metrics I will utilize and why I elected to use them:
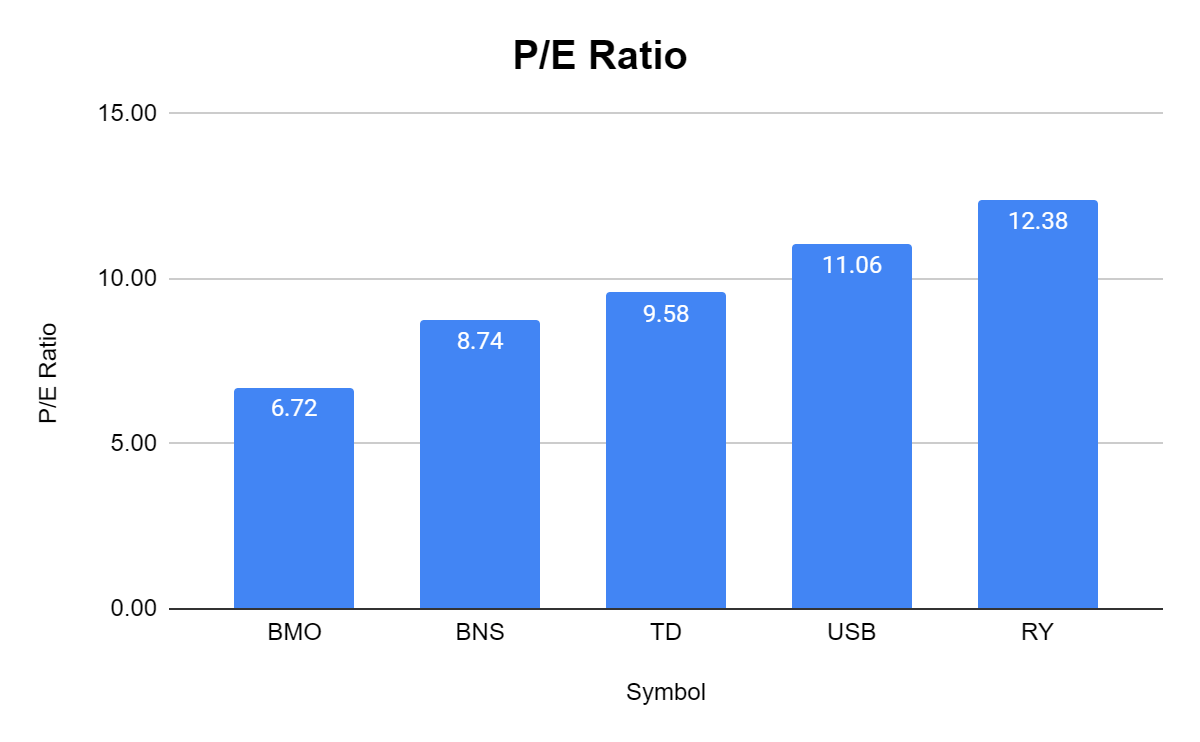
- Price to Earnings P/E
- A company's P/E ratio is important in comparison with similar firms in the same industry.
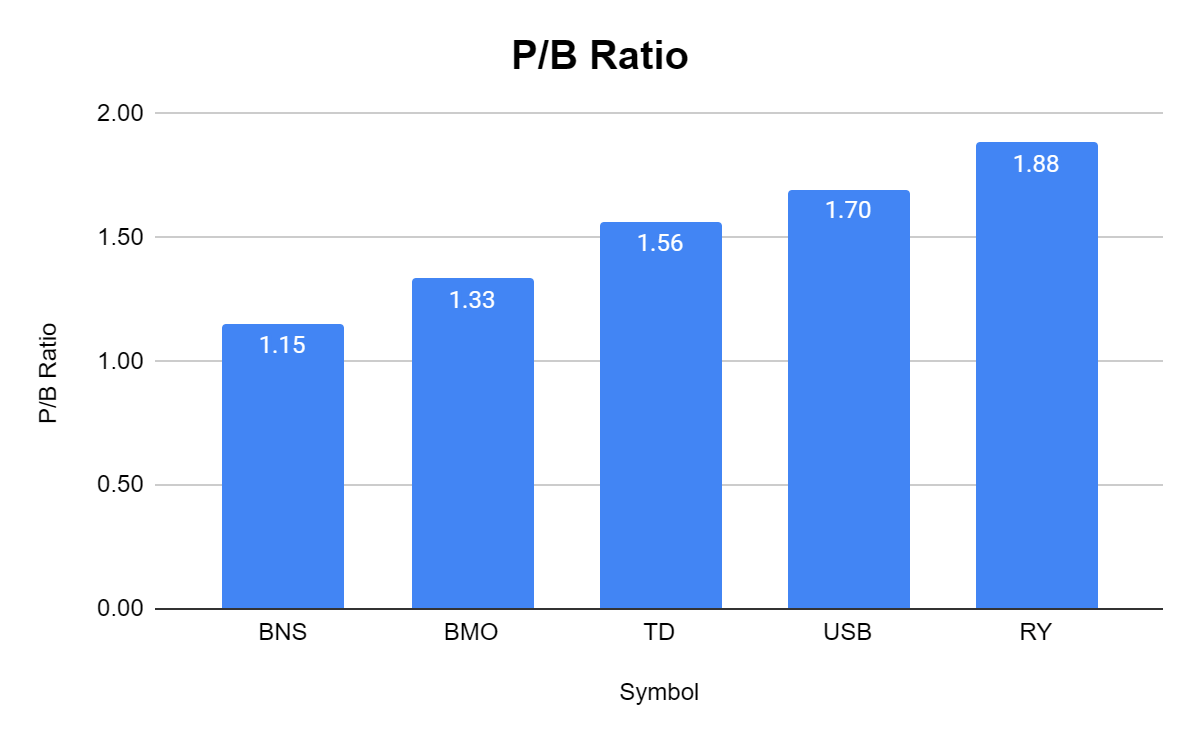
- Price to Book P/B
- P/B ratios are commonly used to compare banks because most assets and liabilities of banks are constantly valued at market values.
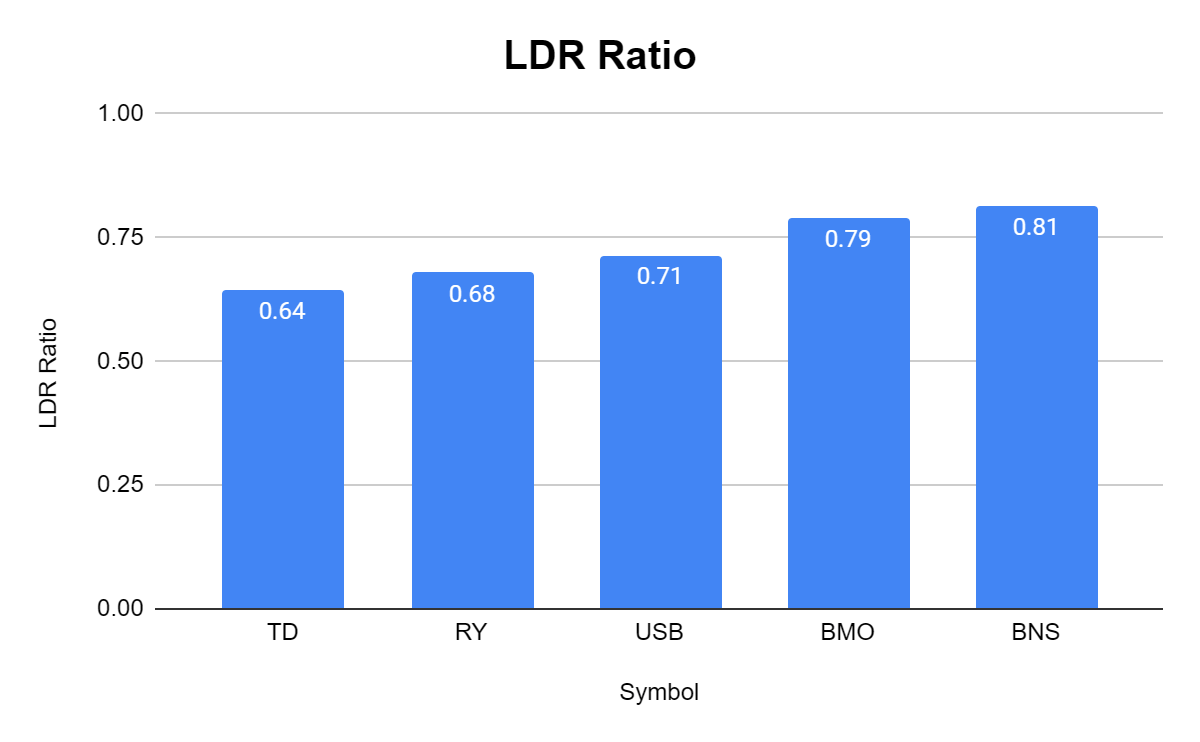
- Loan Deposit Ratio LDR
- Indicates the bank's liquidity.
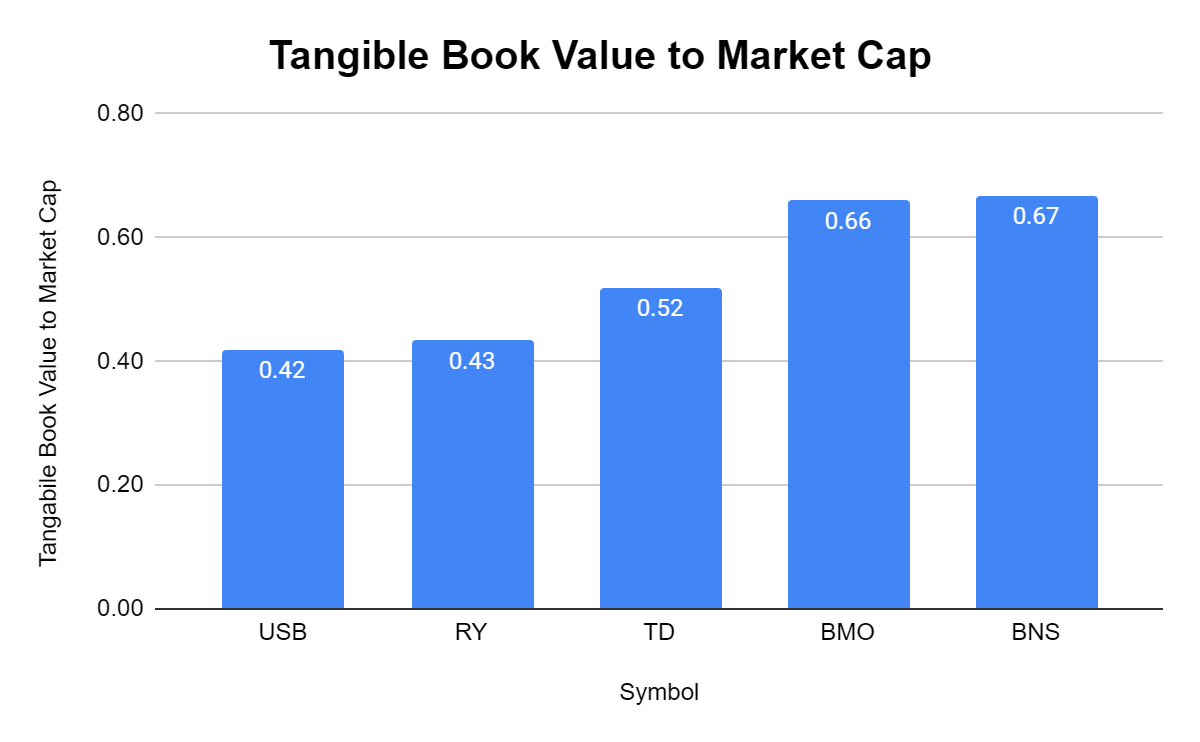
- Tangible book value to market cap
- Tangible book value excludes the value of intangible assets such as goodwill. Intangible assets such as goodwill are not as easy to liquidate as tangible assets, and even though they have value, I believe finding the tangible book value is a more realistic measure of a company's value. I wanted to see how the tangible book value compared to each company's market cap.
- Dividend Yield and Payout Ratios
- Amount of earnings each company pays per share through its dividend and how much of its earnings are paid.
- % difference between tangible book value and share price
- Indicates if the market is discounting a company's shares or placing a premium on them.
- Dividend Yield and Coverage Ratio
- Indicates how large of a dividend yield a companies shares generate and if the payout ratio leaves room for future increases, or if a company is overextending to pay a lucrative dividend
I will be comparing BNS to the following banks:
- Royal Bank of Canada ( RY )
- Toronto-Dominion Bank ( TD )
- Bank of Montreal ( BMO )
- U.S. Bancorp ( USB )
Currently, BNS trades at a P/E of 8.74, which is under the peer group average of 9.70. TD, USB, and RY all trade at a higher P/E, with USB and RY being in the double digits. From a P/E ratio, BNS looks attractive.
In addition to having the second lowest P/E, BNS has the second lowest Price to Book ratio. Currently, BNS trades at 1.3x book value, while TD, USB, and RY have been provided with P/B rations that range from 1.56 to 1.88.
The LTD ratio is critical in assessing a bank's liquidity. If this metric is too high, the bank may be susceptible to a bank run due to rapid changes in its deposits, meaning it may not have enough funds to cover its requirements. If the ratio is too low, it can indicate that a bank is not meeting its earning potential. BNS is the highest in the group, but its LDR ratio is 0.81. This leaves a decent amount of room between its loans and deposits, but I would like to see it closer to the peer group average of 0.73.
Many investors look at tangible book value per share, but I like to also look at tangible book value compared to market cap. Today, BNS has 67% of its market cap covered by its tangible book value, and this is the largest in the group. Bigger is better in this metric, and I like what I see.
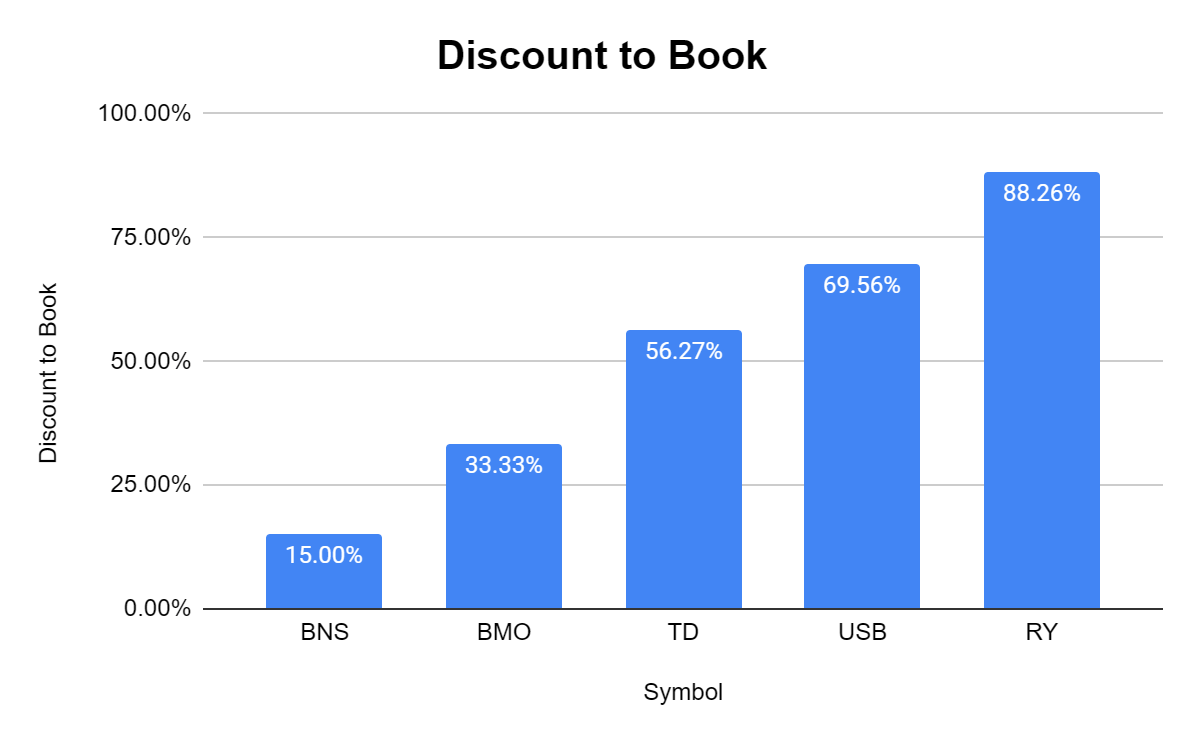
None of these banks trade at a discount to their book value. BNS trades at a 15% premium to its book value, while the peer group trades at an average premium of 52.48%. RY has a valuation that fetches an 88.26% premium.
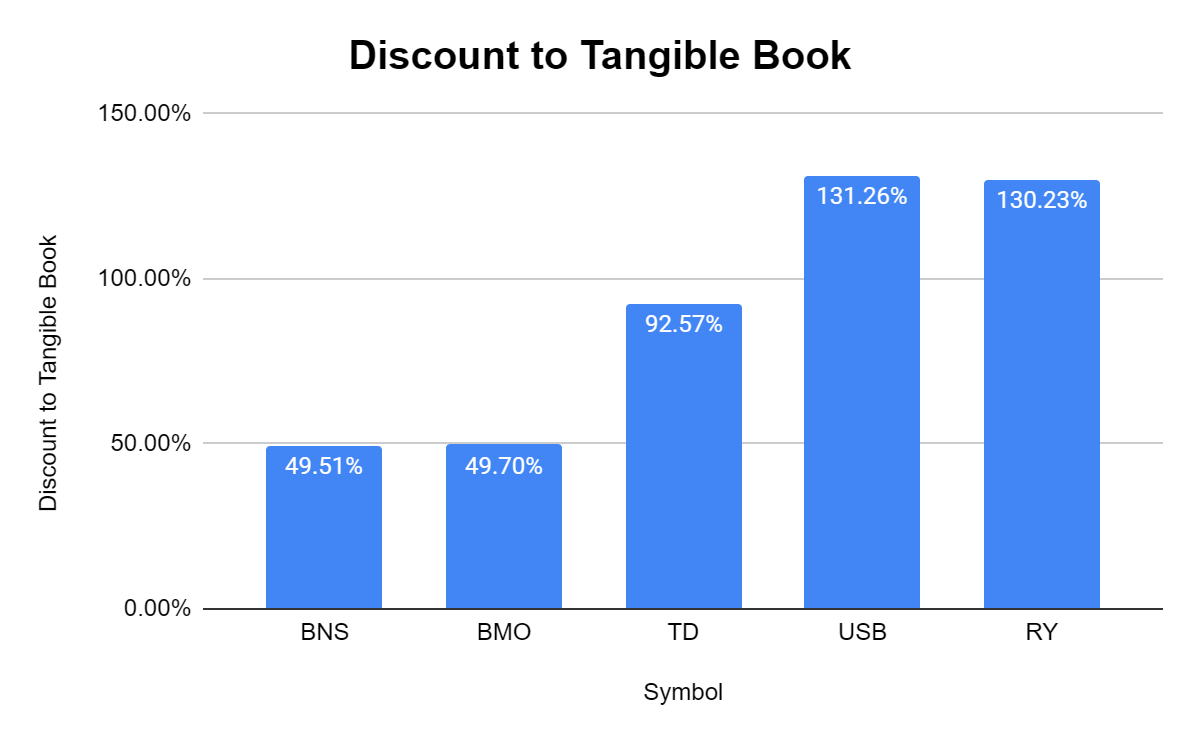
Tangible book value is a bit stricter than straight book value as it strips out intangible assets. BNS is trading at a 49.51% premium to its tangible book value compared to the peer group premium average of 90.66%. Both USB and RY trade at a premium that exceeds 100%.
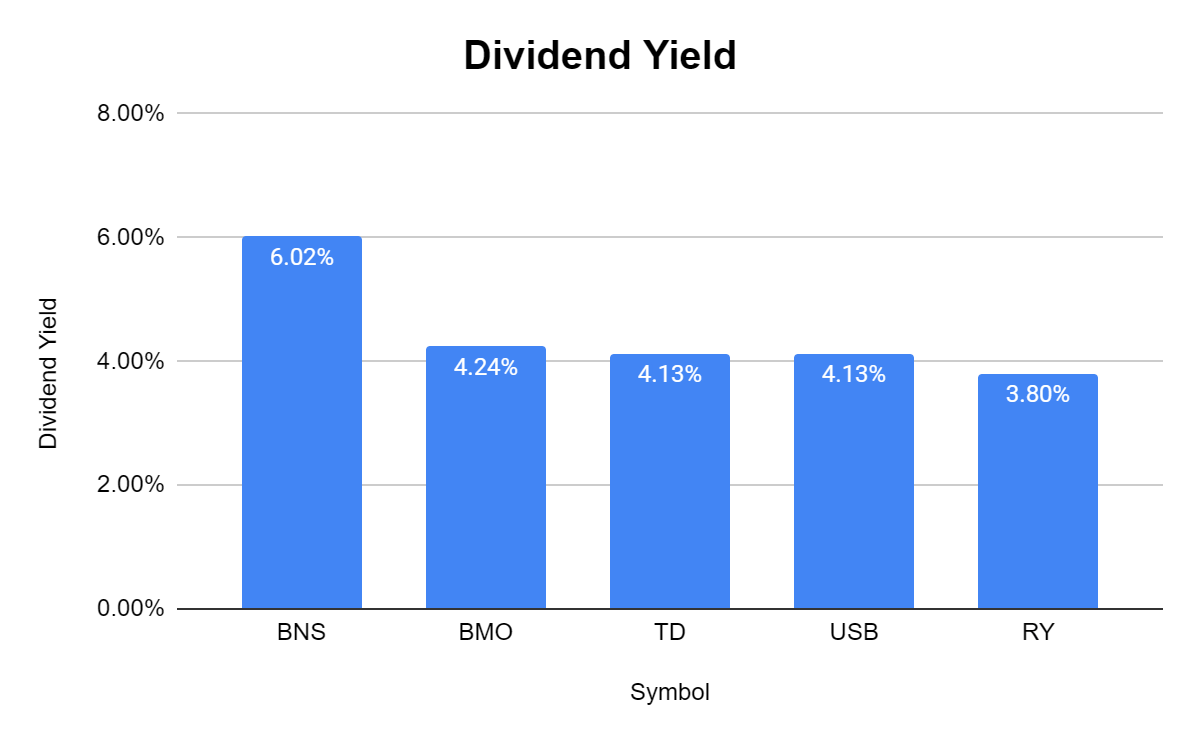
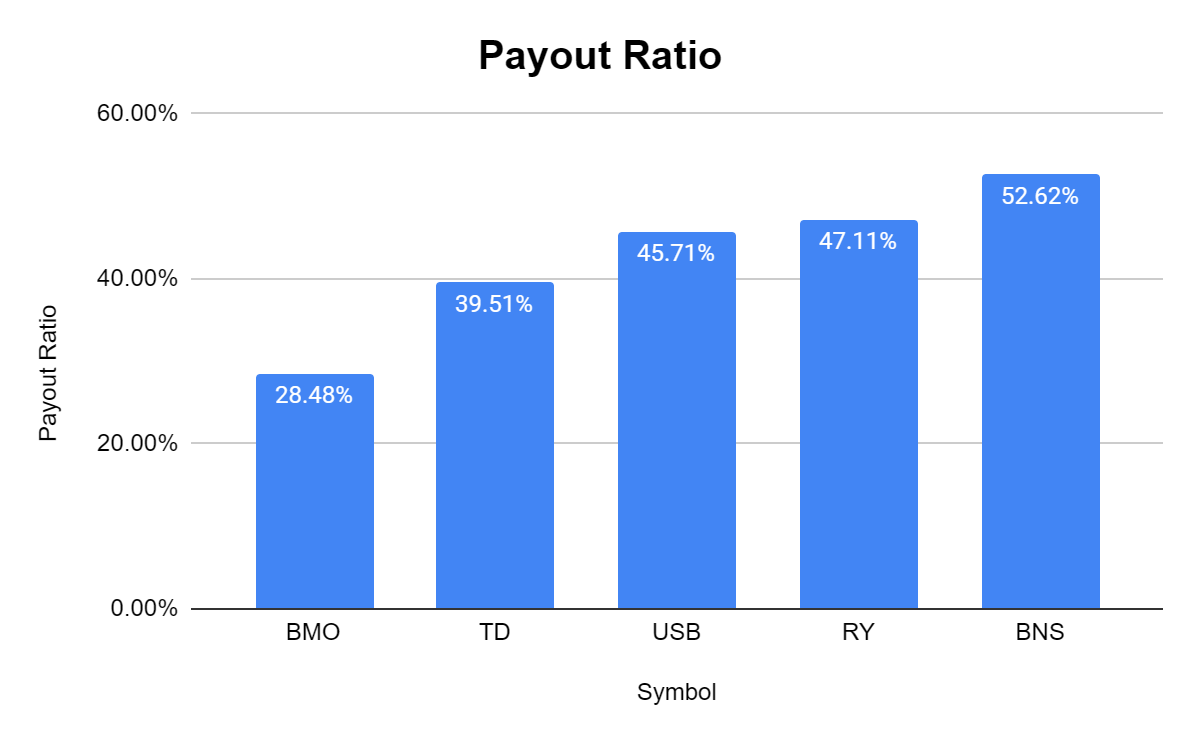
When it comes to the dividend, BNS pays the largest dividend, which yields 6.02% compared to the peer group average of 4.46%. BNS also has the largest payout ratio, which, unlike the dividend yield, higher isn't better. The peer group has an average dividend payout ratio of 42.69%, while BNS has a payout ratio of 52.62%. While this is the largest in the peer group, 52.62% is a very low payout ratio for a 6.02% dividend yield. There's more than enough room left over for future increases to the dividend down the road.
Conclusion
After doing my research, I'm very interested in BNS. I'm looking at BNS as strictly a dividend investment with prospects for capital appreciation. If the macro doesn't get worse, it looks like a bottom is forming, and an entry point is presenting itself. Compared to its peers, I like where BNS is valued as it could be positioned to rally in the future. With a dividend yield of 6.02%, a payout ratio of 52.62%, and a dividend that traces back to 1833, BNS has established a dividend track record that will be welcomed in my dividend portfolio. I don't own shares yet, but I may when this article is published, as I plan on making my first investment into BNS the week of 1/22/23.
For further details see:
Bank Of Nova Scotia Is Forming A Bottom And The 6% Yield Looks Enticing