BROE - Baron WealthBuilder Fund Q2 2023 Shareholder Letter
2023-08-16 09:30:00 ET
Summary
- Baron is an asset management firm focused on delivering growth equity investment solutions known for a long-term, fundamental, active approach to growth investing.
- Baron WealthBuilder Fund performed well in Q2 2023, appreciating 7.39%, slightly trailing the S&P 500 but surpassing the MSCI ACWI Index.
- The Fund has appreciated 18.58% year-to-date, exceeding both the Index and Global Index.
- The Fund's underperformance in Q2 was due to a narrow band of large technology companies driving market performance.
Dear Baron WealthBuilder Fund Shareholder:
Performance
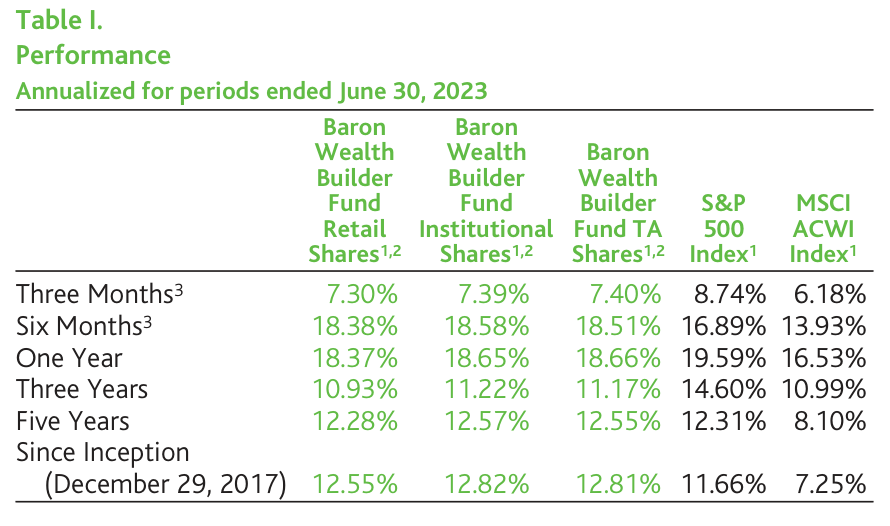
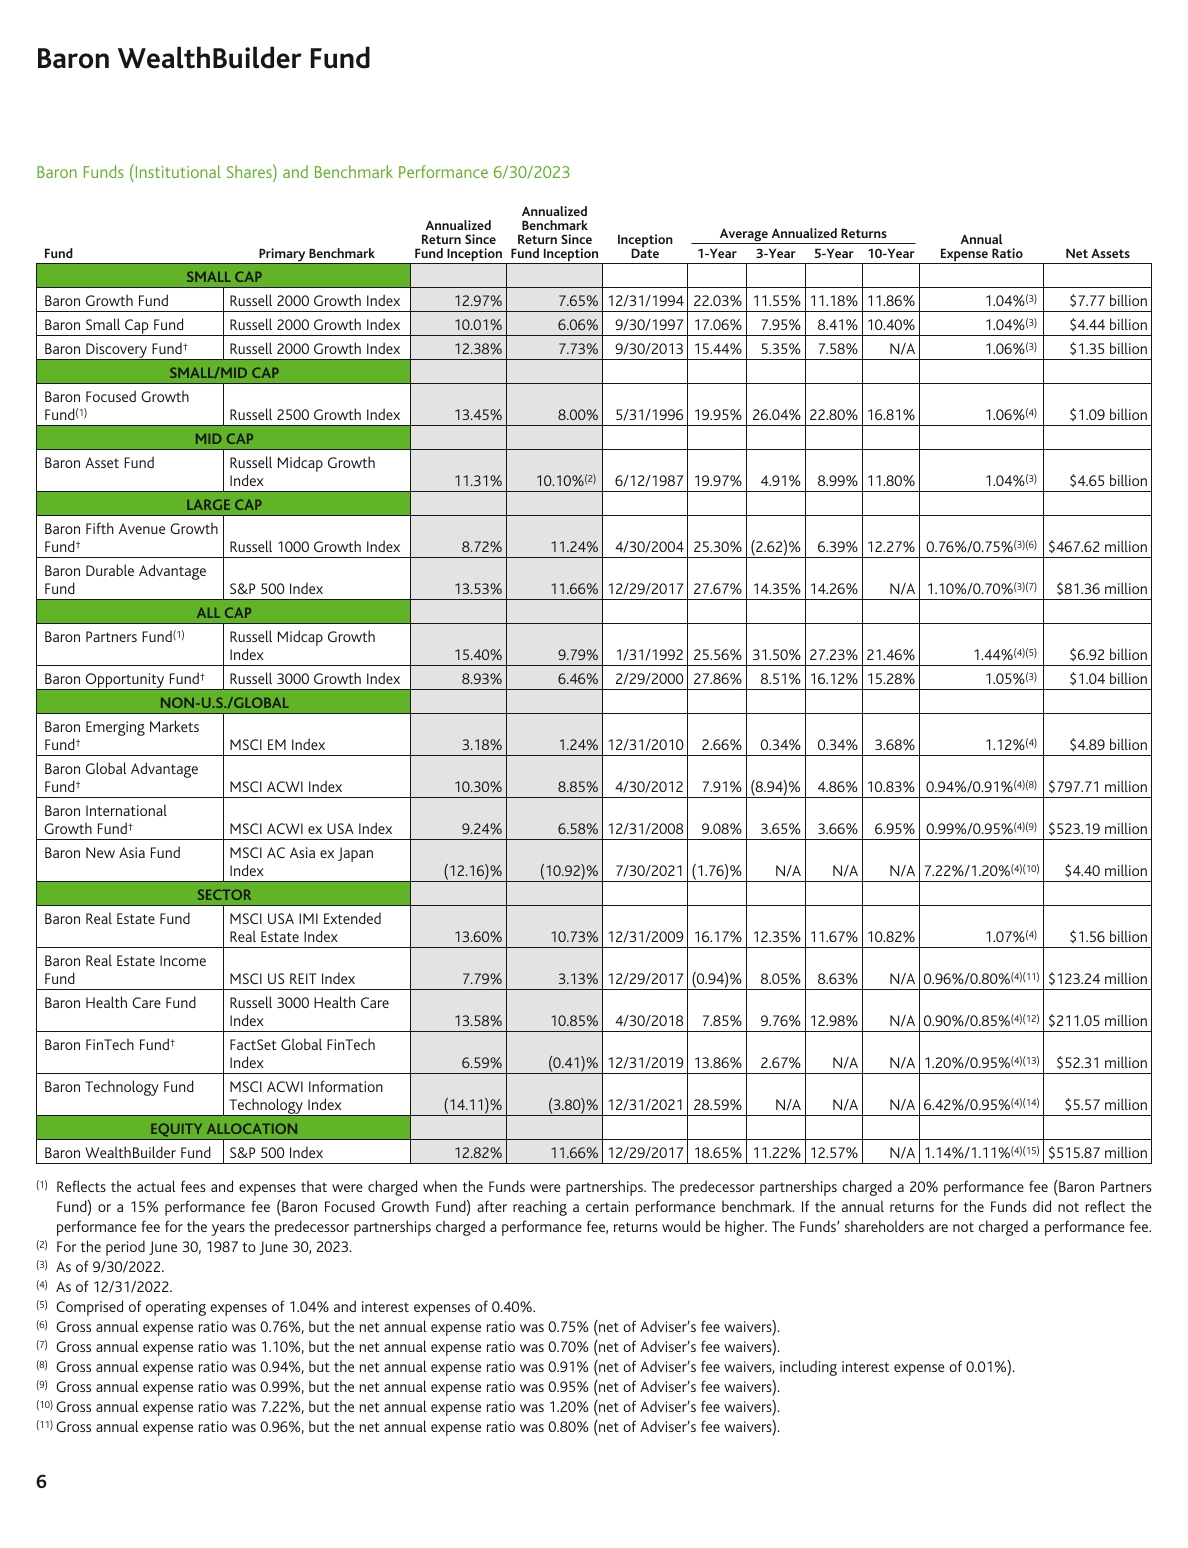
Baron WealthBuilder Fund® (the Fund) performed well in the second quarter of 2023. The Fund appreciated 7.39%. This appreciation slightly trailed the S&P 500 Index (the Index) but surpassed the MSCI ACWI Index (the Global Index). Those two indexes appreciated 8.74% and 6.18%, respectively. The Morningstar Aggressive Allocation Category average (the Peer Group) increased 4.73%.*
This performance builds on a good start to 2023. Year-to-date, the Fund has appreciated 18.58%, exceeding both the Index and Global Index, which have appreciated 16.89% and 13.93%, respectively.
And since its inception over five years ago, the Fund has returned 12.82% on an annualized basis. This appreciation again exceeds both the Index and Global Index.
| © 2023 Morningstar . All Rights Reserved. The Morningstar information contained herein: (1) is proprietary to Morningstar and/or its content providers; (2) may not be copied, adapted or distributed; (3) is not warranted to be accurate, complete or timely; and (4) does not constitute advice of any kind, whether investment, tax, legal or otherwise. User is solely responsible for ensuring that any use of this information complies with all laws, regulations and restrictions applicable to it. Neither Morningstar nor its content providers are responsible for any damages or losses arising from any use of this information. Past performance is no guarantee of future results. MORNINGSTAR IS NOT RESPONSIBLE FOR ANY DELETION, DAMAGE, LOSS OR FAILURE TO STORE ANY PRODUCT OUTPUT, COMPANY CONTENT OR OTHER CONTENT. Performance listed in the above table is net of annual operating expenses. The gross annual expense ratio for the Retail Shares, Institutional Shares, and TA Shares as of December 31, 2022 was 1.40%, 1.14%, and 1.15%, respectively, but the net annual expense ratio was 1.36%, 1.11%, and 1.11% (includes acquired fund fees of 1.06%, net of the Adviser’s fee waivers), respectively. The performance data quoted represents past performance. Past performance is no guarantee of future results. The investment return and principal value of an investment will fluctuate; an investor’s shares, when redeemed, may be worth more or less than their original cost. The Adviser reimburses certain Fund expenses pursuant to a contract expiring on August 29, 2033, unless renewed for another 11-year term and the Fund’s transfer agency expenses may be reduced by expense offsets from an unaffiliated transfer agent, without which performance would have been lower. BAMCO, Inc. (‘BAMCO” or the “Adviser”) has agreed that, pursuant to a contract expiring on August 29, 2033, unless renewed for another 11-year term, it will reimburse certain expenses of the Fund, limiting net annual operating expenses (portfolio transaction costs, interest, dividend, acquired fund fees and expenses and extraordinary expenses are not subject to the operating expense limitation) to 0.30% of average daily nest assets of Retail Shares, 0.05% of average daily net assets of Institutional Shares and 0.05% of average daily net assets of TA Shares, without which performance would have been lower. Current performance may be lower or higher than the performance data quoted. For performance information current to the most recent month end, visit Baron Funds - Asset Management for Growth Equity Investments or call 1-800-99BARON. * As of 6/30/2023, the annualized returns of the Morningstar Aggressive Allocation Category average were 12.04%, 9.74%, 6.25%, and 5.50% for the 1-, 3-, 5-year, and since inception (12/29/2017) periods, respectively. |
Markets have continued to recover in 2023. Investors are increasingly optimistic that the Fed’s interest rate hikes will be paused, inflation is stabilizing (and reversing in some key areas), and a recession can be averted. However, the macroeconomic outlook is anything but certain. Investors continue to prioritize safety and gravitate towards more stable and larger businesses. Additionally, much of the appreciation in the market indexes was confined to large technology companies that have exciting long-term growth prospects.
This narrow band of companies driving performance in the quarter was the main reason why our highly diversified Fund failed to keep pace with the Index. The seven largest technology-focused positions in the market-cap weighted S&P 500 Index (Microsoft, Apple, NVIDIA, Amazon, Meta, Tesla, and Alphabet) comprised 25.9% of the Index on average and accounted for 67% of the quarterly returns. Their year-to-date contribution was 74% of the Index’s return. With 426 underlying holdings in the Fund, Baron WealthBuilder is underweight all of these holdings except for Tesla.
Larger-cap and higher-growth underlying funds had the greatest returns in the period. This group includes Baron Opportunity, Fifth Avenue Growth, and Partners Funds. Whereas, smaller-cap, international, and sector strategies that are macro dependent in the short term had the lowest returns. This includes Baron Growth, Real Estate Income, and International Growth Funds.
Many factors contributed to the Fund’s largest underlying position, Tesla, Inc. , appreciating in the period. As discussed in our previous quarterly letter, investors’ concerns regarding Tesla in 2022 continue to dissipate, and the company’s business has continued to grow materially, although below peak margins. Tesla’s deliveries in China are recovering. The company’s newest factory in Texas has ramped production considerably and should contribute to improved domestic sales and margins. U.S. government policies have lowered the cost to own Tesla vehicles, while also reducing the company’s battery production expenses.
We continue to believe that Tesla is only scratching the surface of its potential. In early June, Tesla agreed to provide Ford Motors access to its electric vehicle (EV) charging technology and network. In quick succession, General Motors, Rivian, and Volvo, also gained access; and we expect other partnerships to follow. These announced partnerships between Tesla and its competitors have, in our opinion, increased the likelihood of the company achieving its mission. Consolidation around a single technology should accelerate charging infrastructure deployment, diminish the risk of Tesla’s technology becoming obsolete, and lessen a key concern of hesitant EV purchasers. EV adoption is at a tipping point. And Tesla, with its approximately 60% domestic market share of EVs, should be the most important beneficiary of this shift.
Finally, investors gravitated to companies that they expect will benefit from artificial intelligence (AI). The first companies to garner investors’ interest were software and semiconductor companies that enable AI. However, investors soon realized that companies that can effectively integrate AI could be the biggest beneficiaries. Tesla has been deploying its autonomous driving hardware since 2016 (and developing its software prior to that). This service relies on vehicles seeing their surroundings and instantly reacting to the environment. It is AI! Tesla is the leader in integrating proprietary AI training and inferential software with computer hardware. We believe Tesla will be able to sell their autonomous service, “Tesla Inside,” to other automobile manufacturers. Long term, Tesla’s autonomous driving software could become the most important part of the company’s business.
But while Tesla was the largest contributor to performance, there were other underlying holdings that had even greater appreciation in the quarter. CoStar Group, Inc. rose 29.3% over the prior three months, as its foray into the residential data market began to achieve impressive early results. CoStar’s residential monthly users are a year ahead of internal expectations, and these results were achieved prior to the company’s increased marketing spending. We believe the residential opportunity is greater than originally theorized or can be achieved with lower expenditures (or both). CoStar’s legacy commercial business exhibited modest weakness due to the macro environment. Regardless, CoStar’s ability to diversify its product lines and potentially dominate an adjacent category has made the company significantly more stable and valuable. The company has shown itself to be more dynamic than most investors expected.
With market performance being driven by a small number of companies and industries, it was important to avoid significant declines in the portfolio. Most of the weaker performers in the portfolio were companies that are closely tied to macro factors. MSCI Inc. , for example, declined 15.9% and was the largest detractor from performance. Similar to CoStar, MSCI is attempting to diversify its business lines. It is the dominant player in its core product line, the index business. Although this division has high retention rates, it is not immune to broad economic cyclical downturns. The recent banking scare caused cautionary client spend, extended sales cycles, and a modest decrease in retention, primarily with smaller clients. But unlike CoStar, growth of newer business lines has also slowed temporarily. We believe the issues in both the legacy products and newer areas will be shortlived. MSCI’s products have become the client standard for measuring performance, risk, and ESG results. While the banking crisis has temporarily reduced the rate of client spending, we believe increased industry regulation should cause large product lines (e.g., private assets) to migrate from traditional banks and to third-party asset managers. MSCI will help facilitate those managers’ offerings through its extensive data and client relationships. Ascertaining private company data is difficult and will be MSCI’s competitive advantage.
We encourage you to read the various quarterly letters found in this report to gain a deeper understanding of the funds that make up Baron WealthBuilder Fund.
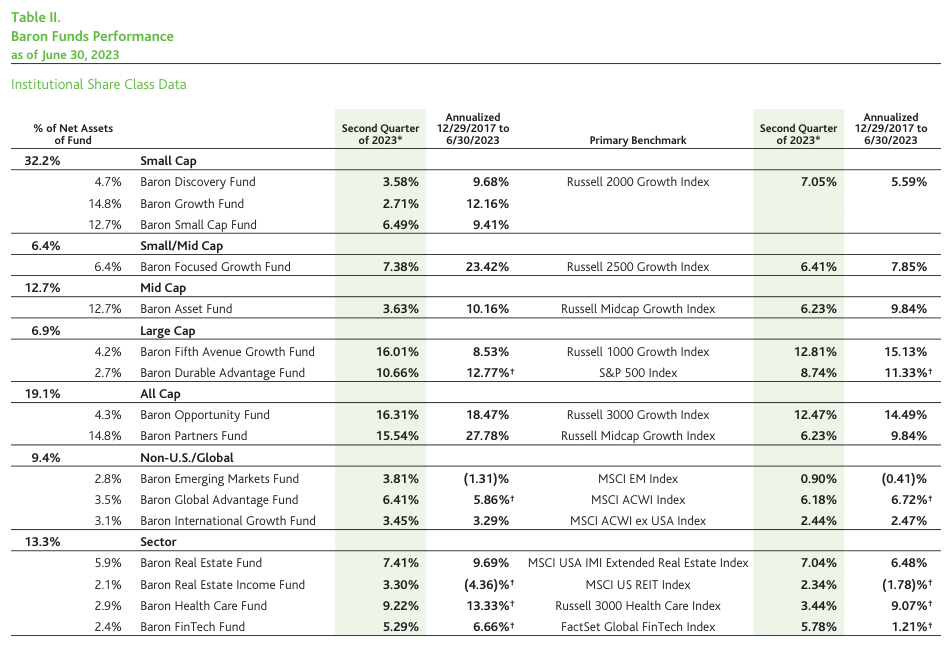
Fund of Funds Structure and Investment Strategy
Baron WealthBuilder Fund is a compilation of our Baron Funds and provides broad equity exposure. All underlying Baron Funds follow a consistent investment philosophy and process. We do not try to mimic the Indexes, and we do not alter our strategy to coincide with short-term macro events that we regard as unpredictable. We remain focused on underlying business fundamentals.
We believe small- and mid-cap growth stocks offer attractive return potential relative to their risk over the long term. Small- and mid-cap businesses represent 68.0% of the Fund (compared to only 17.2% for the Index). While our small- and mid-cap growth investments have been successful over our 41-year history, these styles are occasionally out of favor. Today’s environment is one of those times. Large-cap growth companies outperformed small-cap growth companies in the quarter and in many instances over the last decade. More specifically, the Russell 1000 Growth Index has outperformed the Russell 2000 Growth Index in 7 out of the last 10 calendar years, and 2023 is shaping up to be no different.
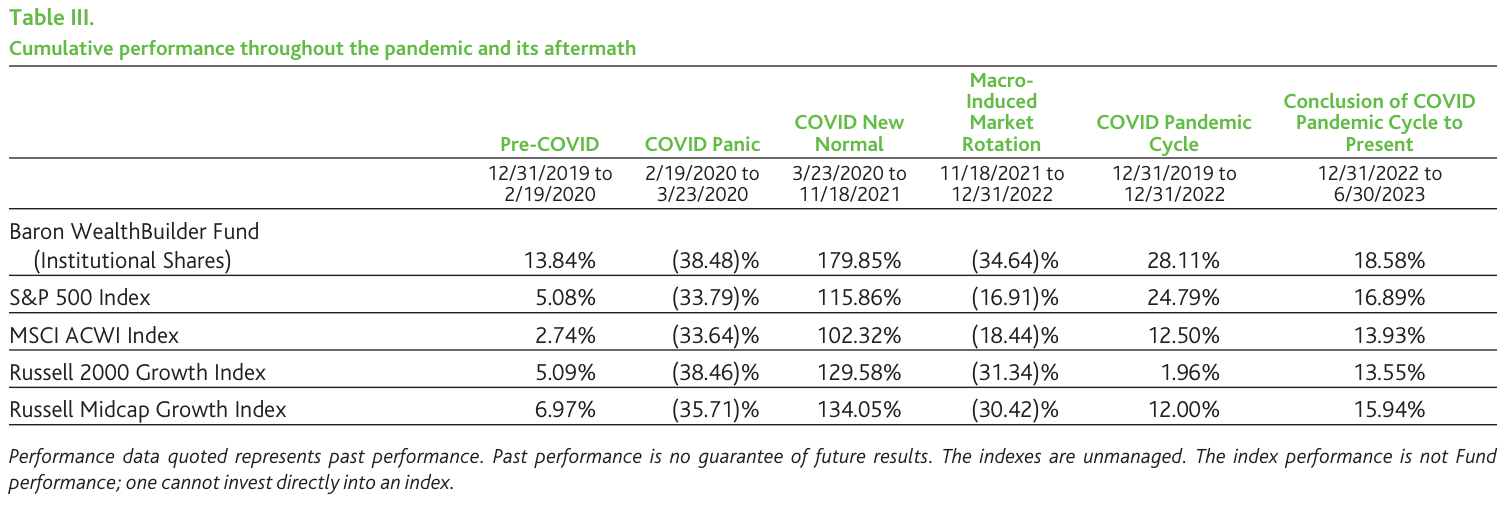
Rather than only examining the Fund’s performance over a quarter or a year, we believe it is equally important to understand how the Fund has performed over the course of an economic cycle. The COVID-19 Pandemic and subsequent Macro-Induced Market Rotation has been very difficult for small- and mid-sized growth companies. Investors have favored larger-cap, value-oriented businesses that are deemed safer during a time of uncertainty. We believe this offers a great opportunity for long-term investors to invest in small- and mid-cap growth businesses at attractive prices. Markets first peaked in late February 2020 before rapidly dropping as the economy braced for the COVID-19 Pandemic. It recovered quickly followed by another sizable drop based on macroeconomic factors. Over the three years of the COVID-19 Pandemic ending 12/31/2022, the Russell 2000 Growth Index, a small-cap growth index, gained only 1.96%. The Russell Midcap Growth Index fared better with a cumulative 3-year return of 12.00%. With that backdrop, the Fund performed better and appreciated 28.11%. We believe protecting and growing clients’ assets during this challenging period positions long-term investors well for meaningful appreciation once the macro landscape changes. Table III provides a more complete look at how the Fund and various indexes performed during the pandemic and its aftermath.
We do not yet know if the challenges caused by the COVID-19 Pandemic will persist. Volatility has remained high, but we are hopeful that interest rate increases, policy measures, and COVID-19 hangovers are ending. Growth has recently begun to outperform value. But safer large caps have continued to perform better than smaller companies. So far, we are optimistic that companies will again be valued on their fundamentals rather than macro concerns. We have started to see the performance of some individual securities diverge. This divergence of returns, we believe, should favor growth investors. As discussed, the Fund performed well in the second quarter and since the start of the year. And its returns year-to-date have exceeded both its Index as well as small- and mid-cap growth indices.
We continue to work hard to justify your confidence and trust in our stewardship of your hard-earned savings. We remain dedicated to providing you with the information we would like to have if our roles were reversed. We hope this letter enables you to make an informed decision about whether this Fund remains an appropriate investment.
Respectfully,
Ronald Baron, CEO and Portfolio Manager & Michael Baron, Co-Portfolio Manager
| Investors should consider the investment objectives, risks, and charges and expenses of the investment carefully before investing. The prospectus and summary prospectus contain this and other information about the Funds. You may obtain them from the Funds’ distributor, Baron Capital, Inc., by calling 1-800-99BARON or visiting www.BaronFunds.com. Please read them carefully before investing. Risks: The Fund is a non-diversified fund because it invests, at any given time, in the securities of a select number of Baron mutual funds (the “Underlying Funds”), representing specific investment strategies. The Fund can invest in funds holding U.S. and international stocks; small-cap, small to mid-cap, large-cap, all-cap stocks; and specialty stocks. Each of the Underlying Funds has its own investment risks, and those risks can affect the value of the Fund’s investments and therefore the value of the Fund’s shares. To the extent that the Fund invests more of its assets in one Underlying Fund than in another, it will have greater exposure to the risks of that Underlying Fund. For further information regarding the investment risks of the Underlying Funds, please refer to the Underlying Funds’ prospectus. Portfolio holdings are subject to change. Current and future portfolio holdings are subject to risk. Alpha measures the difference between a fund’s actual returns and its expected performance, given its level of risk as measured by beta. Beta measures a fund’s sensitivity to market movements. The beta of the market is 1.00 by definition. EPS Growth Rate (3-5-year forecast) indicates the long term forecasted EPS growth of the companies in the portfolio, calculated using the weighted average of the available 3-to-5 year forecasted growth rates for each of the stocks in the portfolio provided by FactSet Estimates. The EPS Growth rate does not forecast the Fund’s performance. Sharpe Ratio is a risk-adjusted performance statistic that measures reward per unit of risk. The higher the Sharpe ratio, the better a fund’s risk adjusted performance. Upside Capture explains how well a fund performs in time periods where the benchmark’s returns are greater than zero. Downside Capture measures how well a fund performs in time periods where the benchmark’s returns are less than zero. Standard Deviation (Std. Dev) measures the degree to which a fund’s performance has varied from its average performance over a particular time period. The greater the standard deviation, the greater a fund’s volatility (risk). The discussions of the companies herein are not intended as advice to any person regarding the advisability of investing in any particular security. The views expressed in this report reflect those of the respective portfolio managers only through the end of the period stated in this report. The portfolio manager’s views are not intended as recommendations or investment advice to any person reading this report and are subject to change at any time based on market and other conditions and Baron has no obligation to update them. This report does not constitute an offer to sell or a solicitation of any offer to buy securities of Baron WealthBuilder Fund by anyone in any jurisdiction where it would be unlawful under the laws of that jurisdiction to make such offer or solicitation. |
Editor's Note: The summary bullets for this article were chosen by Seeking Alpha editors.
For further details see:
Baron WealthBuilder Fund Q2 2023 Shareholder Letter