CME - Buy CME Group Before The Yield Doubles
2023-03-10 09:00:00 ET
Summary
- The article provides a good understanding of CME Group Inc.'s business, its high barriers to entry, and how the company benefits from volatility, in the equity and fixed income markets.
- CME's qualities as a dividend payer are highlighted using quarterly average daily volumes, free cash flow and dividend data from 2009 to 2022.
- In addition, CME's profitability and balance sheet quality are analyzed and key risks are highlighted.
- The article also provides an earnings and cash flow based valuation and concludes with my strategy for opening a position in CME stock.
Introduction
As the designer of a portfolio that aims to provide my family (and ideally future generations) with a reliable and growing dividend income, I constantly strive to balance my holdings so that the portfolio as a whole can withstand any economic environment. Today, I will look at CME Group Inc. ( CME ), a highly interesting company that I suspect is overlooked by many due to its apparent complexity.
As I will explain, adding a position in CME stock to a diversified portfolio will be beneficial from a risk management perspective. I will briefly explain CME's business - and show why it is not so difficult to understand after all -, discuss its profitability and balance sheet quality, point to key risks, and provide a concise valuation. Importantly, I will also address management's attitude toward cash returns to shareholders.
How Does CME Group Make Money?
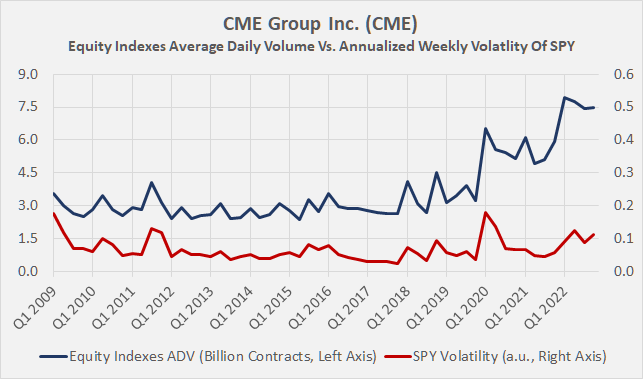
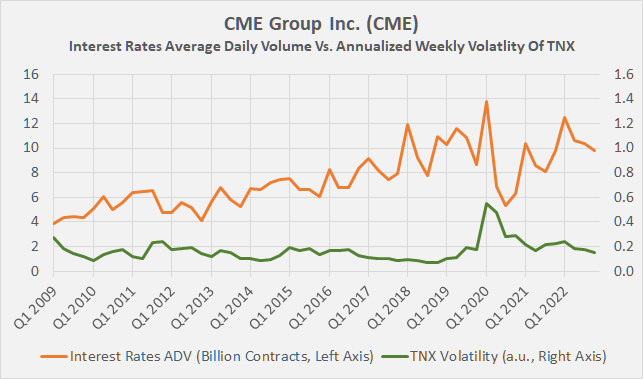
In a nutshell, CME operates a financial risk management business. Through access to futures, options and over-the-counter products, market participants are able to manage risks in various asset classes in a timely and effective manner. Especially in times of economic uncertainty and/or increased market volatility, timely execution and product availability is critical. Since CME is the go-to venue for futures and other derivatives for hedging purposes, it benefits from volatile times. This is evident, for example, when comparing CME's average daily volume ((ADV)) of its equity index contracts to the volatility of a particular equity index such as the S&P 500 ( SPY ), which serves as a reasonable proxy for the stock market (Figure 1). Given the wide variety of CME's offerings (see below), Figure 1 provides only a limited picture. Therefore, it is also worthwhile to compare CME's interest rate contracts ADV with the annualized weekly volatility of the 10-year Treasury yield ("TNX", Figure 2).
Figure 1: CME’s average daily volume of equity index contracts compared to the annualized weekly volatility of the SPDR S&P 500 ETF Trust ((SPY)), calculated on the basis of daily log returns excluding dividends (own work, based on CME’s earnings press releases from 2009 to 2022 and SPY’s daily closing price) Figure 2: CME’s average daily volume of interest rate contracts compared to the annualized weekly volatility of the yield of 10-year Treasuries, calculated on the basis of daily log changes in yield (own work, based on CME’s earnings press releases from 2009 to 2022 and ICE futures data)
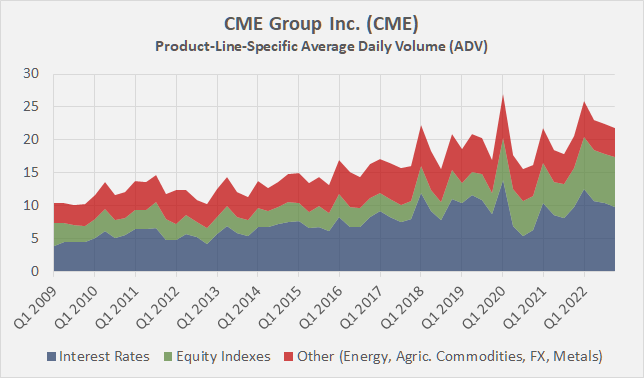
CME operates globally and offers the largest range of benchmark products in the categories of interest rates, equity indices (e.g., E-mini futures on the S&P 500, Nasdaq-100, DJIA and Russell 2000), energy (e.g., WTI crude oil), agricultural commodities (e.g., corn, soybeans), foreign exchange and metals (e.g., gold and silver). Interest rate and equity indices derivatives account for about 45% and 33% of CME's ADV, respectively (Figure 3). CME also owns a 27% stake in S&P Dow Jones Indices. CME also operates CME Clearing, one of the world's largest and most respected clearing houses. It also offers analytical tools and provides price discovery information through market data. In addition to its namesake exchange, the Chicago Mercantile Exchange, CME's major holdings include the Chicago Board of Trade (CBOT), the New York Mercantile Exchange and the Commodities Exchange (NYMEX and COMEX).
Figure 3: CME’s product-line-specific average daily volume (own work, based on CME’s earnings press releases from 2009 to 2022)
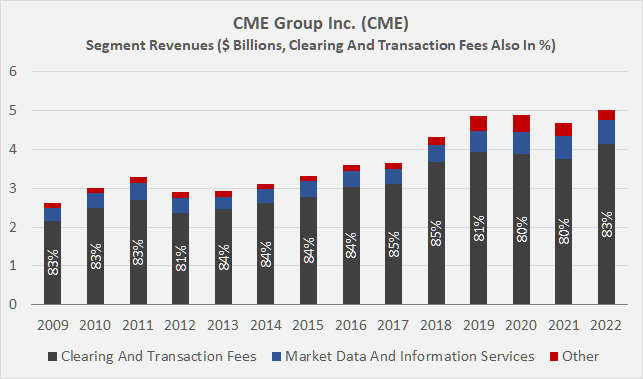
CME makes most of its money from clearing and transaction fees. Its "bread and butter" segment (Figure 4) has grown at a compound annual growth rate ((CAGR)) of 5% since 2009 and typically accounts for just over 80% of total revenues. Revenues from offering market data and information services are still quite modest, but have also grown at a 5% CAGR since 2009. From this perspective, it is not correct to conclude that CME is diversifying its business away from transaction revenue, but I do think that its Market Data and Information Services segment will continue to grow due to ever-increasing demand for data analytics and the discovery of new ways to monetize data.
As an aside, I have chosen to analyze CME since 2009 because of the acquisition of the NYMEX holdings in 2008 and the merger with CBOT in 2007. Another important acquisition was that of NEX Group in 2018, which added the leading electronic FX and fixed income execution platforms.
Figure 4: CME’s segment revenues (own work, based on the company’s 2010 to 2022 10-Ks)
CME’s Stellar Profitability Explained
Companies in the financial sector are generally quite profitable due to their lean asset base. However, companies with a distinct competitive advantage and a deep-rooted economic moat can operate on surprisingly high margins. CME's top position is easy to understand given that it operates a renowned clearing house and offers a wide range of benchmark financial derivatives for hedging purposes. CME's large ecosystem has attracted a vast number of clients over the years, thanks to its renowned status, growing offering and top-notch execution (which is particularly important in derivatives), resulting in significant network and lock-in effects. The firm also benefits from significant economies of scale. The strength of CME's ecosystem is also easy to see from a retail investor's perspective: Would you trade your equities on the NYSE (which by the way is owned by CME's peer Intercontinental Exchange, ICE ) knowing that there is ample liquidity provided at all times, or would you prefer to trade through market makers on foreign exchanges or even over-the-counter, exposing yourself to potentially devastating spreads? This example is not even entirely accurate in explaining CME's network effects, since stocks bought on the NYSE can also be sold on another exchange - unlike CME's contracts, which can only be traded on its own exchanges.
As a result, it is hardly surprising that CME typically has an operating margin of around 60%. Given NEX's somewhat lackluster performance to date, which suggests that the business has yet to be properly integrated, I actually see some room for margin expansion.
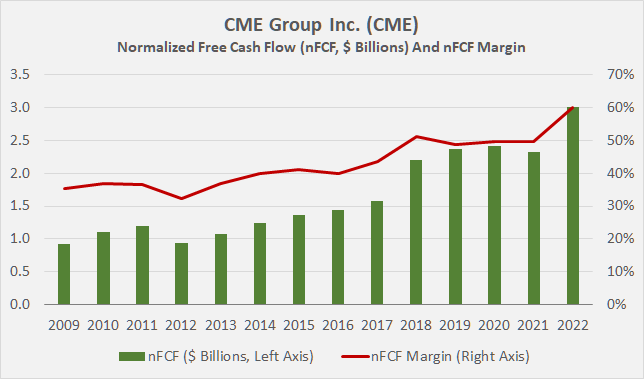
CME's profitability also looks extremely good from a free cash flow ((FCF)) perspective. If we normalize FCF in terms of working capital movements and adjust for stock-based compensation, we see on the one hand a clear growth trend (9.5% CAGR since 2009) and on the other hand margin expansion from mid-30% to around 50% in recent years (Figure 5).
Figure 5: CME’s normalized free cash flow (nFCF) and nFCF margin (own work, based on the company’s 2008 to 2022 10-Ks)
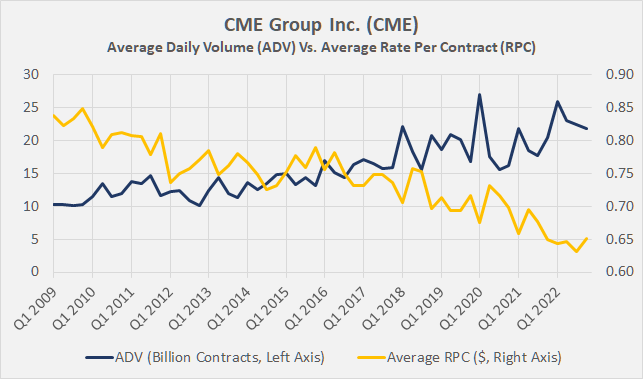
I think this is an excellent performance, especially in view of the constantly declining average rate per contract ((RPC)), which is often analyzed together with ADV when looking at a derivatives exchange. The fairly steady decline is worrisome at first glance, but not necessarily a good indicator of business performance due to its dependence on product mix and trading venue. Moreover, the decline should be seen against the backdrop of growing volumes (Figure 6), and lower RPC will most likely help maintain volume growth. Relatively modern products like the micro E-mini futures contracts are also doing their part - they are much smaller than classic E-minis but relatively more expensive. Overall, I don't think the decline in RPC is a concern, but of course it would be nice to see the company diversify somewhat away from transaction-based revenue (similar to ICE) by, for example, focusing more on providing market data and analytics, where it also benefits from high switching costs and pricing power as an increasingly trusted provider.
Figure 6: CME’s average daily volume and average rate per contract on a quarterly basis (own work, based on the company’s full-year earnings press releases from 2009 to 2022)
Depending on the chosen weighted average cost of capital ((WACC)), CME generally generates excess returns on its invested capital ((ROIC)). GuruFocus currently estimates CME's WACC at 7.3%, which I believe is reasonable given the company's solid margins, excellent balance sheet quality (see below), and top-tier position. However, I believe it is appropriate to adjust CME's invested capital for the intangible assets attributable to the CBOT and NYMEX transactions mentioned above. Granted, CME occasionally acquires other companies, but it is not growing primarily inorganically, and the CBOT and NYMEX transactions are far behind. Against this backdrop, CME typically generates ROIC in excess of its WACC in the high teens, which is very good indeed and confirms the company's top position in the industry. Given the robust free cash flow margin, CME's cash return on invested capital (CROIC) is similarly strong.
CME’s Balance Sheet Quality, Dividend Policy And Reliability
In my portfolio, I focus on companies with solid balance sheets. I have nothing at all against leverage, as long as it is used sensibly and does not serve to cover up weak operating performance. However, when it comes to companies in the financial sector, I tend to be cautious about leverage because of the severity and speed with which turbulence in the financial markets can affect a company's operations.
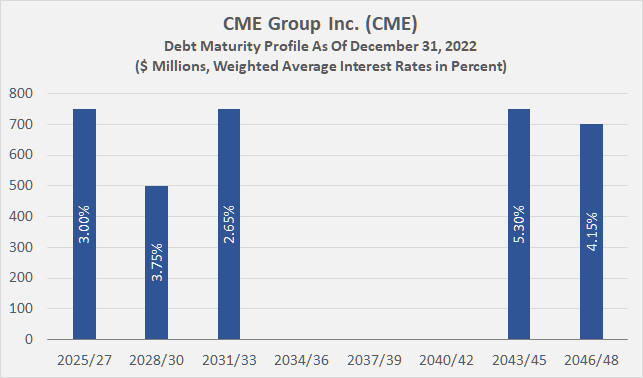
Indeed, I consider CME's balance sheet to be very solid. While its equity ratio is not particularly high at only about 15%, CME typically uses only a small amount of leverage to fund its operations. At the end of 2022, CME had about $3.5 billion in long-term debt on its balance sheet - hardly noteworthy given its $2.8 billion in cash and cash equivalents. As I will show below, CME is very shareholder-friendly and typically distributes all of its excess free cash flow, but does not typically repurchase its own stock. However, if the company were to hypothetically suspend its dividend, it could repay all of its gross debt within 1.5 years with free cash flow. The interest coverage ratio is very conservative at 17 times the three-year average nFCF. The current weighted average interest rate on CME's long-term debt is 3.8%, and after reviewing the current debt maturity profile, I believe it is reasonable to conclude that the company's earnings and free cash flow are not materially affected by current rising interest rates (Figure 7). CME's long-term debt rating of Aa3 (S&P equivalent of AA-) was last affirmed by Moody's in November 2022 with a stable outlook. The rating agency views CME’s clearing house as " very strong [and] supportive of CME’s creditworthiness " and also mentioned that the company " derives considerable credit strength from the strong barriers to entry, substantial liquidity pools and customer stickiness in its vertically integrated clearing and trading activities ".
Figure 7: CME’s debt maturity profile as of December 31, 2022 (own work, based on the company’s 2022 10-K)
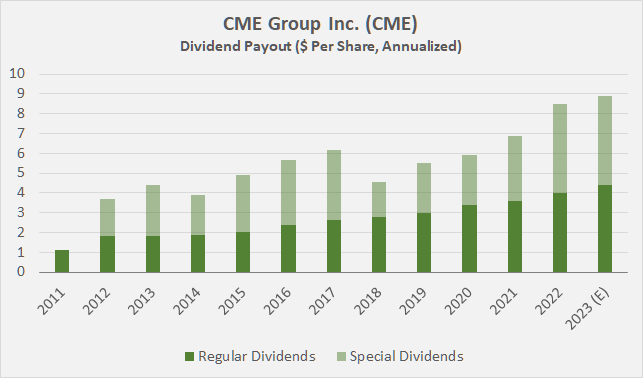
Companies with a wide economic moat, solid balance sheets and strong profitability are ideal candidates for a portfolio with a long-term horizon and a focus on resilience. Since CME pays a regular quarterly dividend, the company is also suitable as a component of an income-oriented portfolio. The current yield of 2.4% is not particularly high when compared to the current yield on certificates of deposit (over 5%) or long-term Treasuries (nearly 4%). However, continued growth in the dividend should bring the investor's yield on cost close to meaningful rates relatively quickly. CME has grown its dividend very reliably at nearly 10% per year (9.3% on a 10-year CAGR basis, 9.5% on a 5-year CAGR basis), and its 60% payout ratio relative to the three-year average nFCF still leaves room for growth, even if cash flow growth is muted for a few years.
That said, I think it's important to note that CME's dividend policy is well aligned with the volatility of its earnings. The company typically pays out all of its excess free cash flow in the form of a special dividend at the end of the year. Assuming CME generates similar cash flow to last year, the stock's yield - if bought today - should double to 4.9% by year-end. CME's dividend payout profile since 2011 is shown in Figure 8.
While it is probably a bit aggressive to take the special dividend for granted, I think investors can continue to expect a significant special dividend in the context of what remains a fairly volatile environment. Of course, I would expect CME to lower or (temporarily) eliminate the special dividend if there is a prolonged recession or a sustained decline in market volatility.
Figure 8: CME’s dividend payout profile, consisting of regular quarterly dividends and special dividends (own work, based on the company’s 2011 to 2022 10-Ks)
Risks Worth Considering
As has been made clear, CME Group's earnings are largely dependent on transaction revenue. Of course, continued diversification into monetizing trading data will dampen earnings volatility, but at the same time, I would argue that CME's earnings volatility is actually desirable when the stock is held as part of a diversified portfolio. The company typically makes more money when the market is under stress and/or the demand for certain hedging instruments is elevated. CME's diversified positioning (primarily in interest rates, equity indices, energy, and agricultural commodities) is also beneficial in this context. A prolonged recession with declining market activity would obviously hurt CME, but I do not believe that economic activity will decline significantly and, more importantly, remain subdued for several years - which would be a necessity for this risk to become effective.
Of course, the continued decline in CME's average RPC should be closely watched. However, as long as the company maintains or even improves its already high profitability, I don't think the decline is overly problematic given the unabated growth in contract volume, quality of order fulfillment, and secular tailwinds.
The (theoretical) elephant in the room is the CME clearing house. As a significant central counterparty ((CCP)), CME is systemically important, so at first glance the stock is a big no-no for those investors who question the stability of our financial system. I do not exclude myself here, as I have been extremely concerned about the stability of our financial system for some time due to the multiple interconnections that can cause devastating chain reactions. However, having worked in the industry for a number of years and having witnessed risk management first hand for example during the March 2020 sell-off, I have built up a meaningful deal of confidence. In the context of CCPs, it is worth noting that the intermediary bears relatively little risk. Collateral is seized if a counterparty defaults (i.e., fails to fulfill a contract), but CME, like other CCPs, only covers losses up to a certain amount (in the hundreds of millions of dollars) before a guaranty fund steps in, maintained by the counterparties. In short, spreading losses among the clients significantly reduces the risk to the systemically important CCP. Of course, CME stock is expected to plummet massively in the event of a financial crisis, as I believe the waterfall-like risk management structure of CCPs is not widely understood or appreciated.
Other risks worth considering include potential regulatory efforts to dilute CME's monopolistic behavior by forcing the company to spin off certain businesses, such as the clearing house. A decline in the use of fossil fuel futures and other related derivatives should also be mentioned, but I would not over-interpret this risk - the recent past has shown us once again how important fossil fuel derivatives can be as hedging instruments. I wouldn't go so far as to suggest that the CME's energy derivatives business is benefiting massively from secular tailwinds (i.e., the next commodity "supercycle"), but I don't think they will disappear anytime soon either.
Valuation
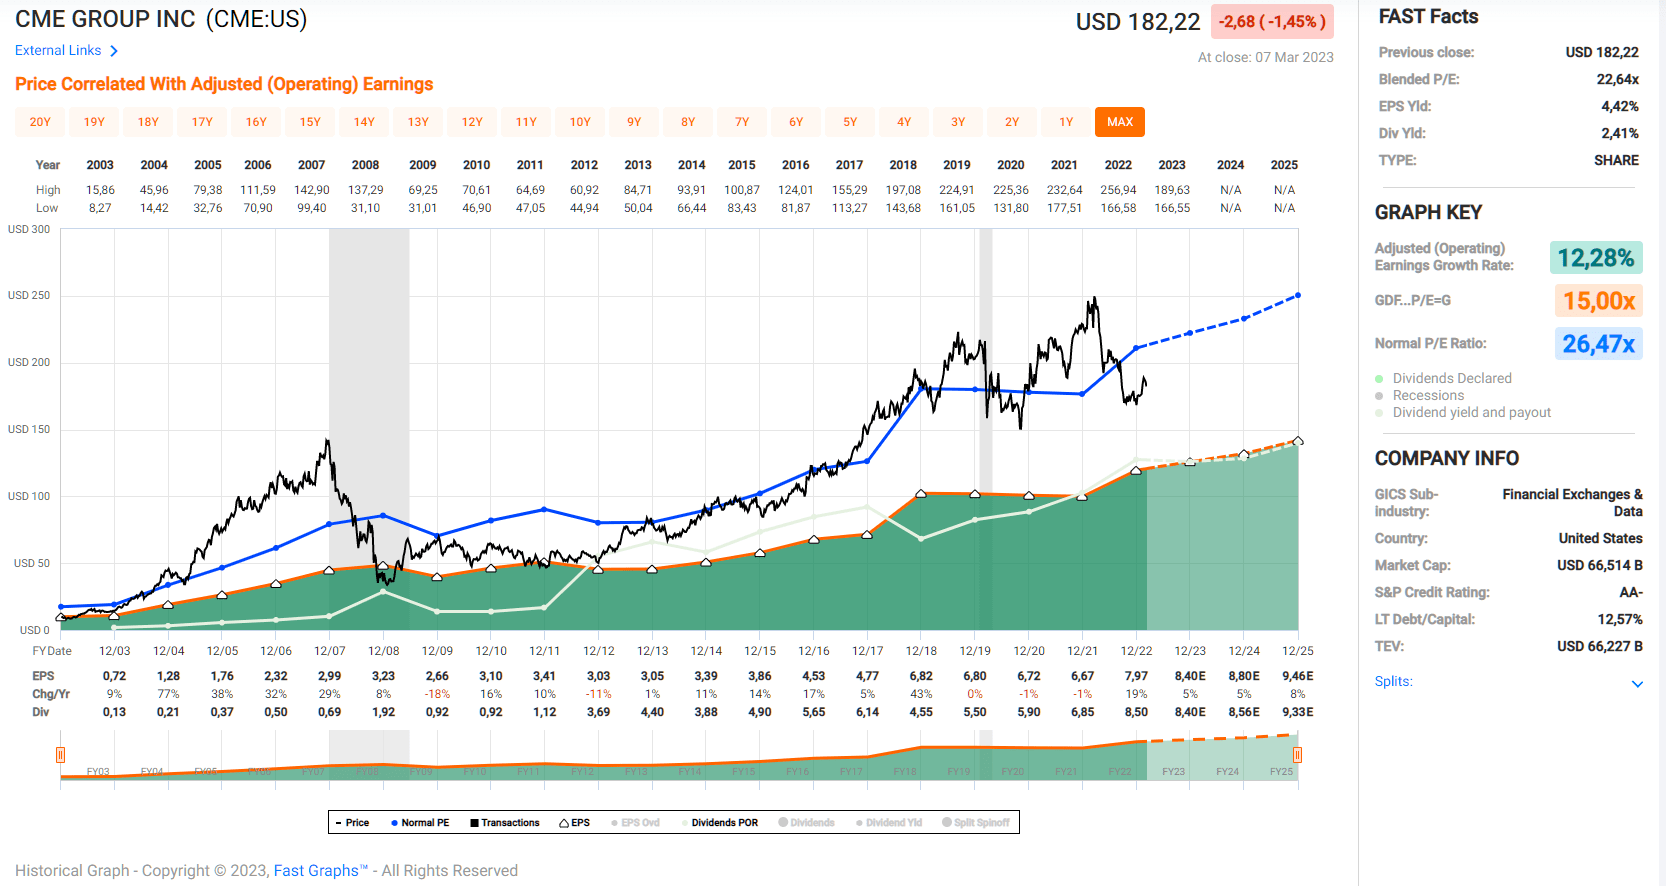
According to FAST Graphs, CME Group stock is currently trading at a blended price-to-earnings (P/E) ratio of 23. That's certainly not cheap, but I think it's fair to say that the stock deserves a premium valuation given its wide economic moat, excellent profitability and solid balance sheet. I think CME stock can drop to a P/E of 15 or a little less in a severe downturn, as it did during the Great Recession. This would equate to an annualized rate of return of -8.5% by the end of 2025, excluding dividends, which would dampen the negative return by 40% to 50%, as a cut in the regular dividend is very unlikely and I imagine CME can maintain a sizable special dividend in times of increased volatility and increased demand for hedging. Conversely, a return to the price-to-earnings ratio that the market has assigned to CME over the past two decades would imply an annualized rate of return of nearly 12% - again, excluding dividends. Of course, such an expectation appears quite optimistic. If the market continues to value CME at its current P/E ratio, investors can expect an annualized rate of return of 10%, including dividends and assuming analyst estimates hold, which, by the way, have changed little recently. Of course, I wouldn't over-interpret the two- or three-year forward analyst estimates, since a business like CME Group's is pretty hard to predict.
Figure 9: FAST Graphs chart of CME stock, based on adjusted operating earnings and illustrating the downside scenario (obtained with permission from www.fastgraphs.com)
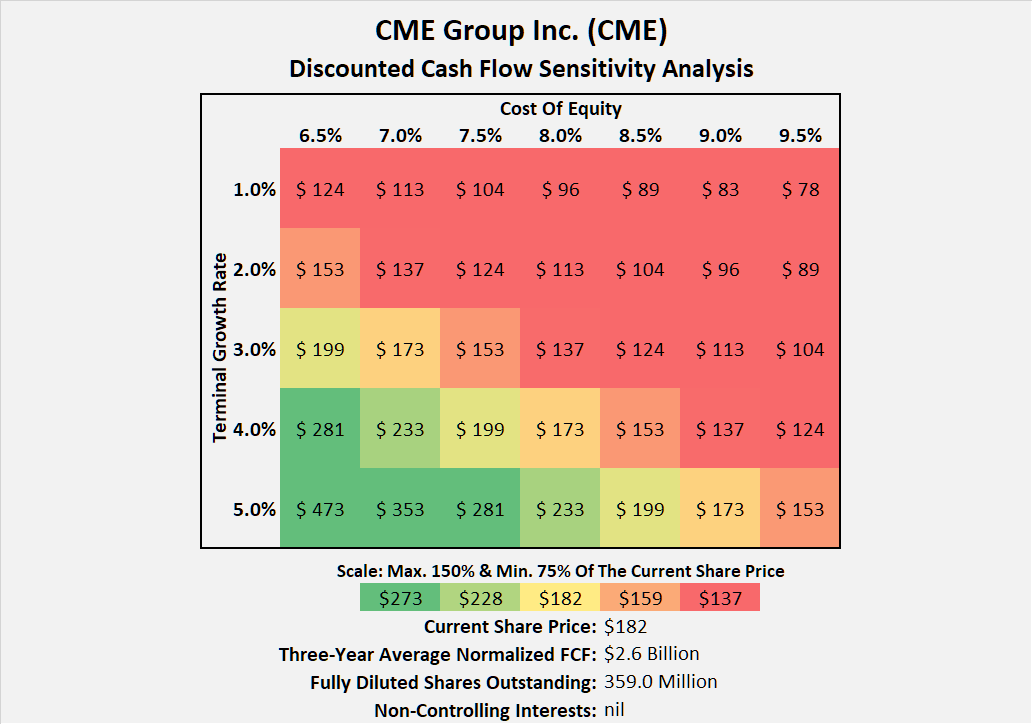
CME is also not a cheap stock from a free cash flow perspective. If we take CME's three-year average nFCF and run a simple discounted cash flow sensitivity analysis with a cost of equity of 8%, the company would have to grow its unencumbered cash flow by more than 4% per year in perpetuity for the stock to be fairly valued at present (Figure 10). This is certainly not an undemanding valuation. Investment services firm Morningstar currently gives the stock a four-star rating, based on a fair value estimate of $215 (a 15% discount) with medium uncertainty, a wide economic moat with a stable trend, and an exemplary capital allocation rating.
Figure 10: Discounted cash flow sensitivity analysis of CME stock (own work)
Conclusion
CME, a leading player in the exchange business, is undoubtedly a wonderful company. Its prestigious status has earned it a great deal of trust and has led to its exchanges being the premier destination for derivatives-based risk management. CME's liquidity pools are huge and continue to grow, resulting in significant barriers to entry and considerable economies of scale.
In retrospect, CME's acquisitions have been extremely shrewd, and the company's management continues to be careful not to waste cash on questionable acquisitions. CME has an extremely strong balance sheet that will suffer only marginally in the current rising interest rate environment.
CME is benefiting from a volatile market environment. So, combined with its extremely high margins and solid balance sheet, I think the stock is a good addition to a broadly diversified portfolio with capital preservation, growing income through dividends, and moderate capital gains as the main premises. While the stock could see significant volatility in a recession, I believe CME's regular quarterly dividend is very safe even in an economic downturn. I view CME currently as a 4.8%+ yielding stock, but think it is reasonable to expect occasional omissions of the special dividends, especially in the event of a prolonged downturn.
At $180, I think CME is a great company at a fair price. I appreciate the rock solid balance sheet, the somewhat countercyclical cash flow profile, the monopolistic tendencies, and the very high barriers to entry. I bought an initial position yesterday, but at the current valuation I am not an aggressive buyer. However, I think it would be foolish to expect the stock to fall to 15 times earnings in the foreseeable future. The market is not stupid, and this is borne out by the fact that the stock was still trading at an earnings multiple of over 20 at the height of the pandemic in March 2020. Although the stock lost more than 70% of its value during the Great Recession - which was not unreasonable for a financial services company in the environment at the time - I think it is important to note that CME stock has not fallen to a P/E ratio of less than 10. Therefore, I expect to gradually increase my position in the coming months to around 1% of the portfolio size by the end of 2023, at which point I will reassess.
Thank you for taking the time to read my article. Regardless of whether you agree or disagree with my conclusions, I always welcome your opinion in the comments section below. And if there is anything you would like me to improve or expand upon in future articles, drop me a line as well.
For further details see:
Buy CME Group Before The Yield Doubles