META - Charting The Worst Market In Over 30 Years Of Trading Toward A Hard Landing
Summary
- November began with another 75 bps rate hike from the Fed that kicked off the largest post-FOMC market selloff in history in the final hours on Wednesday.
- Multiple mega-cap FANG stocks hit new 2022 lows this week and some like META hit the lowest levels this week since September 2015.
- The 10-year treasury bond has seen the largest 1-year sell off since 1788 yes, 1788, and the worst year for the 30-year bond since 1926.
- The Fed is hiking interest rates at the fastest rate in US history already to 2008 levels and cutting the Fed balance sheet in the largest monthly reductions ever recorded.
- Volatility measures have already seen 42 days on the S&P 500 greater than +/- 2% moves on pace for the highest daily volatility since the Global Financial Crisis.
Introduction
If it feels like we are in unprecedented times. Let me show you some of the charts from this week that have reached levels I have never seen before in over 30 years of trading. Some of these charts have even reached levels not seen in the history of US markets.
This article offers some key charts taken from my recent market articles as we continue to analyze one of the worst markets in my lifetime:
- How The Best Portfolio Models Since 2007 Are Performing In 2022 Versus The Value & Momentum Portfolios
- Fundamental Investing Hits Breakdown Conditions, Buy-The-Dip Looks Broken
- Fed Promises Faster Moves On Largest QT Program In History
- How Markets May React To Fed's QT Program
I have no desire to be pessimistic, but as long as the Fed continues on its record pace to drain liquidity from the markets and hike rates to historic levels to combat inflation, the only outcome I see will deliver a hard landing.
Analyzing the Market
You can find more context for these charts in the market articles, but my purpose here is to quickly illustrate a broad range of incredible market conditions for you to consider.
S&P 500 Index fund ( SPY ) Monthly chart illustrating the QE/QT relationship and the much higher volatility in bear channels than in positive bull channels. A probabilistic technical interpretation suggests the S&P 500 is heading toward a 3250 support test of the positive channel from 2009. The Nasdaq 100 index fund chart ( QQQ ) is quite similar. So far, this negative channel descent shows an orderly bearish stair step pattern with none of the double-digit percentage selloffs we saw in 2018 and 2020.
VMBreakouts.com FinViz.com
The chart below shows the Federal Reserve balance sheet holdings of domestic securities for 2022 in trillions of dollars. The increase shows the quantitative easing (QE) additions to the balance sheet for 2022 that ended the week of March 9th. Then QT started in week 25 of this year and has been accelerating lower as the Fed promised through September and October back down to 2021 levels. As the SPY chart above illustrates there is a strong correlation with Fed stimulus and the removal of this stimulus that was used to help the markets through the Covid pandemic in the largest Fed intervention in history.
VMBreakouts.com
S&P 500 total daily returns by days of the week for 2022 with only Wednesday still positive this year. Notice that every day of the week this year has had more down days than positive days. I have never seen a completely negative daily trend before and certainly not one that has lasted through over 10 months of the year.
VMBreakouts.com
S&P 500 daily +/- 2% moves for every year since 2008 financial crisis. 2022 on pace to hit the highest levels since 2009 with 8 trading weeks left in the year. These daily totals do not include intraday swings like we saw on Friday with the Dow moving over 1,300 points before closing with just a 1.2% gain.
VMBreakouts.com
The biggest driver of the S&P 500 volatility are the Technology mega-cap FANG index stocks. The MicroSectors FANG+ Index 3X Leveraged ETN ( FNGU ) illustrates the 10 largest mega-cap stocks in the negative channel from August hitting new 2022 lows back to May 2020 levels this week on record high negative volumes.
FinViz.com
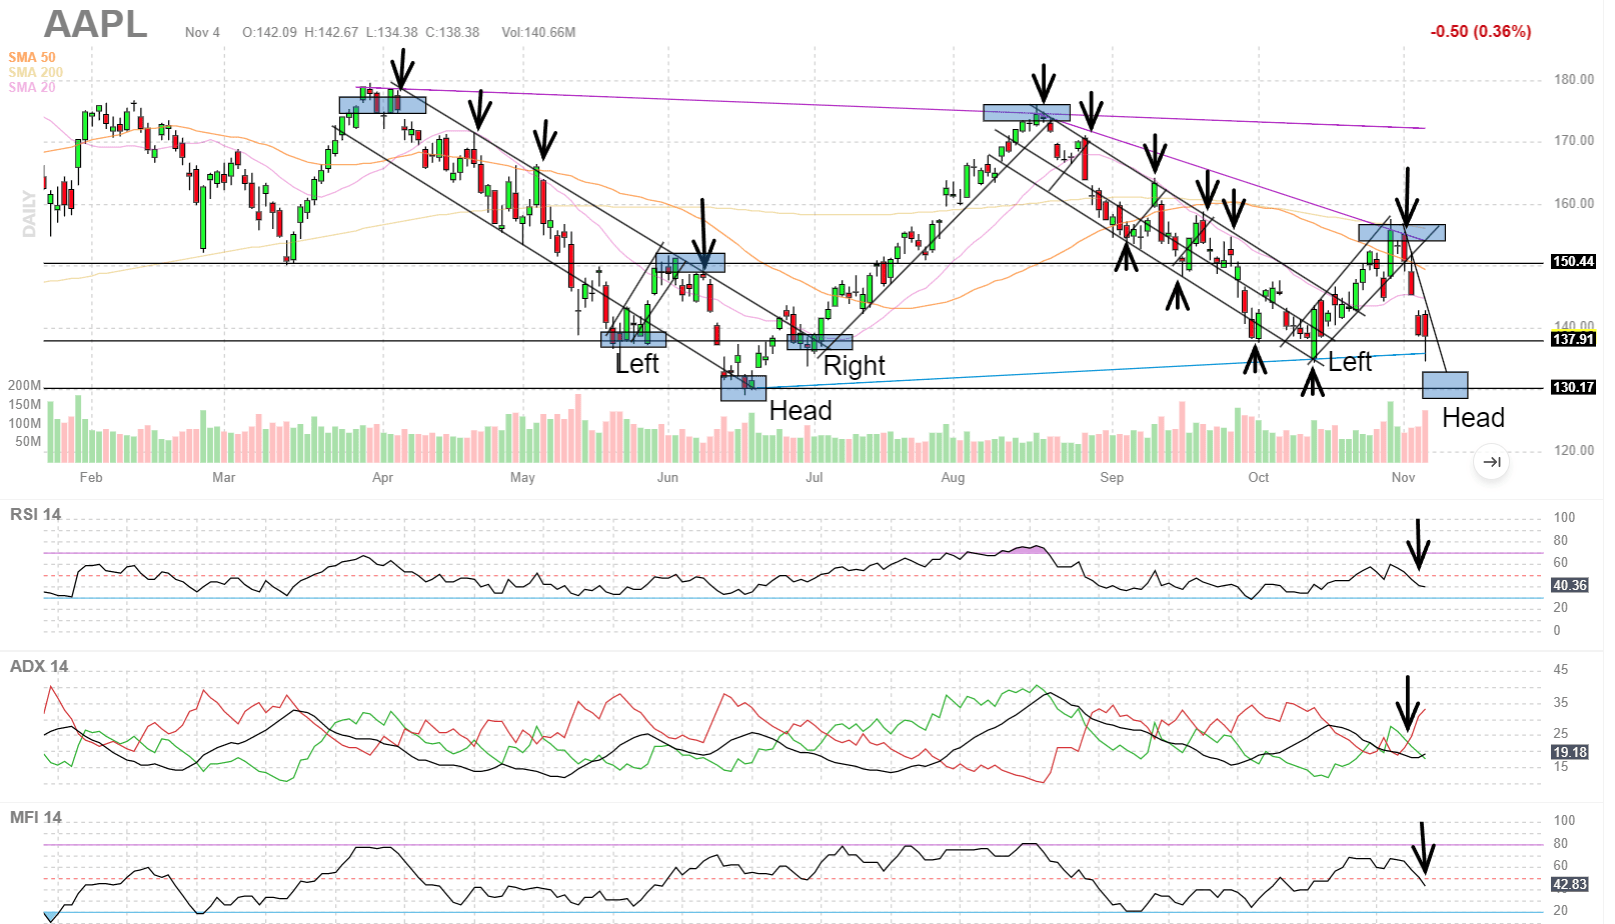
The biggest driver of the FANG mega-cap index is Apple Inc. ( AAPL ). As discussed in many weekly articles, my videos, and recent market posts , Apple continues to be a very good road map of where the markets are headed. The current price action is following the April - June breakdown pattern to 130/share support almost in a perfect repeat of the prior pattern as illustrated below.
Monthly Charts of FANG mega-cap stocks
The question to ask yourself as you review these charts is whether any of the mega caps show that the "market bottom is in." Meta Platforms, Inc. ( META ) has fallen to 2015 levels in the largest selloff since going public and a loss of over -73% of its market cap in 10 months.
FinViz.com
Microsoft ( MSFT ) monthly chart is down -34% YTD hitting new 2022 lows again this week to the lowest levels since 2020. Strongest support is around 200/share on the monthly chart while indicators remain in breakdown conditions.
FinViz.com
Amazon ( AMZN ) monthly chart down -45.4% YTD hitting new lows again this week to the lowest levels since 2020 in technical breakdown below the positive channel from 2015. 100/share had been key support, but the price accelerated lower on Q3 earnings miss and lowered guidance for the rest of the year toward 80/share next strong support.
FinViz.com
Alphabet ( GOOG ) monthly chart holding up better than most down -40% YTD, but only down to 2021 levels and still above the positive channel from 2021. 90/share support was the next strong support last week but now very likely to test 80/share in the negative channel still looking for support.
FinViz.com
The Fed rate decision reaction on Wednesday was the " The Worst Final 90 Minutes " to a Fed day in history.
Even though the Fed hiked exactly as the market expected, the guidance from Chairman Powell of increasing rates and continuing with record QT balance sheet reduction caused the largest negative reaction in the final hours ever recorded.
ZeroHedge.com
You may recall this extreme whiplash on Wednesday as the major market indices rallied on the 75 bps rate hike. That rally was quickly followed by the reaction to Chairman Powell's warning of more rate hikes toward a higher terminal rate to get record inflation under control.
FinViz.com
The Fed hiked to 4% funds rate to the highest level since 2008 continuing the fastest series of rate hikes in US history and well above the trendline from 1980's. Nearly every investor knows this pattern and what happened every time the Fed hit the 1980 trendline.
Yardeni.com VMBreakouts.com
Fed funds rate following a trend line from the 1980's that the Fed has never hiked rates above for more than 40 years until 2022. Every prior peak to the trendline resulted in a recession and a rapid reversal of the Fed rate hike policy. This year the Fed is fighting inflation levels not seen since the 1980's and a Paul Volcker style policy would see fund rates going up to prior highs.
Fred.stlouisfed.org VMBreakouts.com
Bond Market is Going Crazy
Direxion Daily 20+ Year Treasury Bear 3X Shares ( TMV ) also a measure of the long-term bond yields continued to spike sharply higher this week. The highest intervention from the BoJ QE since 1998 gave us a strong rally in October credited with the best October gains in Dow stocks since 1976. That rally is reversing as the Bank of England is restarting their QT policy again that was on pause for October benefiting the markets.
FinViz.com VMBreakouts.com
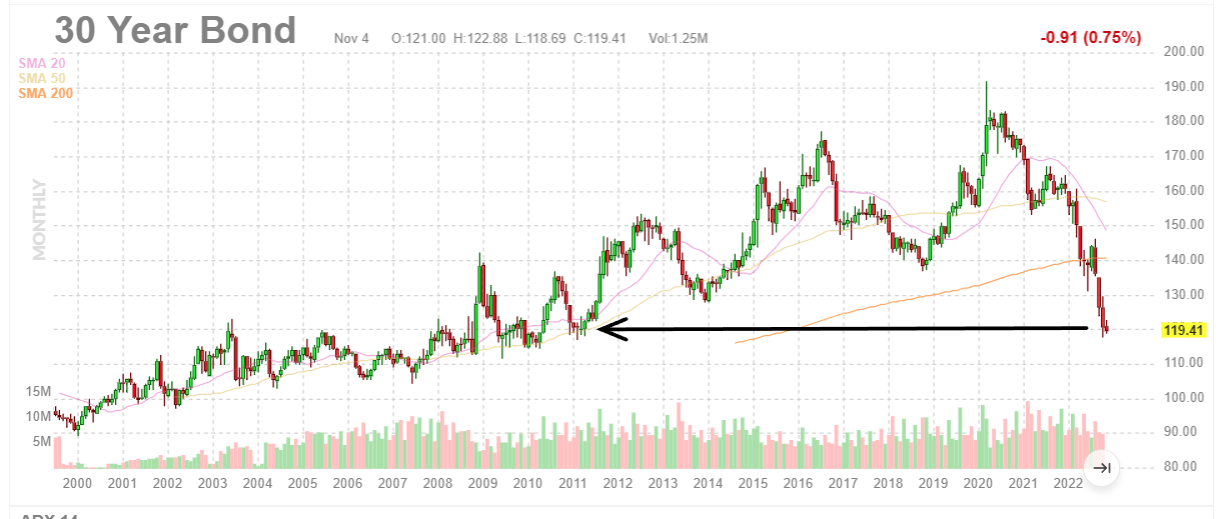
Treasury yields are spiking as the 30-year bond continues to new lows this week back to the lows of 2011. We have heard all year that the bottom was in at 160, then 140 support, then certainly at 130 support to 2014 levels, and now the calls for a bottom may have taken a longer pause after the latest FOMC press conference.
Incredibly, the global central bank policies of reducing their balance sheets in 2022 has contributed to the worst year for 10-year US treasuries since 1788. This central bank roll-off or selloff of balance sheet holdings that were acquired in record amounts to stimulate the markets under the Covid pandemic is having a very negative impact on bond values and sending treasury yields to multi-year highs. The next logical step is that when this bond selloff ends, we could see very large inflows to the bond market to capture these high yields and increasing fund flows away from the stock market's lower dividend yields.
BofA Global Research
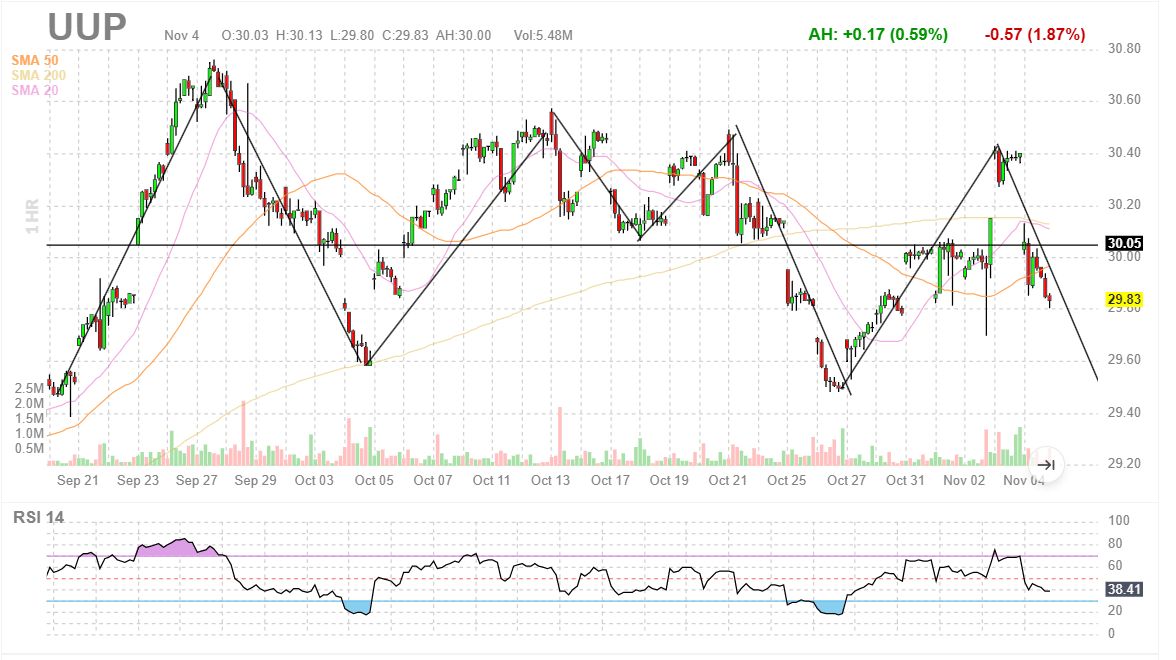
US Dollar index fund ( UUP ) intraday chart from September showing the dollar volatility that now incredibly compares with the volatility of a small tech biotech stock. Central banks especially Japan have been using more than $50 billion of intervention to try to keep the Yen from losing more than 33% of its value against the dollar in the past year.
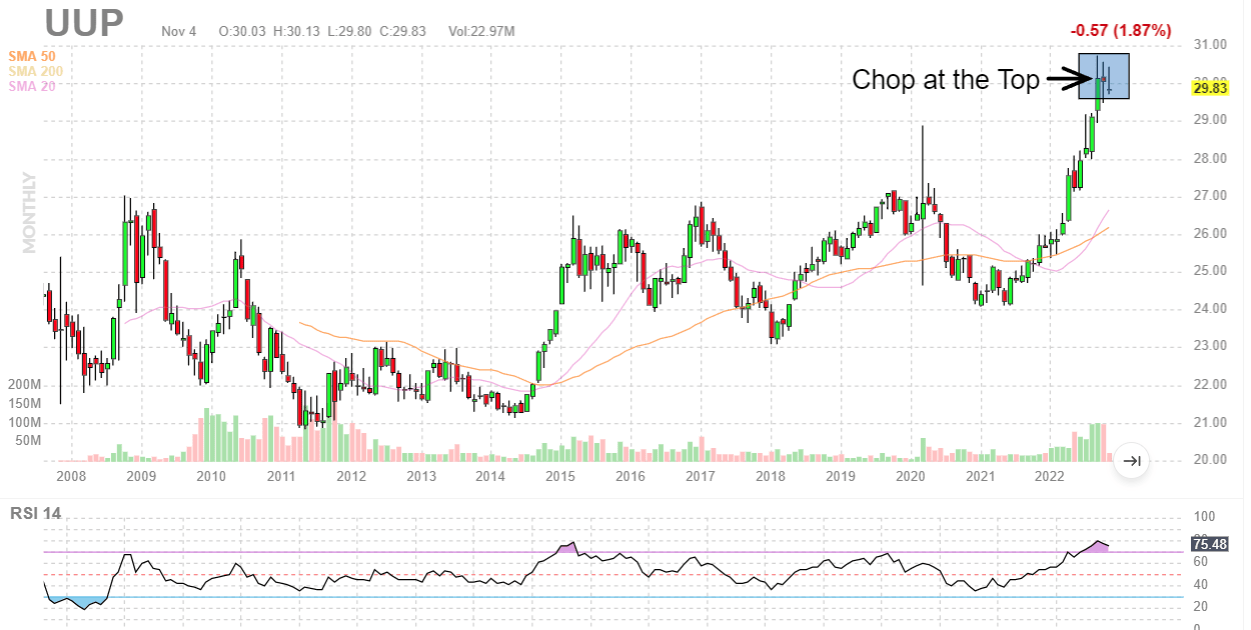
Chop at the Top - extreme volatility as global central banks desperately fight record high dollar values.
US Dollar index fund monthly chart putting context on the intraday chart above with the dollar at the highest levels in decades.
These dollar levels are unsustainable for global markets and central banks around the world are doing everything they can to support their own currencies and battle this brutal rise.
Conclusion
These are unprecedented times. These are the worst markets I can remember in over 30 years of active trading. Additionally, this is the worst economic combination of 40-year high inflation, largest Fed balance sheet QT reduction in US history, fastest rate hikes from 0% to 4% in US history, and the highest US Dollar levels in decades. The most common question I get asked is "What do you think will happen next?" and "How soon will it happen?"
Regular readers of my chat rooms have seen me post these two excellent documentaries many times this year as answers to those critical questions. First, I think as The Flaw (2011) shows, the Fed has not learned from their 2008 mistakes in creating the largest bubble in market history.
Second, I think prior Fed members have shared very good answers in the documentary Money For Nothing (2013) about what happened in the 1980's and what they wish they would have done to prevent inflation and avoid record market bubbles.
These charts reflect many of my warning articles about quantitative tightening this year. The excellent documentaries provide very good context about where we could be headed in this record Fed tightening environment. Ultimately, I hope this information serves you well as you navigate these difficult markets and helps you avoid a hard landing even if the broader market cannot.
All the best!
JD Henning, PhD, MBA, CFE, CAMS
For further details see:
Charting The Worst Market In Over 30 Years Of Trading Toward A Hard Landing