CME - CME Group: Both Sides Of The Coin
2023-08-19 01:05:16 ET
Summary
- The Chicago Mercantile Exchange (CME Group) is a global trading house that offers a platform for trading multiple asset classes and provides market data. It has acquired CBOT, NYMEX, KCBT, and NEX since its IPO.
- CME's strengths lie in its worldwide reach, benchmark-making, and established brand. Its largest contributors to derivatives volume are equity index, treasury, and EuroDollar futures. Electronic trading now makes up 93-94% of total volume.
- Despite having the strongest free cash flow in its history, CME has under-performed during volatile market events due to the counterparty risks it implicitly assumed as a central clearing house.
Investment Thesis
Company Overview
Chicago Mercantile Exchange ( CME ), also known as the CME Group, founded in 1898 as a not-for-profit corporation, went public, and was listed in NASDAQ ( NDAQ ) in 2002. The company is a global trading house that provides worldwide market participants with a trading platform across multiple asset classes, including futures, options, cash, and over-the-counter(OTC) products. It also provides primary price discovery and referential pricing information through its market data in a variety of formats, including real-time, historical, and derived data for customers in both listed and cash products, along with research and analytics tools to provide customers with market education resources. In the subsequent years since its IPO, it acquired CBOT, NYMEX, KCBT, and NEX. It is a global benchmark provider in many derivatives products, such as commodities, equities, FX, cryptocurrencies/alternative investments, and interest rate products.
Strength
Worldwide reach and benchmark-making are CME's formidable signature in the business of global financial trading, and its long history and established reputation, in turn, strengthen its advantage over its competitors. It has several major business lineups: Derivatives, Clearing, Cash Markets, and Data. The company's future growth is expected to come from a few venues, such as new customer expansion, international growth, new product innovation, and OTC alternative products, in addition to increasing its own capital efficiencies. We take a look at each of them.
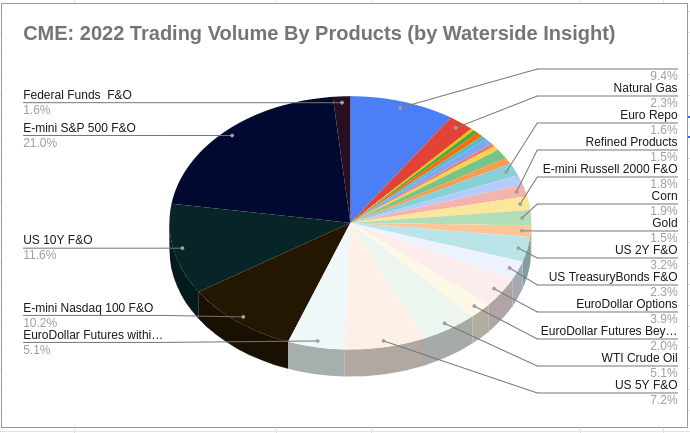
CME's traditional strong suits are commodity futures. But from the chart below, we can see its derivatives volume has a good mix of equity index, treasury, and currency along with commodity products. Even WTI crude oil only accounted for 6.09% of the total volume.
CME: 2022 Trading Volume by Product (Charted by Waterside Insight with data from company)
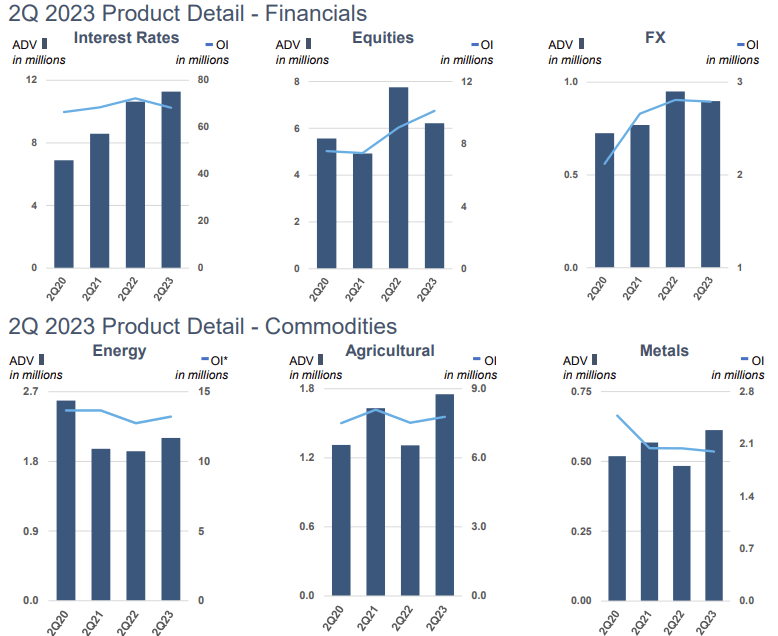
Across the major products' YoY ADV(Average Daily Volume) growth, all but Energy have seen an increase. The largest trading volume increase in Q2 came from interest rates, agriculture, and metal products. It is not surprising given the Fed's rate hike, climatic environment changes and the infrastructure push unleashed by the fiscal policies. They are seen as where the market participants traded most to hedge their risky assets.
CME: Q2 2023 Product Detail (CME Q2 2023 Presentation)
Agricultural and Metal Products totally accounted for about one-tenth of the Interest Rates Products in ADV. So the largest revenue contribution is still coming from interest rates and equity products.
CME: Trading Volume by Product Category (Charted by Waterside Insight with data from company)
CME has the most substantial free cash flow recovery in its history, rising from the lowest in early 2020 and revisiting the high it reached in early 2020. But looking at its history, despite the fluctuations, its free cash flow and net income are almost doubling themselves every ten years. For example, if we pick a point such as the levels in 2008, they almost doubled in 2018. And its current levels of free cash flow and net income are more than double where they were in 2013. This rate of growth is also a reflection of the underlying drivers in the US capital and financial markets - liquidity growth due to the central bank's loose monetary policies in the past two decades since the Great Recession.
New customer expansion:
International Growth: In Q2, CME has seen 16%-34% of ADV increase YoY from energy, to metal to agricultural products, while Options ADV up 26% and Interest Rates up 14% in 1H YoY. Outside of the US, which accounted for about 29% of CME's customer base, the company's reputation is still most strongly connected with commodities products.
New Product Innovation: In the latest move, CME continues expanding in the most significant piece of the pie, the E-mini products, whose ADV was up 36% to a record $3.4 million, on top of numerous other options and futures products that extend its dominance in the derivatives space. From the list of its production innovation in the past two years, we can see they are concentrated in the E-mini and Micro products, Cryptocurrency derivatives, Fixed Income, Emission, Commodity, and benchmark-making products.
CME: Product Innovation 2021-2022 (Company 2022 10K)
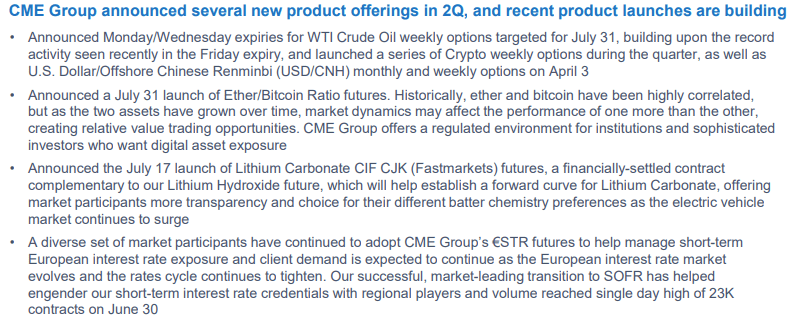
These in fact are the areas it continues to push out new products this year when it announced in Q2 to meet market demands, as they are related to macro (fixed income), retail investing, financial innovation themes , and the company's traditional strong suits in commodity and benchmarks.
CME: Product Innovation in Q2 2023 (Company Q2 presentation)
OTC Alternative Products: OTC premium-priced services came in mostly from Total Return futures, Commodity Index products, BTIC, Dividend futures and Select Sector futures within the Equity Index products. It is also providing more of such products in the interest-rate-related space. Along the line, for alternative products, CME also offers alternative clearing services for positions established on its platforms or to freely move open positions among clearing houses in order to take advantage of its deep liquidity provisions. These added advantages could help it to strengthen its relationships with deep-pocketed clients.
Capital Efficiency: CME Group and DTCC (Depository Trust & Clearing Corporation) have jointly announced enhancements to their existing cross-margin arrangement within the deepest and most liquid market of treasury bonds, pending regulatory approval, to come in early 2024. Notice that the announcement came not only for the US market, but also to the investors in London, Hong Kong, Singapore, and Sydney. It is no doubt that the company is targeting institutional investors at home and abroad who have high credit profiles in trading these products.
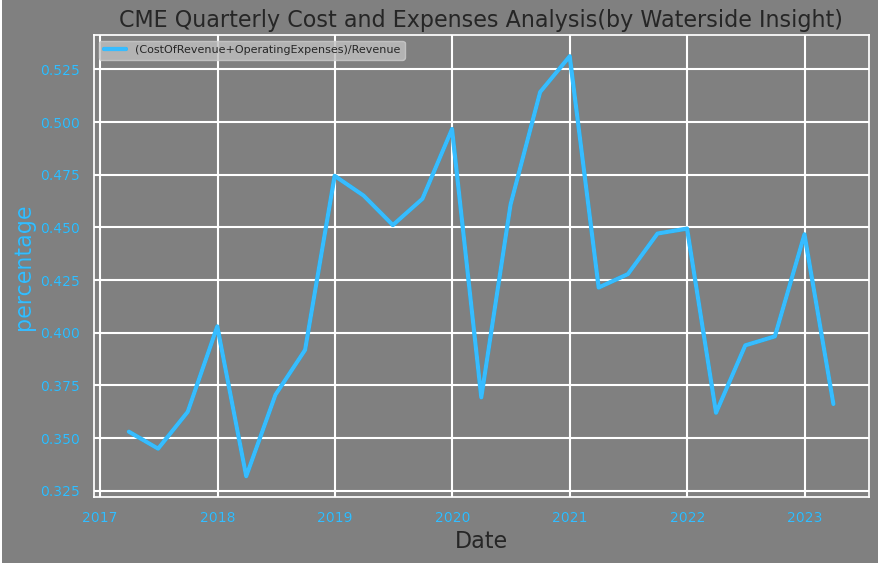
Lower costs and expenses also play a part in increasing its capital utilization. Given the pace of its growth, it is impressive to see it has slashed the cost and expenses from around 50% of revenue peak in 2021 to currently at around 35%. In the meantime, its CapEx has also fallen from almost $7 billion in 2020 to currently just under $1 billion.
CME: Costs and Expenses analysis (Calculated and Charted by Waterside Insight with data from company)
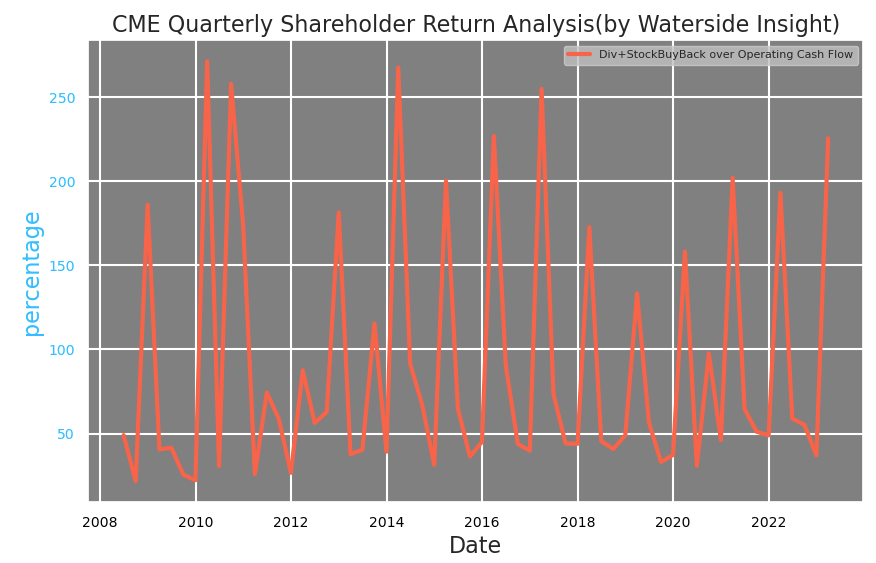
As a dividend grower's favorite, CME consistently spent about 1.5x-2x of its operational cash flow in the form of stock buybacks and dividend payouts. It maintains the level of giving back to shareholders within a range that seems to be sustainable.
CME: Shareholder Return analysis (Calculated and Charted by Waterside Insight with data from company)
Weakness/Risks
In Q4 2021, CME started recognizing cash performance bonds and guaranty fund contributions as restricted cash and cash equivalents. This changed its beginning and ending period of cash, and reflected in its net cash flow through the item of cash flow from financing activities. Since then, its net cash flow has become much more volatile.
CME: Net Cash Flow Breakdown (Bloomberg)
The PG Funds have been the most significant source contributing to the net cash flow change.
CME: Performance Bonds and Guaranty Fund Contributions vs Net Cash Flow (Charted by Waterside Insight with data from the company)
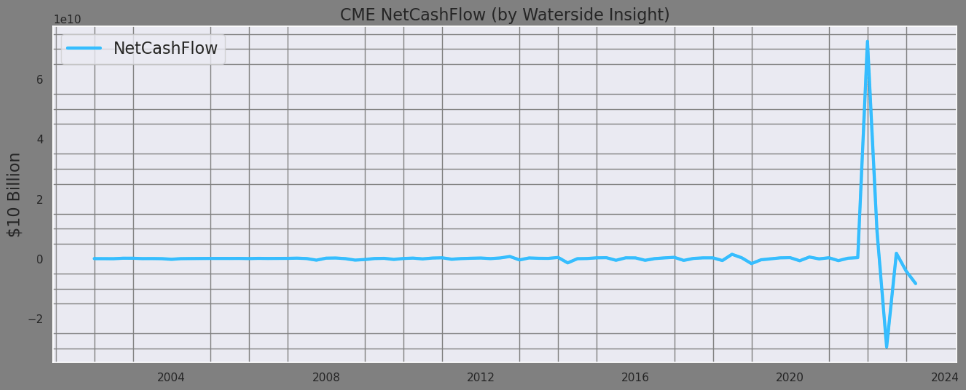
On a TTM basis, the changes have been on a much high order of multiples over the past net cash flow both on the upside and the downside. This kind of volatility in net cash flow will be alarming for any other company, but for CME because of the unique nature of its business handling financial trading based on efficiency and margin, we look at it in a different way.
CME: Net Cash Flow (Charted by Waterside Insight with data from company)
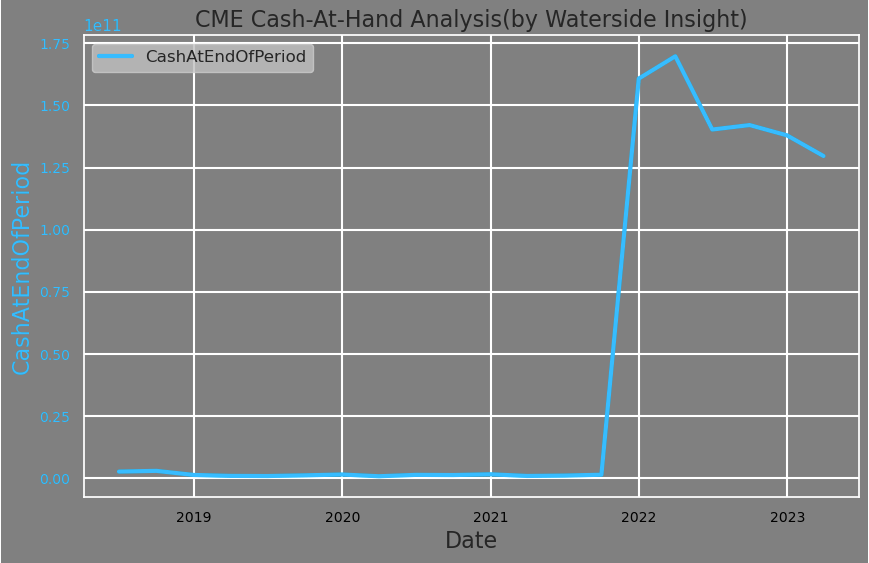
This change in accounting naturally boosted the company's cash-at-the-end period. But a large portion of its cash-at-hand is deposited in the Federal Reserve Bank of Chicago maintaining an authorized cash account, due to the fact that CME is designated as a systemically important financial market utility by the Financial Stability Oversight Council. That level at the end of Q2 is about $100.3 billion, which left about $30 billion on its own book outside of the Federal Reserve's system.
CME: Cash-at-hand analysis (Calculated and Charted by Waterside Insight with data from company)
Without knowing the exact amounts of its performance bonds and guarantee fund contributions (PBAGFC), we see CME does disclose the earnings from reinvesting the contributions and the distribution of the interest earned from it to the clearing firms. The earnings are reflected in the investment income, while their expenses related to the distribution of interest earned are counted in other non-operating income/expense. In the past three years, since it changed the reporting rule, CME has ever-increasing reinvestment income from PBAGFC, reaching $1.5 billion in Q2 this year, up from only a few million on a quarterly basis just three years ago. Even after subtracting the distribution, the net reinvestment income is still up from just $2.5 million in Q1 2021 to $114.8 million in the last quarter. The impact of this on the total net income of the firm has increased to mid-teens to over 20%. In part, it could be due to the higher interest environment as CME revested most of it in bank deposits, government securities, reverse repo, and money market funds. But on the other hand, investors should also take note that it also increases the risk exposure to financial market volatility more than just the trading volume and flow.
CME: Performance Bonds and Guaranty Fund Contributions Reinvestment Income (Calculate and Charted by Waterside Insight with data from company)
In the year 2022, when the market had higher volatility and a large correction, CME's stock price went down with the majority while generating about 30% growth in its free cash flow YoY. This is because the clearing firms and counterparties that traded with the house were under stress. In a situation like this, even though the house itself stands strong, the environment it operates in was nonetheless impacted. One of the channels, now more than before, could be from their PBAGFC reinvestment income. The others will naturally be requiring a higher amount of guaranty fund contribution. Counterparty risks are something no analyst would talk about out loud regarding CME, because it is like saying the house might fall that nobody wants to hear. But that is not what we are saying here at all. The truth is, it doesn't need to ever become that extreme to have an impact on the company. That is why over and again, when the majority of the market is under stress, that stress will only be amplified at the central clearing house, and in turn, will impact its business. This is the very definition of being the house - assuming central risks of the market. We call that the other side of the coin, as in, the other side of the same business. On one side, it is benefiting from trading volume when stress and volatility heighten, on the other side, it assumes more market risks broadly and counterparty risks individually. So it is only fair that the market will trade it down to de-risk.
Is that the right thing for the investors to do? The last time it fell heavily after the Great Recession was in '08, and it took the company about ten years in 2017 to reclaim its previous high reached in 2007. While in the two episodes of the last three years' milder sell-offs, it rebounded quickly. So when the retail investors bought into CME on the premises of assuming the benefits of being the house, they are also implicitly assuming the risk side as well.
When we visited the CME trading floor almost twenty years ago, we were fascinated by the hand gestures of the traders. Nowadays, electronic trading volume has taken about 93-94% of the total volume. Making the prominence of the open-out-cry trading floor a thing of the past. The introduction of the electronic execution system brought with it increased resilience to risk management at CME. Swift detection, correction, and iteration can now be rapidly implemented. And more than a decade of financial stability regulatory overhaul has also made our financial system more sound and transparent. Except there is always this "unknown unknown" lurking in the shadow. The electronic system has also made the risk dispersion much faster than in any scenarios in the past. The recent deposit withdrawal from the regional banks is proof of our modern-day financial environment. Not to mention the complicated math behind the algorithmic trading in the major markets, which is a major source of liquidity provision in the financial markets, was more than once exposed with flaws during the past sell-off episodes. In short, to answer the question, we believe the market was doing the right thing to de-risk when the sell-off comes.
Financial Overview
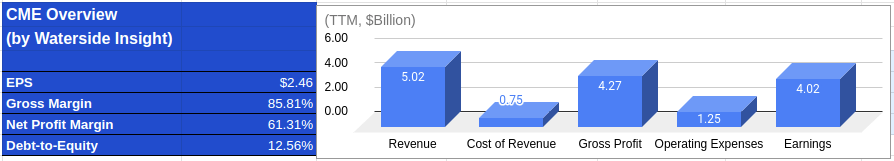
CME: Financial Overview (Calculated and Charted by Waterside Insight with data from company)
Valuation
Just as the market largely ignores the sharp changes in the company's net cash flow, conventional ways to assess its fair value don't capture the whole picture either. Anyone who values the house as any other individual participant in the market is simply approaching this with flaws. Based on our analysis above, we use our unique proprietary models to assess the fair value of CME by assessing risks and growth comprehensively. We believe where the stock is trading right now is at or above its fair price. Currently, the liquidity-liability-over-GDP ratio for the US is at about 90%, while historically from 1960 up to 2020, the average value of this ratio is at about 70%. There is further liquidity contraction coming, no matter whether the Fed is going to continue hiking or not. Being the central clearing house, CME is hard to outperform when the broader market is trading with less liquidity. We think a local peak has been reached for the stock.
Conclusion
As one of the most successful and innovative financial exchanges in the world, CME commands a premier brand and delivers strong performance over and again through its execution and sound financial management. We remain a fan of the company. However, its central clearing function that implicitly assumes the fundamental market risks will prompt us to consider what the implication of a credit and liquidity tightening environment will be for the company in the near term. To balance the two sides of its operation, on one hand, it benefits from the increased volume along with higher volatility, and on the other, it also bears the implicit counterparty risks broadly and idiosyncratically. We think at the current price, the company is a hold.
For further details see:
CME Group: Both Sides Of The Coin