CME - CME Group: One Of The Best High-Yielders On The Market
Summary
- CME Group is my worst-performing dividend stock, as I'm down 17%.
- However, I'm even more bullish now as the company offers tremendous value at these prices.
- CME generates a lot of cash, has solid growth rates, and has a recession-proof business model.
- One of the biggest concerns is falling contract rates. However, there is no indication that the company is losing pricing power.
Introduction
The other day, I wrote an article titled "Union Pacific: The More It Drops, The More I Buy". The reason I'm bringing this up is that this strategy also applies to Chicago-based CME Group ( CME ), one of my favorite dividend growth holdings. Unfortunately, I already bought so much this year, as I used its stock price weakness to expand my exposure in the finance sector.
In this article, I will once again walk you through my thoughts as we head into 2023. While CME Group looks like dead money now, the opposite is true. The company continues to hit it out of the park. It just announced a record special dividend as it benefits from strength in all major trading segments, including energy, major indices, agriculture, and rates.
Unfortunately, one of the company's biggest issues is a decline in rates per contract ("RPC"). However, these fears are overblown as new products and discounts of the past are now set to halt the decline. Moreover, what the company lost in RPC, it more than made up in higher volumes from successful new products like micro futures.
Long story short, I will make the case for a seriously undervalued dividend growth stock, which might be a great fit for your portfolio.
So, let's get to it!
Why I Bought CME Group - What's CME?
I own two other stocks in the financial sector.
- Huntington Bancshares ( HBAN ) - a Midwest regional bank
- Nasdaq Inc. ( NDAQ ) - the owner of Nasdaq exchanges
Buying CME was based on buying a company with a dominant position in an important industry. This lowers competition risk and it makes it very hard to replace CME Group.
Founded in 1898 as a non-profit, CME has turned into an exchanges powerhouse. CME is the world's largest provider of futures and related options in all key segments.
The company owns agriculture futures like CBOT corn, wheat, and soybeans, which are key global benchmark futures. The company owns COMEX gold, silver, and copper futures, which are the most traded global metal futures. Moreover, the company owns the world's most liquid and traded indices futures, including the e-mini contract (S&P 500), which you may be familiar with.
Moreover, as the overview below shows, close to a third of total revenues are generated in the interest rate space. While this includes swaps clearing and BrokerTec, a platform that facilitates electronically traded US and European fixed-income contracts, it makes a lot of money from products like Fed Funds futures, SOFR (the eurodollar replacement), and all US treasuries across the curve.
CME Group
Not only does this mean that the company has consistent income, but it also means that recessions/market drawdowns aren't always a bad thing.
While prolonged recessions that reduce market activity are a risk, short recessions and market sell-offs are opportunities. After all, it means that volatility rises. That's perfect for CME Group.
Especially this year, we had the following tailwinds for CME Group:
- Stocks were extremely volatile all year
- The war in Ukraine increased already high agriculture and energy volatility
- Rates surged across the board as the Fed started its most rapid hiking cycle in modern history
The chart below is from the third quarter, but it still shows that volatility was everywhere. Stocks, bonds, and currencies. There simply was no hiding.
Bloomberg
Before we dive into the financial performance details, I need to elaborate a bit more on why these things are good for CME Group.
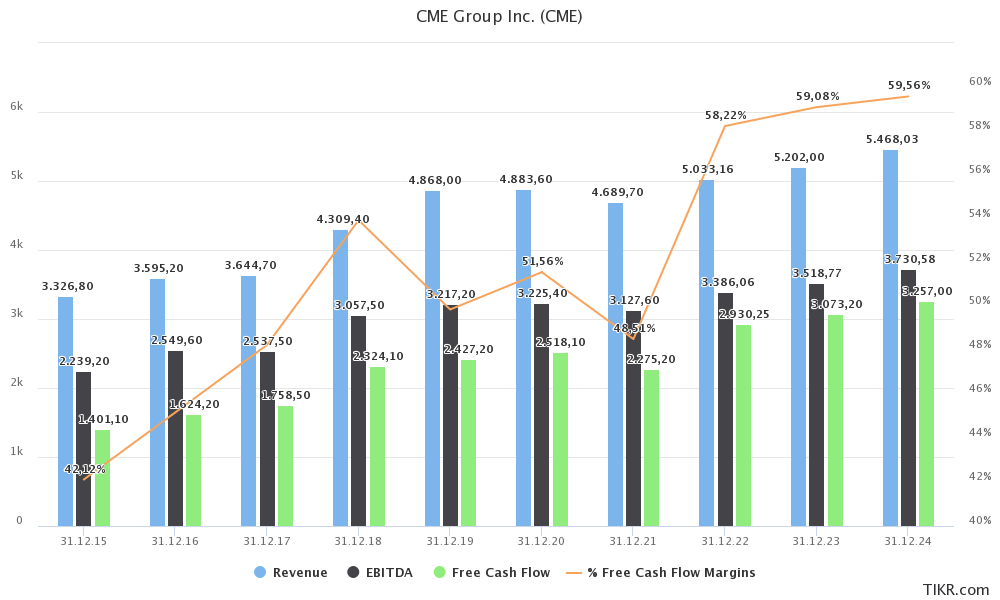
Well, as the chart below shows, the company has consistently grown key financial numbers like free cash flow and EBITDA. If I had erased the x-axis from the chart below, would you have been able to point at the Great Financial Crisis? What about the pandemic?
Both the housing crash and the pandemic caused CME Group to make more money. While stock prices (including CME shares) fell during recessions, as investors de-risked their portfolios, the CME business did well. The stock price usually starts rising again once market confidence returns. Even if that often means that the company will need some time before it can grow free cash flow again. It's hard to beat volumes and income growth generated during recessions.
But that's not a problem. Investors just need to be aware of what they are buying and how to interpret the numbers.
With that said, here's how CME Group is currently doing - especially in light of the product breakdown we just discussed. After that, we'll get to the dividend.
Recent Developments - High Volumes & Contract Rate Headwinds
As we already briefly discussed, 2022 is shaping up to be an awesome year. The company is on track to generate record revenue, EBITDA, and free cash flow this year as it benefits from high market volatility in all categories, and the need for producers and buyers to hedge production costs in uncertain times.
TIKR.com
To show you how strong 2022 has been, I'm using the company's own words by highlighting a 3Q22 earnings call comment:
Our volume is up 23% year-to-date versus the same period last year, and up 19% from the same period in 2019 prior to the pandemic. The highest average daily volume quarter in CME's -- Group's history was Q1 of 2020 when risk management was critical at the onset of the pandemic. The first 3 quarters of this year have been the second, third and fourth highest ADV quarters in our history.
In the third quarter, the average daily volume ("ADV") was 22.4 million contracts, an increase of 26%, primarily driven by:
- Interest rates: +28%
- Equity indices: +46%
- Foreign exchanges: +41%
On top of that, the company is on pace for record sales wins, as it is looking to double new sales wins. This includes client conversion to SOFR and cross-sells wins. Even excluding the move to eurodollar replacement SOFR, the new win growth rate is 34%.
The company is also witnessing higher in-person meetings, driving sales growth, and 100 million unique views on its website CMEGroup.com.
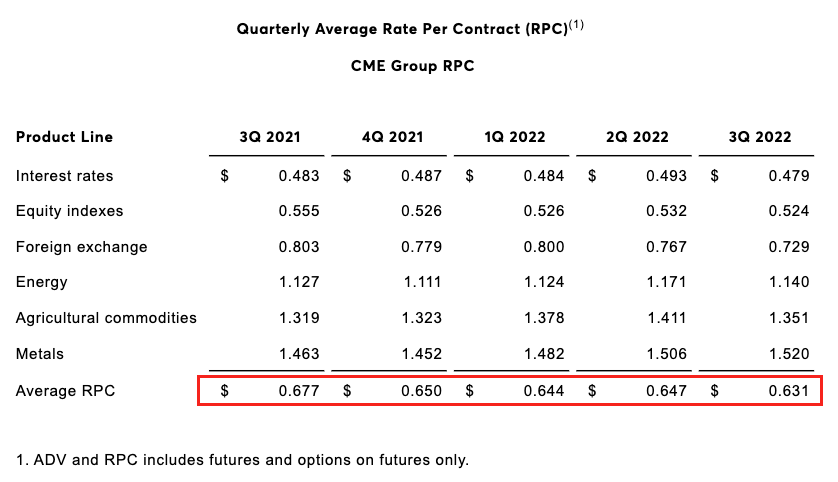
With that said, there's one issue that isn't doing CME any favors. The company's rates per contract ("RPC") have declined steadily in the past. In 3Q21, the number was $0.677. Now, it's $0.631. That's a decline of 6.8%.
CME Group
Investors are afraid that CME is losing pricing power. If that were the case, it would be a bad thing.
However, these risks remain limited.
First of all, the RPC is not necessarily a good indicator of pricing power. In its 2021 10-K the company highlighted the unreliability of this financial metric:
Our average rate per contract for our derivatives business, which impacts our operating results, is subject to fluctuation due to shifts in the mix of products traded, the trading venue and the mix of customers (whether the customer receives member or non-member fees or participates in one of our various incentive programs) and the impact of our tiered pricing structure.
As CME Group has a lot of different products with varying rates (as the table above shows), one can imagine that this impacts the average RPC a lot.
Needless to say, a rising RPC is still what investors and the company want to see. This decline isn't perfect, but there are good reasons for it.
- The company had market-wide fee waivers in June, July, and August. These were removed at the end of August.
- The company had significant liquidity incentives in June, July, and August. These, too, are gone.
- CME still has above-average incentives for eurodollar futures and options. These will be reduced.
- RPC for SOFR options is expected to be strong, which will positively impact RPC in 4Q22.
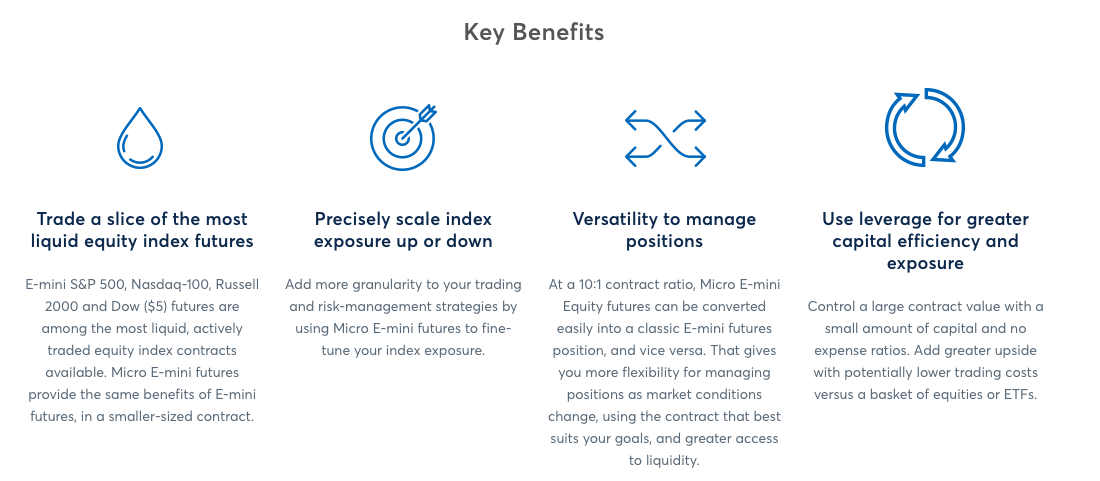
Moreover, it is important to view lower RPCs as a way to boost volumes. For example, CME has Micro E-mini contracts (allowing traders to trade the S&P 500 and other indices with less margin). These are about 1/10 the size of the E-mini contract. However, they are about 1/4 to 1/3 of the cost. This means that CME has deliberately chosen to sacrifice RPC growth for the sake of volumes. I believe that is the right decision as these products are what drive CME's success.
CME Group (Micro E-Mini Benefits)
It also gives CME an edge as it allows smaller traders to gain access to the S&P 500. Versus 2021, the micro S&P E-mini has grown by 57%. The spot ETF is up a little over 30%, according to CME.
Now, with that said, let's discuss what I assume is the main reason you're reading this article.
The CME Dividend
Discussing the CME dividend is different from your average dividend growth stock. CME Group pays a special dividend every year, which it uses to distribute almost all of its excess cash.
For example, on December 8, the company announced a $4.50 per share special dividend payable on January 18. After paying a special dividend of $3.25 in 2021, it's the company's highest special dividend ever - and a result of record free cash flow.
The company's regular dividend is $1.00 per share per quarter. That translates to a 2.4% regular yield. The total yield incorporating the special dividend is 5.1%. The 10-year average annual growth rate of the regular dividend is 8.7%.
That's a decent number. However, we can neglect that as the variable dividend is so important. Essentially, we can focus on free cash flow only, assuming the company will continue to distribute most of that.
Between 2015 and 2024E, the average annual FCF growth rate is 9.8%, which means the total dividend is expected to grow at a decent pace.
In other words, the company isn't just a dominant financial player, it is also a fantastic source of cash - the regular dividend and its growth rate alone would make CME attractive.
However, thanks to just $970 million in expected 2023 net debt (less than 0.3x EBITDA), there really isn't a reason to prioritize debt reduction over shareholder distributions. Its balance sheet is AA-rated. Also, the company has no need for growth capital.
But then again, if the company were to become more growth-oriented, investors would still enjoy a decent regular dividend.
Valuation
CME shares are down roughly 35% from their 52-week high. The most recent decline of more than 3% shown in the chart below is caused by the stock going ex-dividend.
FINVIZ
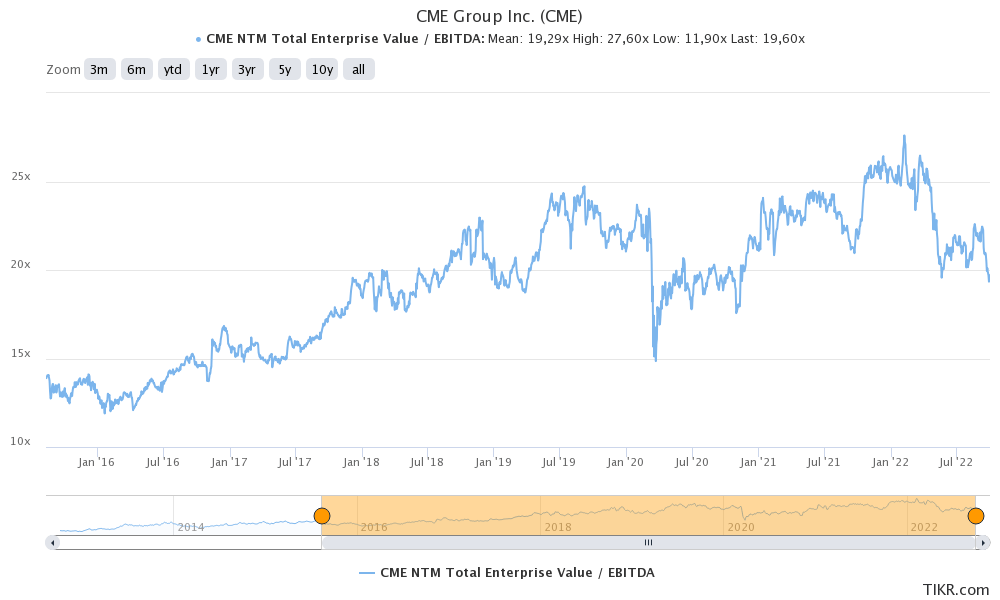
The company is now trading at 17.5x 2023E EBITDA of $3.5 billion.
While that may seem like a lot, it is the lowest valuation in more than four years.
TIKR.com
Also, as I said in my prior CME article:
It is highly common that stocks that spend almost all of their free cash flow on dividends are trading at rather high EV/EBITDA ratios. That's OK as long as the free cash flow margin is high. And that's definitely the case here.
CME is expected to maintain a >5% FCF yield going forward, which is a great deal.
Takeaway
CME Group is my worst-performing dividend stock at the moment. However, I am far from worried. CME Group is a great buy on weakness like we're currently witnessing. The company has a stellar business model and it dedicates most of its free cash flow to its regular and special dividends.
I believe that the stock price decline is a mix of investors de-risking their portfolios (the market is doing poorly as well), and fears that the company may be stuck with lower average rates per contract on top of lower volumes after the recession.
However, these contract rate fears are unfounded as the company knows what it's doing. Lower contract rates are boosting volume growth. Moreover, 4Q22 rates will likely look better as the company has ended a number of incentives.
I would be buying much more CME Group if I hadn't bought so aggressively this year. Depending on other investment plans, I will try to buy more in 2023, as I truly believe in the power of CME Group to deliver long-term shareholder value.
(Dis)agree? Let me know in the comments!
For further details see:
CME Group: One Of The Best High-Yielders On The Market