CME - CME Group: Still The Perfect Fit For An All-Weather Portfolio
2023-09-21 10:00:00 ET
Summary
- The article discusses CME Group's performance year to date, with a focus on the current interest rate environment and volatile equity markets.
- The company beat both revenue and earnings estimates in Q2, and key performance indicators such as ADV and average RPC confirm continued strong performance.
- While interest rate and equity index-related products continue to be primarily responsible for the strong performance, investors shouldn't underestimate the potential of CME's market data and information segment.
- Since my last article, CME stock has gained nearly 20% - I explain why I still think it's a buy.
Introduction
CME Group Inc. ( CME ) is one of those companies that rarely gets a closer look because of its apparent complexity. Financial stocks like banks, with their complex balance sheets, are already pretty hard to understand, so an exchange operator and financial risk management company really sounds like a candidate for the "too hard" pile. However, CME is not that difficult to understand (see my first article to get a good understanding of the business), and the stock definitely deserves its place in a well-diversified all-weather portfolio. In that article, I also explained why the stock is an attractive candidate for dividend growth investors and yield-focused investors alike.
In this update, I share my thoughts on the company's latest earnings report - against the backdrop of a continued rising interest rate environment and volatile equity markets. I also explain why I still think CME stock is a buy, even though it has risen about 18% since my first article got published.
CME Group – Q2 Earnings Review
The company beat analyst estimates on both adjusted quarterly earnings per share (EPS, $2.30) and revenue ($1.36 billion). Both EPS and revenue were down from the previous quarter, but up 17% and 10% year-over-year, respectively, showing that CME continues to benefit from the current environment.
Of course, it is important to watch for unusual earnings adjustments that could indicate possible financial engineering. CME's adjusted quarterly earnings per share were 7.5% higher than GAAP earnings, primarily due to the amortization of acquired intangible assets. I believe these adjustments are acceptable given that CME makes acquisitions on a more or less regular basis and the acquired assets benefit the company over the long term and beyond the required amortization periods.
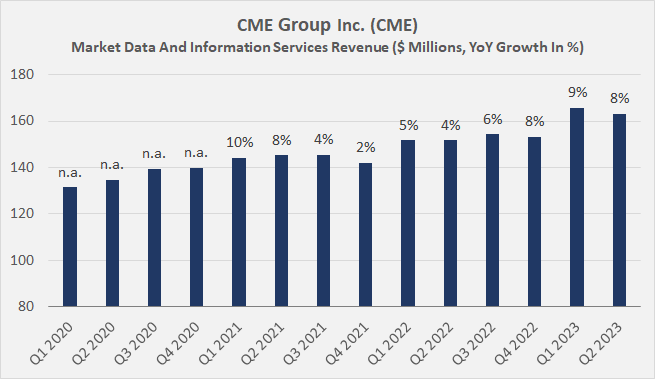
Before I go into more detail about the results, it is worth noting that CME generates a modest percentage of its revenues by offering information services and access to market data. Although this segment accounted for only about 12% of total revenues in 2022, it is worth noting that the segment has grown at a CAGR of about 5% since 2009, and investors should also keep in mind the increasing adoption of artificial intelligence, which I believe will significantly increase the long-term value of the data collected by CME. The segment's revenue growth has accelerated in recent years (Figure 1, 5.8% CAGR based on three-year TTM figures), but I believe we are still at a very early stage, and I particularly like CME's market-leading position in this context.
Figure 1: CME Group Inc. (CME): Quarterly market data and information services revenues since 2020 (own work, based on company filings)
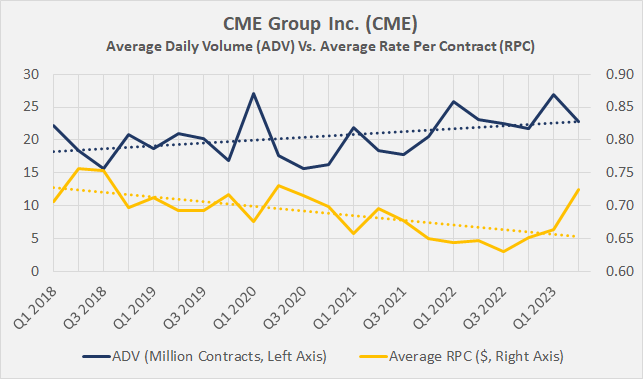
With CME, it is important to focus not only on profit and revenue growth but also to look at key performance indicators such as average daily volume ((ADV)) and average rate per contract ((RPC)).
In my last article, I discussed the development of ADV and RPC since the Great Recession and explained why I don't think the steady decline in RPC is a cause for concern. In short, average RPC is highly dependent on the product mix traded, and recently introduced trading instruments have comparatively low RPC. In my opinion, the combination of steadily growing ADV, lower RPC, and emphasis on low-cost (but proportionately more expensive) derivatives bodes well for CME revenue growth and profitability. Also, keep in mind that CME's ADV has grown at a CAGR of about 6% since 2009, while average annualized RPC has declined by only 2% per year on a compounded basis.
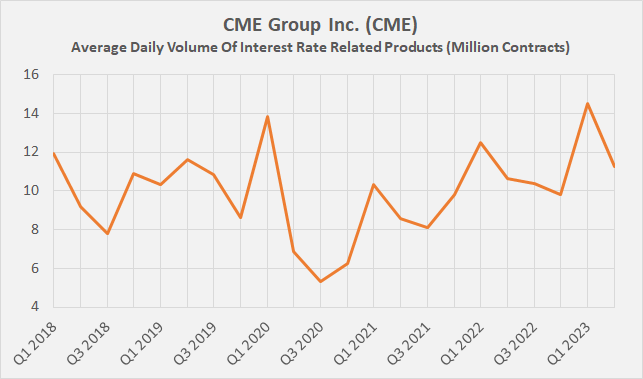
As Figure 2 shows, both long-term trends remain intact. However, in Q2 2023, CME's ADV was down from the previous quarter (-15%), but I would not over-interpret this figure due to volatile demand for interest rate-related products (about 50% of total ADV). In the first quarter, CME saw sequential ADV growth of almost 50% (Figure 2), so the decline in the second quarter should be seen as a sign of normalization as the Fed nears the end of the rate hike cycle, and of course against the backdrop of the banking crisis (see my detailed discussion ). At the same time, Figure 3 suggests that market participants expect interest rates to remain higher "for longer," as demand for hedging products is still high by historical standards.
Figure 2: CME Group Inc. (CME): Quarterly average daily volume versus average rate per contract since 2018 (own work, based on company filings) Figure 3: CME Group Inc. (CME): Average daily volume of interest rate related products since 2018 (own work, based on company filings)
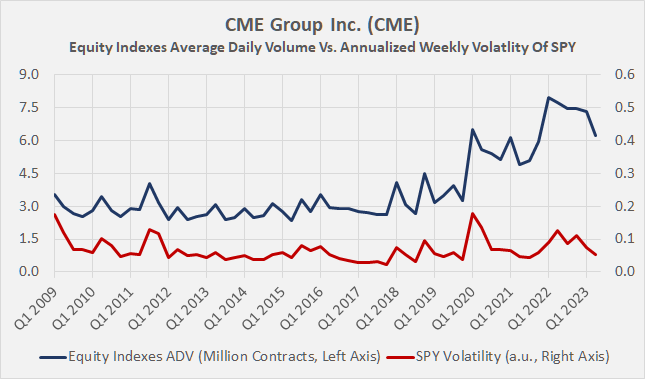
Average RPC rallied strongly in the first and especially the second quarter of 2023, driven primarily by equity index and energy-related products. This makes a lot of sense when looking at the year-to-date performance and volatility of the major equity indices and oil prices, and it turns out that management's decision to place a growing emphasis on equity index derivatives over the years was a very wise one. Figure 4 illustrates how CME's focus on equity index derivatives (about 30% of total ADV) paid off over the years. The decline in Q1 and also Q2 2023 correlates well with the decline in volatility using the annualized weekly volatility of the S&P 500 ( SPY ) as a proxy. As an aside, I was pleased to read the recent announcement that CME is now offering micro-sized gold derivatives to capitalize on the growing demand, especially from retail investors.
Figure 4: CME Group Inc. (CME): Equity indexes average daily volume versus annualized weekly volatility of SPY since 2009 (own work, based on company filings and the daily closing price of SPY)
Summary And Conclusion: Is CME Stock Still A Buy After The Rebound?
All in all, CME has been a solid performer so far in 2023, and I continue to believe the stock is an excellent addition to a long-term, well-diversified portfolio. While the stock is naturally volatile during times of general market turmoil, I believe investors should focus on CME's unique position that allows it to profit in a difficult environment. Ultimately, what matters is a company's earning power and not so much its short-term stock performance. I think it's best to view CME stock as a "hedging" or "risk-management" position. This is also underscored by its solid dividend growth in 2008 and coming out of the Great Recession, as I explained in this article .
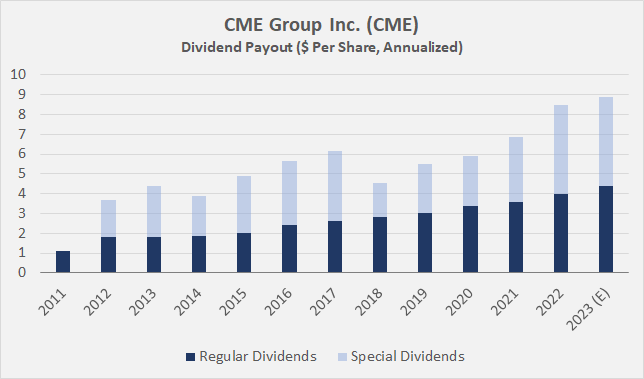
In addition to strong sales and earnings performance, excellent cash flow conversion (93.5% in the first half of 2023), and solid profitability (GAAP operating margin of 62.5% in the first half of 2023, high 60% range on an adjusted basis), I also appreciate management's continued emphasis on dividends, which is also evident when reading the earnings releases and listening to the earnings calls. The company adopted a variable dividend policy in 2012 and has since paid out nearly $22 billion to shareholders, representing nearly 30% of the company's current market capitalization. The company expects to maintain its variable dividend policy (Figure 5) and, according to management , is not currently considering share repurchases. I really like the transparency and flexibility of this approach. The dividend is well covered by free cash flow (see this article by fellow contributor Waterside Insight for a detailed discussion of CME's cash flow volatility).
Figure 5: CME Group Inc. (CME): Ordinary quarterly and variable dividends declared each year since 2011 (own work, based on company filings and own estimates)
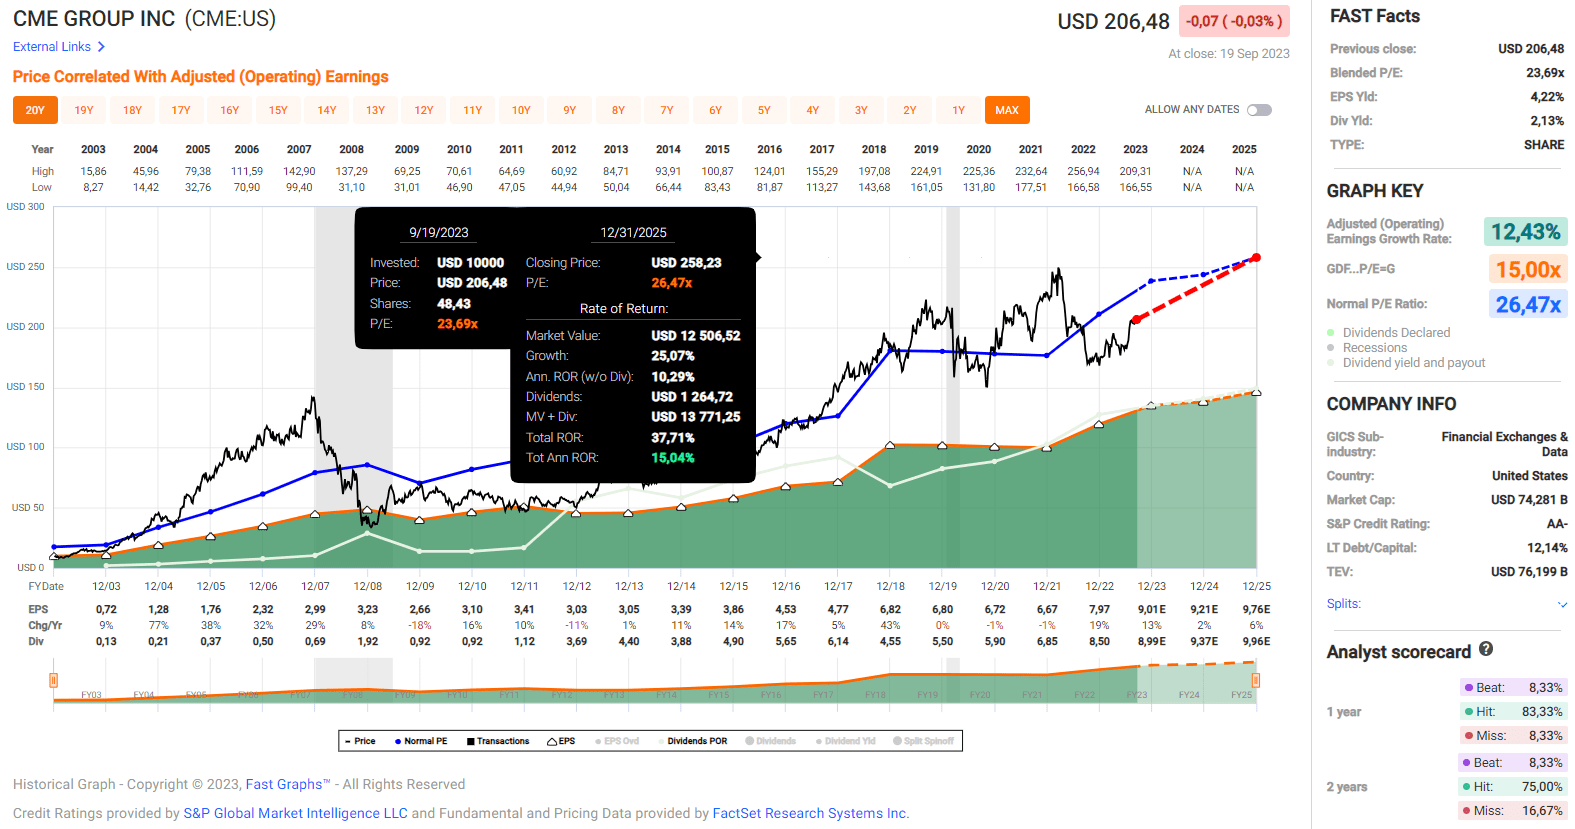
CME Group stock currently yields 2.1% based on the regular quarterly dividend, about 20% above the five-year average yield but well below that of long-term government bonds (e.g., 4.3% for the 10-Year Treasury ), making the stock look very unattractive as a dividend stock. However, consider the special dividend, which will likely bring the full-year dividend yield in line with 10-Year Treasury, and the solid 10-year dividend growth rate (9.3% CAGR for the regular dividend and 7.3% when including the special dividend). I think it is reasonable to expect continued strong dividend growth going forward, based on solid fundamentals and earnings growth expectations (see EPS revisions and Figure 6).
Figure 6: CME Group Inc. (CME): FAST Graphs chart based on adjusted operating earnings per share (FAST Graphs tool)
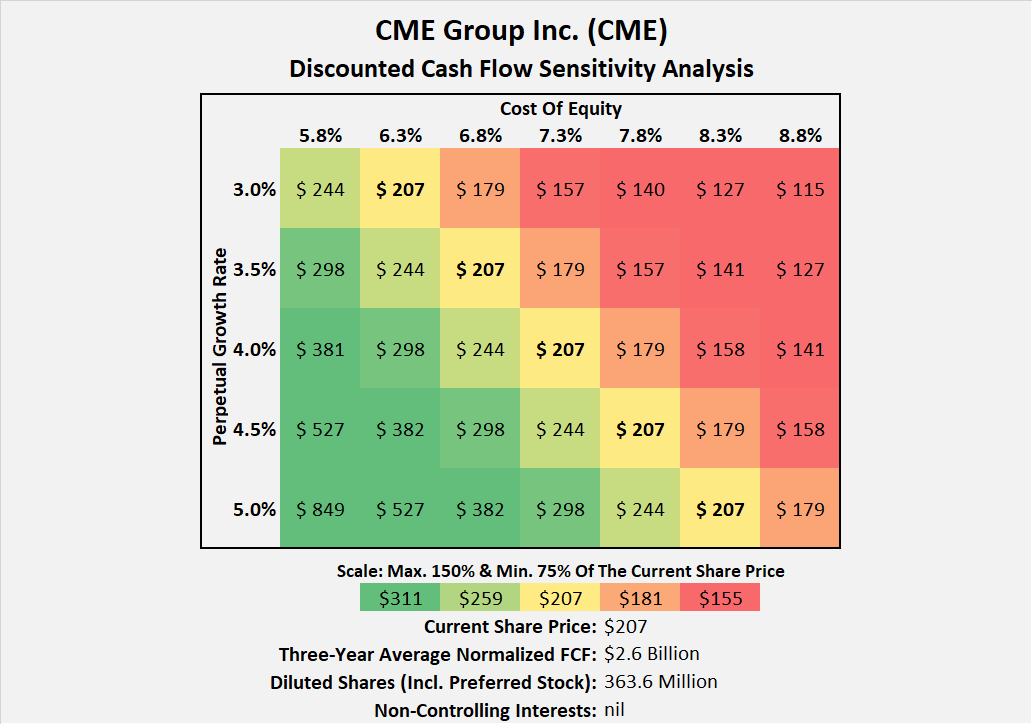
As I disclosed in my first article, I initiated a position in March 2023 that I planned to increase to 1% of total portfolio value over the course of the year. The position now represents about 0.7% of my portfolio value and given the share price appreciation of about 18% since my article was published, my enthusiasm as a buyer has naturally waned somewhat. With a blended price-to-earnings ratio of nearly 24, a free cash flow yield of 3.4%, and an implied perpetual growth rate of 4.0% at a cost of equity of 7.3% (Figure 7), the stock is definitely not cheap. However, given the company's leading position, moat, excellent profitability, growth prospects, and very solid balance sheet (see my original article), a premium valuation can certainly be justified. As the world's leading exchange operator, I am very confident about CME's pricing power, network effects, and scalability - and thus the company's ability to continue to deliver market-beating shareholder returns.
Figure 7: CME Group Inc. (CME): Discounted cash flow sensitivity analysis (own work, based on company filings and own calculations)
For these reasons, I still rate the stock as a (modest) buy and continue to add to my position until it represents 1% of my portfolio value, albeit much less enthusiastically than I did earlier this year (and when I reallocated the proceeds from the sale of my position in 3M Company, MMM ).
As always, please consider this article only as a first step in your own due diligence. Thank you for taking the time to read my latest article. Whether you agree or disagree with my conclusions, I always welcome your opinion and feedback in the comments below. And if there's anything I should improve or expand on in future articles, drop me a line as well.
For further details see:
CME Group: Still The Perfect Fit For An All-Weather Portfolio