SBNY - Diamond Hill Core Bond Fund Q2 2023 Market Commentary
2023-08-24 13:30:00 ET
Summary
- Diamond Hill invests on behalf of clients through a shared commitment to its valuation-driven investment principles, long-term perspective, capacity discipline and client alignment.
- After back-to-back quarters of positive returns, the Bloomberg US Aggregate Bond Index slipped back into the red losing -0.84% in Q2.
- With the strength in the labor market, the Federal Reserve continues to focus its efforts on inflation.
- The Bloomberg U.S. Securitized Index experienced a significant drop-off from Q1’s strong performance (+2.47%), dropping -0.63% in Q2.
Market Commentary
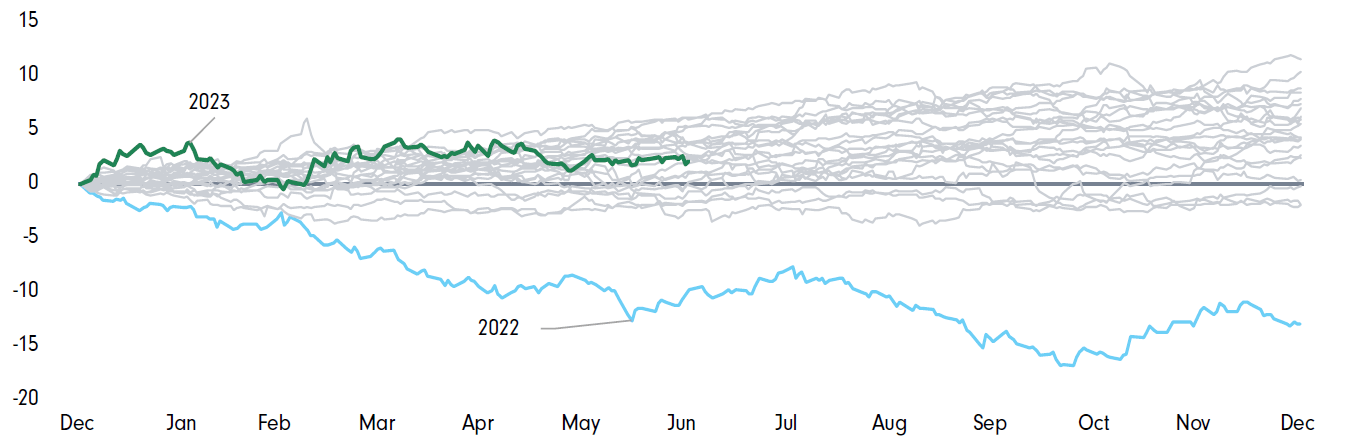
After back-to-back quarters of positive returns, the Bloomberg US Aggregate Bond Index slipped back into the red losing -0.84% in Q2. Despite the drop, the index remains well ahead of 2022's year-to-date performance over the comparable period, +2.09% compared to a loss of -10.35%. Exhibit 1 is an illustration of the index's performance since the turn of the century for comparison purposes.
Exhibit 1 - Bloomberg US Aggregate Bond Index, Year to Date (%)
Fading of the Regional Bank Crisis
We're quite a bit removed from the final days of Q1 when failing regional banks were dominating the headlines on a regular basis. But let us not forget that Q2 began while concerns were still swirling around the viability of First Republic ( FRCB ) and other regional banks. In fact, the First Republic issue wasn't resolved until early May, when JPMorgan ( JPM ) acquired most of its assets.
By the end of the quarter, the financial markets had stabilized, and we learned that all 23 of the US banks that were subjected to the Federal Reserve's annual stress test weathered the severe recession scenario while continuing to lend to consumers and corporations. The banks were able to maintain minimum capital levels, despite $541 billion in projected losses for the group, while continuing to provide credit to the economy in the hypothetical recession. This year's simulation included unemployment surging to 10%, a 40% decline in commercial real estate values, and a 38% drop in housing prices. It should be noted that the stress testing is focused on the largest banks and superregionals and does not include smaller banks, which were the cause of the angst in Q1, so the "all clear" that the test usually delivers was less than reassuring.
Federal Reserve Battles On
The labor market continued to prove resilient, with an additional 253,000, 339,000, and 209,000 jobs added in April, May, and June, respectively, pushing the average monthly job gain since the beginning of 2023 to 310,000 and over the past 12 months to 335,000.
With the strength in the labor market, the Federal Reserve continues to focus its efforts on inflation. The Fed hiked 25 basis points (bps) in May before hitting the pause button in June. But June's meeting was a combination of dovishness (rate pause) and hawkishness (Statement of Economic Projections or SEP illustrated an additional two rate hikes by year-end, an increase from the previous SEP), leaving the door open to more uncertainty in the coming months.
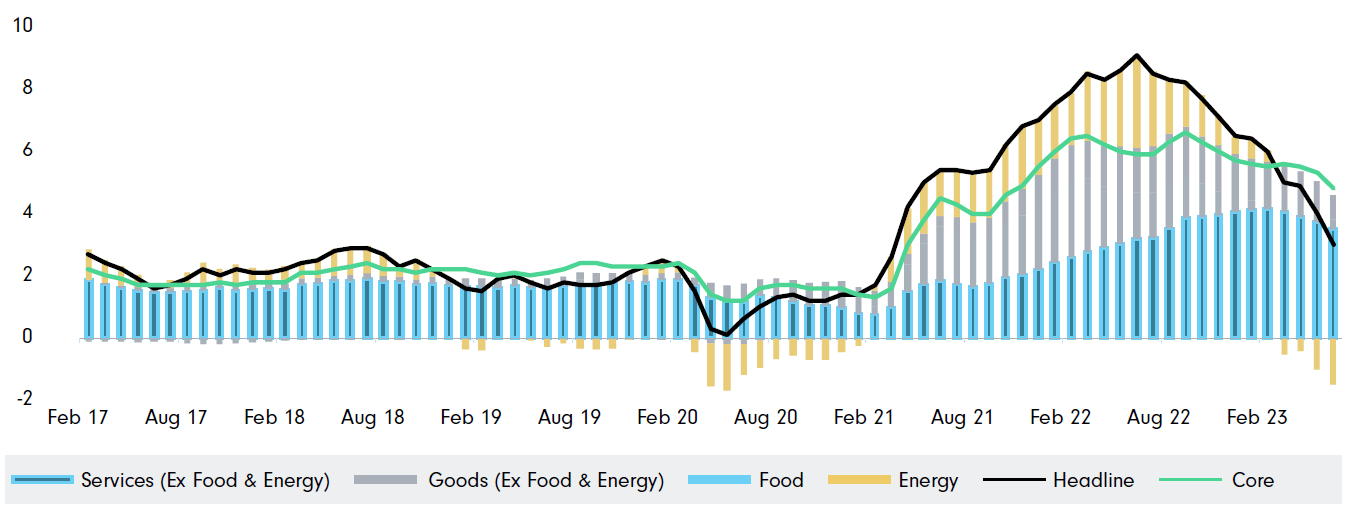
As of June 30, the market was on board with a rate hike in July, pricing in an 81% chance of a 25-bps hike at the July 26 meeting, compared to expectations for a cut at that meeting at the beginning of the quarter. With June's CPI report showing that inflation is slowing down, having climbed only 3% from a year earlier, we may see the market and the Fed meet in the middle with one rate hike in July and then a prolonged pause as we head into the end of the year. The 3% increase over the past 12 months marks the slowest pace of increases in more than two years and harkens back to the pre-transitory period.
Exhibit 2 - Ongoing Inflation Battle Succeeding (%)
Deal Ceiling Resolution, Kicking the Can Down the Road Once More
The frighteningly traditional game of financial chicken between political parties came to a head at the end of May as President Biden and House Speaker Kevin McCarthy reached an eleventh-hour agreement to suspend the debt ceiling through the end of 2024.
At the beginning of the month, when negotiations appeared to be going nowhere, yields on T-bills maturing around the expected X-date (early June) were trading with a 7-handle, illustrating the extra compensation demanded by investors to hold the bills most likely to be the cause of default.
The deal was passed by the House and the Senate in the first days of June, which Biden signed into law, once more avoiding the financial catastrophe that would be brought on by a US government default. The rating agencies remained on the sidelines for the most part, though Fitch announced that the US will remain on "negative watch" despite the debt ceiling agreement. Once more, the US has succeeded in kicking the can down the road, with the next showdown coming in 2025.
Portfolio Performance & Positioning
Uncertainty around the debt ceiling and the final days of the regional bank crisis, combined with the Fed's proclamation that it was not, in fact, done with rate hikes led to a challenging quarter for fixed-income markets. While it was nothing compared to the first three quarters of 2022 where the Bloomberg US Aggregate Bond Index lost -14.61%, the index was down -0.84% in Q2 after two strong quarters.
The worst-performing sector in the index was the Treasury market, which was a mix during the quarter: positive in April (+0.54%) and negative in May (-1.16%) and June (-0.75%). After a rather benign April, with minimal rate movement across the curve, May and June witnessed a significant move higher in yields across the curve, most significantly on the short end of the curve as expectations grew for an additional rate hike or two by year-end.
Exhibit 3 - Yield Curve Movement Q2 2023 (%)
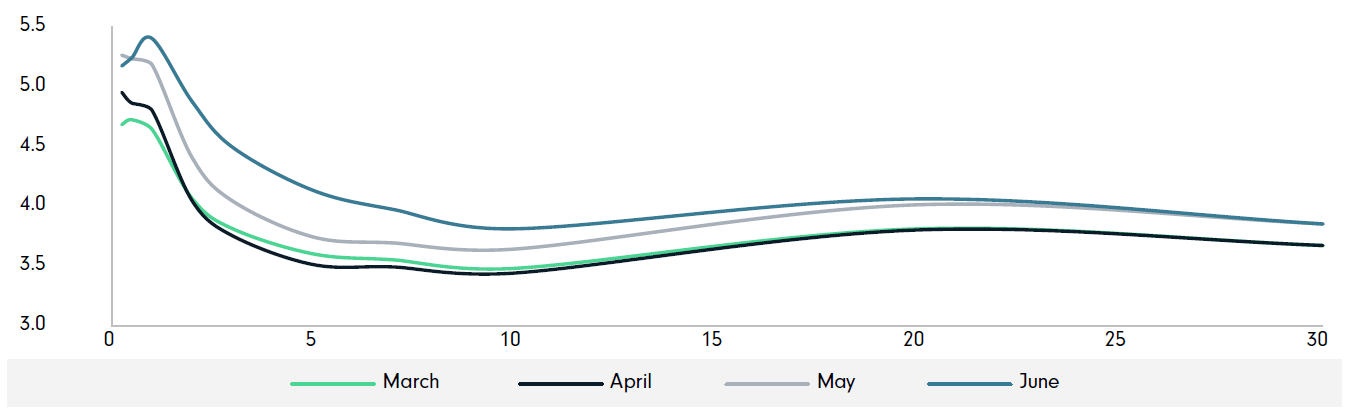
The portfolio's duration has been maintained at the low end of the targeted range of +/- 10% of the benchmark's duration, though that may shift as we move towards the potential finale of this Fed tightening cycle. The shorter positioning relative to the benchmark contributed positively to overall performance Q2; and the relatively longer duration posture in the Treasury sector was offset by our underweight compared to the benchmark. The portfolio finished Q2 at a shorter duration posture than the Bloomberg US Aggregate Bond Index, 5.67 years compared to 6.31 years.
The Bloomberg US Corporate Bond Index had an up and down quarter, with positive returns in April (+0.77%) and June (+0.41%) combined with losses in May (-1.45%), bringing the quarter's overall performance to -0.29%, leading the major sectors. Relative to comparable duration Treasuries, the corporate index gained an impressive +1.31%, the best relative performance across the various investment grade fixed income sectors.
In a reverse from the previous quarter, higher-yielding lower quality corporate debt performed the best, outpacing the AAA, AA, and A segments of the market. The benefit of the portfolio's shorter duration relative to the benchmark in the corporate sector was offset by the relative underweight and higher quality tilt relative to the best-performing sector during the quarter, marginally contributing to overall performance.
The Bloomberg U.S. Securitized Index experienced a significant drop-off from Q1's strong performance (+2.47%), dropping -0.63% in Q2. Despite the negative performance, the index continues to hold strong in the face of a potential recession, despite being heavily exposed to the consumer through residential mortgages and asset-backed securities.
The combination of the Fed's ongoing, albeit slowly progressing, reduction of its balance sheet and the FDIC liquidation of mortgage securities previously held by Signature Bank ( SBNY ) and Silicon Valley Bank ( SIVBQ ) has presented an opportunity in the residential mortgage-backed securities space not seen in many years. Index-eligible residential mortgages lost -0.64% during the quarter but were well ahead of collateralized mortgage obligations, as measured by the ICE Bank of America Agency Collateralized Mortgage Obligation (CMO) Index, which lost -1.88%.
In the commercial mortgage-backed securities ((CMBS)) sector, non-agency CMBS outpaced their agency counterparts, down -0.50% compared to -0.72%, respectively. Concerns continue regarding the office segment of the CMBS market and investors should exercise caution when considering this part of the market.
Index-eligible asset-backed securities benefitted from their lower duration posture, with auto ABS (the lone component of the securitized index with positive returns) advancing +0.07% during the quarter. Non-index eligible segments of the market were mixed, fueled by a strong performance from unsecured consumer debt, small business, and timeshares, while property-assessed clean energy (PACE) and mortgage servicing rights ((MSR)) lagged the overall index. In total, the portfolio's securitized allocation detracted from relative performance as the portfolio's allocation to CMOs reflected the general trend of the market with pass-throughs outpacing CMOs.
The portfolio continues to search for opportunities in the marketplace while maintaining a conservative risk profile relative to the index.
ICE BofA US Agency Collateralized Mortgage Obligation (CMO) Index tracks the performance of US dollar-denominated, fixed-rate agency CMOs publicly issued in the US domestic market.
| Period and Annualized Total Returns (%) |
| Since Inception (5 Jul 2016) |
| 5Y |
| 3Y |
| 1Y |
| YTD |
| 2Q23 |
| Expense Ratio (%) |
| Class I ( DHRIX ) |
| 1.14 |
| 1.36 |
| -3.05 |
| -0.64 |
| 2.82 |
| -0.46 |
| 0.47 |
| Bloomberg US Aggregate Bond Index |
| 0.34 |
| 0.77 |
| -3.96 |
| -0.94 |
| 2.09 |
| -0.84 |
| - |
| Risk disclosure: In general, when interest rates rise, fixed income values fall. Mortgage- and asset-backed securities are influenced by factors affecting the housing market and the assets underlying such securities. The securities may decline in value, face valuation difficulties and become more volatile and/or illiquid. They are also subject to prepayment risk, which occurs when mortgage holders refinance or repay loans sooner than expected, creating an early return of principal to loan holders. The views expressed are those of Diamond Hill as of 30 June 2023 and are subject to change without notice. These opinions are not intended to be a forecast of future events, a guarantee of future results or investment advice. Investing involves risk, including the possible loss of principal. Past performance is not indicative of future results. Investment returns and principal values will fluctuate so that an investor's shares, when redeemed, may be worth more or less than their original cost. The Fund's current performance may be lower or higher than the performance quoted. For current to most recent month-end performance, visit diamond-hill.com. Performance assumes reinvestment of all distributions. Returns for periods less than one year are not annualized. Fund holdings subject to change without notice. Index data source: Bloomberg Index Services Limited. See diamond-hill.com/disclosures f or a full copy of the disclaimer. Analytics provided by The Yield Book® Software. Carefully consider the Fund's investment objectives, risks and expenses. This and other important information are contained in the Fund's prospectus and summary prospectus, which are available at diamond-hill.com or calling 888.226.5595. Read carefully before investing. The Diamond Hill Funds are distributed by Foreside Financial Services, LLC (Member FINRA). Diamond Hill Capital Management, Inc., a registered investment adviser, serves as Investment Adviser to the Diamond Hill Funds and is paid a fee for its services. Not FDIC insured | No bank guarantee | May lose value |
Editor's Note: The summary bullets for this article were chosen by Seeking Alpha editors.
For further details see:
Diamond Hill Core Bond Fund Q2 2023 Market Commentary