QCLN - Dirty Trends In Clean Energy QCLN A H2 Sell
2023-07-05 01:29:12 ET
Summary
- Clean energy stocks have been struggling since early 2021, with the First Trust NASDAQ Clean Edge Green Energy Index Fund losing ground on both an absolute basis and relative to the S&P 500.
- QCLN, which invests in companies promoting environmental responsibility, has a moderate annual fee of 0.58% and yields a low 0.68% dividend rate, with total net assets of $1.6 billion.
- Despite some near-term positive seasonal trends, the fund's concentrated portfolio of growth stocks in a tough collective niche over the last few.
- I outline key price levels to watch for the second half.
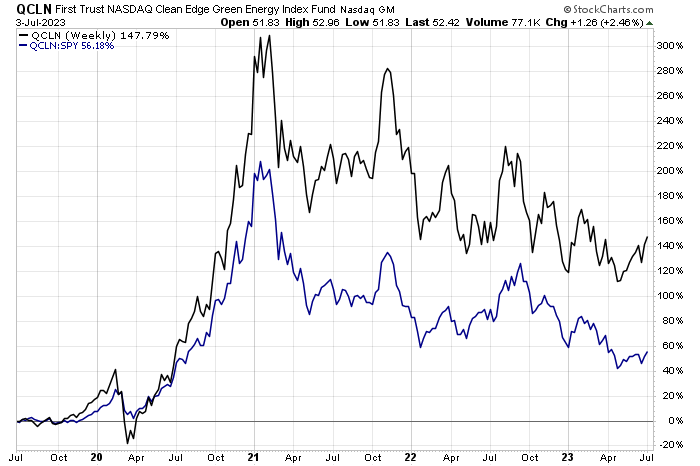
Clean energy stocks just cannot catch a lasting bid. The group was a hot spot for thematic investors way back in 2019 and 2020, sans a quick correction around the COVID crash. But relative strength topped out right around the so-called blue-wave election inauguration date that took place in early 2021. That was peak optimism for green initiatives and an acceleration in the Green New Deal championed by Congresspeople such as Alexandria Ocasio-Cortez. But that proved to be when the bubble began to deflate.
For nearly two-and-a-half years now, the First Trust NASDAQ Clean Edge Green Energy Index Fund (QCLN) has lost ground on both an absolute basis and relative to the S&P 500. I have a sell rating on the ETF as I see risks of further downside in the second half.
QCLN: Poor Relative Strength Last 30 Months
According to the issuer , QCLN invests in stocks of companies operating across energy sectors. The fund invests in growth and value stocks of companies across diversified market capitalization. It invests in stocks of companies that directly promote environmental responsibility. The index it tracks is rebalanced quarterly and reconstituted semi-annually.
QCLN features a moderate annual expense ratio of 0.58% and yields a low 0.68% dividend rate. With total net assets of $1.6 billion, daily volume has declined to just about 77,000 shares per day. It used to trade with much greater volume. Tradeability is still decent with the ETF as its 30-day median bid/ask spread is just eight basis points, but using limit orders during illiquid periods of the trading day is prudent. Holding 64 total positions as of July 3, 2023, the median market cap is listed at $2.7 billion and QLCN trades at a lofty 22.0 price-to-earnings multiple is his 4.0 times sales.
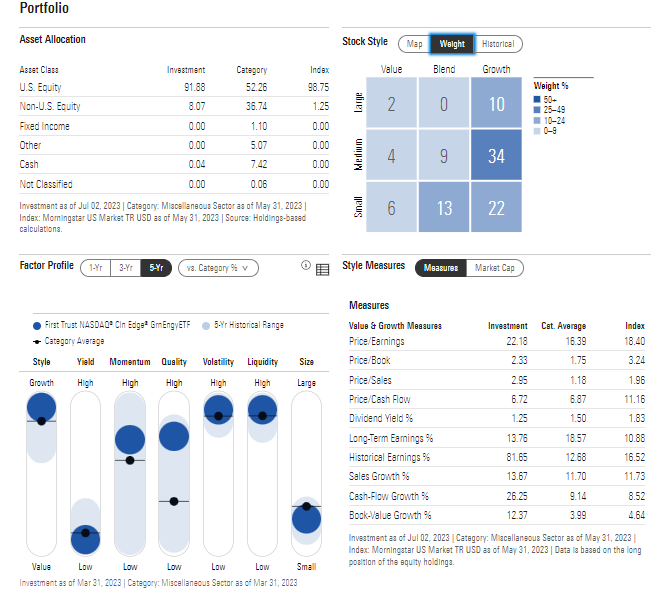
Digging into the portfolio, data from Morningstar shows that QCLN is largely a SMID-cap growth fund. The style box below reveals just 12% of the fund being large cap while the same percentage is considered value. That means there’s going to be heightened volatility with this low-yield, small-sized fund.
QCLN: Portfolio & Factor Profiles
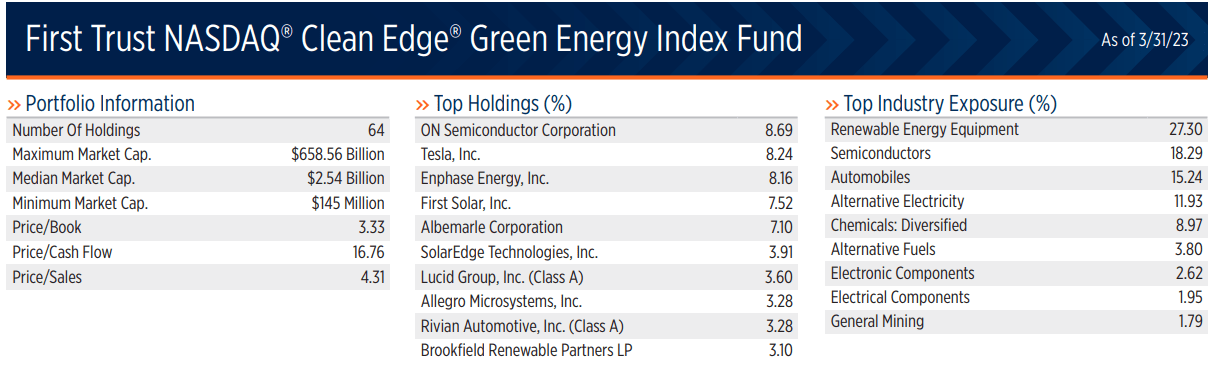
When analyzing the current holdings, Tesla (TSLA) is the biggest position, accounting for more than 10% of the allocation. In all, QCLN is concentrated with 58% of assets in the top 10 equity positions. At the sector level, it is a mixed bag of Information Technology, Consumer Discretionary, Utilities, Materials, and Industrials, but many of the companies perform the same set of functions: renewable energy development, automobile manufacturing, and semiconductor production.
QCLN: Portfolio Information, Top Holdings, Industry Exposure (March 31, 2023)
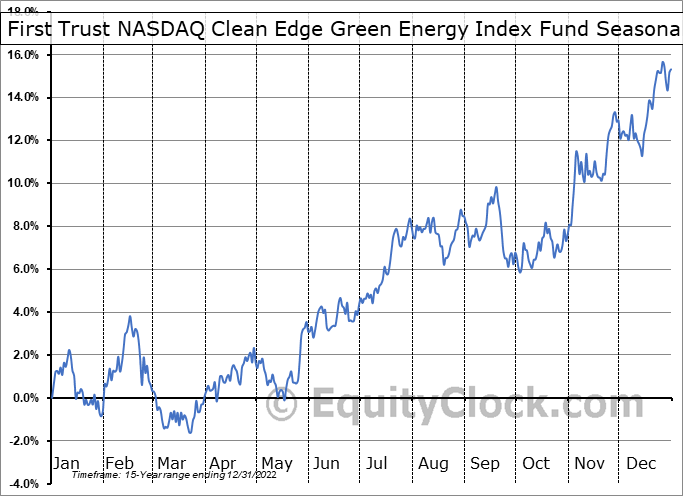
Seasonally, QCLN tends to do well through much of the second half, according to data from Equity Clock . The early July through December stretch has historically featured a more than 10% total return over the past eight calendar years.
QCLN: Bullish 2H Commonly Seen
The Technical Take
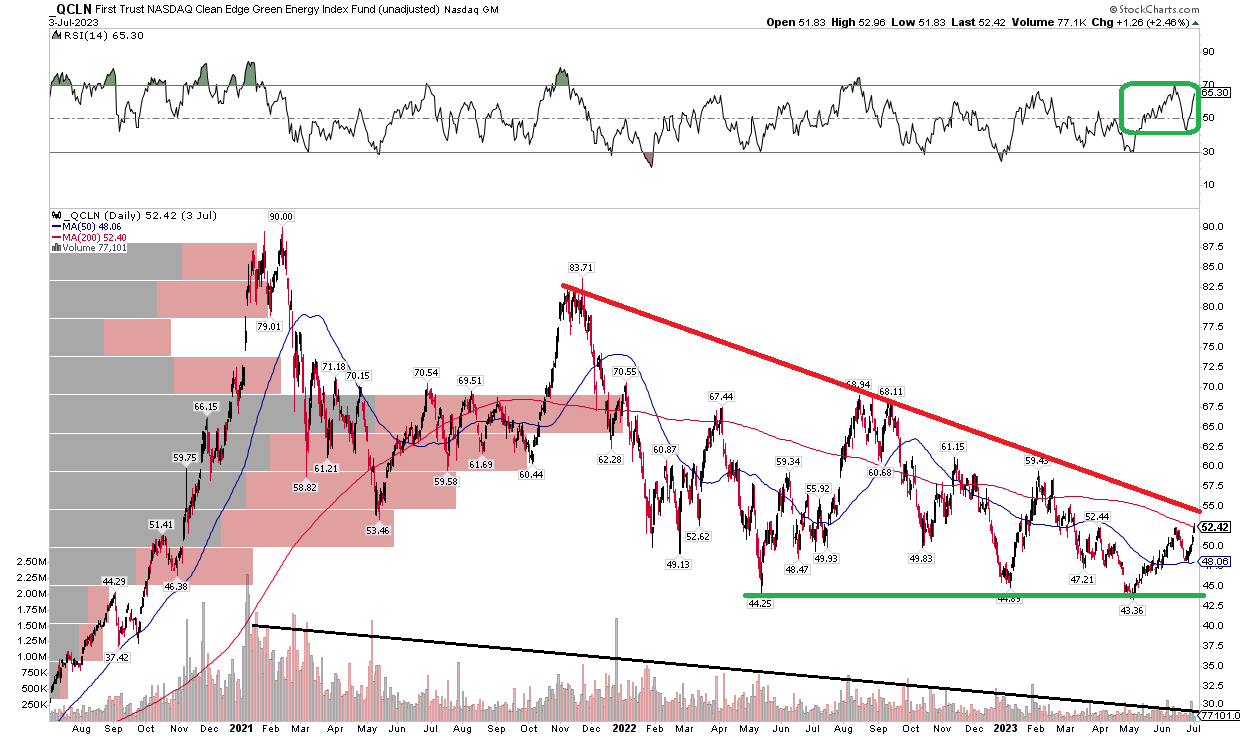
With a lofty valuation, but arguably much cheaper compared to a few years ago, the chart looks risky in my view. Notice in the graph below that QCLN continues to consolidate in a bearish descending triangle pattern. Making this formation bearish is that the long-term 200-day moving average is negatively sloped and the move comes off a trend change that took place in 2021. So, this continuation pattern suggests the next move will be in the broader trend – down. It is key to watch support in the $43 to $45 range while resistance is currently in the mid to high $50s.
What’s optimistic, though, is that the RSI momentum reading at the top of the chart is holding in bullish territory (between 40 and 90). Keep your eye on volume trends too – a breakout above $60 or below $43 on unusually high shares traded could portend a significant move. Lastly, helping to cement my bearish thesis is that there’s high volume by price in the $60 to $70 range. So, even if it does break out, there are natural sellers who may look to sell at their purchase price to get back to even.
QCLN: Watching $43 As Key Support, Declining 200DMA A Bearish Cue
The Bottom Line
I have a sell rating on QCLN. With poor relative strength to the S&P 500, its concentrated portfolio of growth stocks in a tough collective niche over the last few years is not cheap and price action continues to be leaning bearish despite some near-term positive seasonal trends.
For further details see:
Dirty Trends In Clean Energy, QCLN A H2 Sell