CA - Dividend Harvesting Portfolio Week 100 Update: $101k Allocated $784.43 In Dividends
Summary
- The Dividend Harvesting Portfolio is now generating $784.43 in annual dividends, yielding 7.5%.
- The Dividend Harvesting portfolio has a 74.26% record of finishing the week in the black since its inception, 75/101 weeks.
- In week 101, I added ICAP to the portfolio and shares of VZ, PFFA, and BBDC.
Earnings season is in full swing, and after Apple ( AAPL ), Amazon ( AMZN ), and Alphabet ( GOOGL ) reported, the S&P 500 closed the week out up 2.13%, and the Nasdaq finished up 4.36%. 2023 has started out great as the Nasdaq is up 15.60% YTD while the S&P has gained 8.17%. The Fed raised rates by .25 bps, and Jerome Powell's speech wasn't nearly as hawkish as his speech in December. A soft landing certainly is back on the table, and many would argue it's hard to have a recession when unemployment is a 3.4%. The Dividend Harvesting Portfolio has been doing well and has now completed its 4 th consecutive week in the black from the previous 5-week trip into the red. The first 100 weeks are over, and I am looking forward to working on the next 100 weeks in this series.
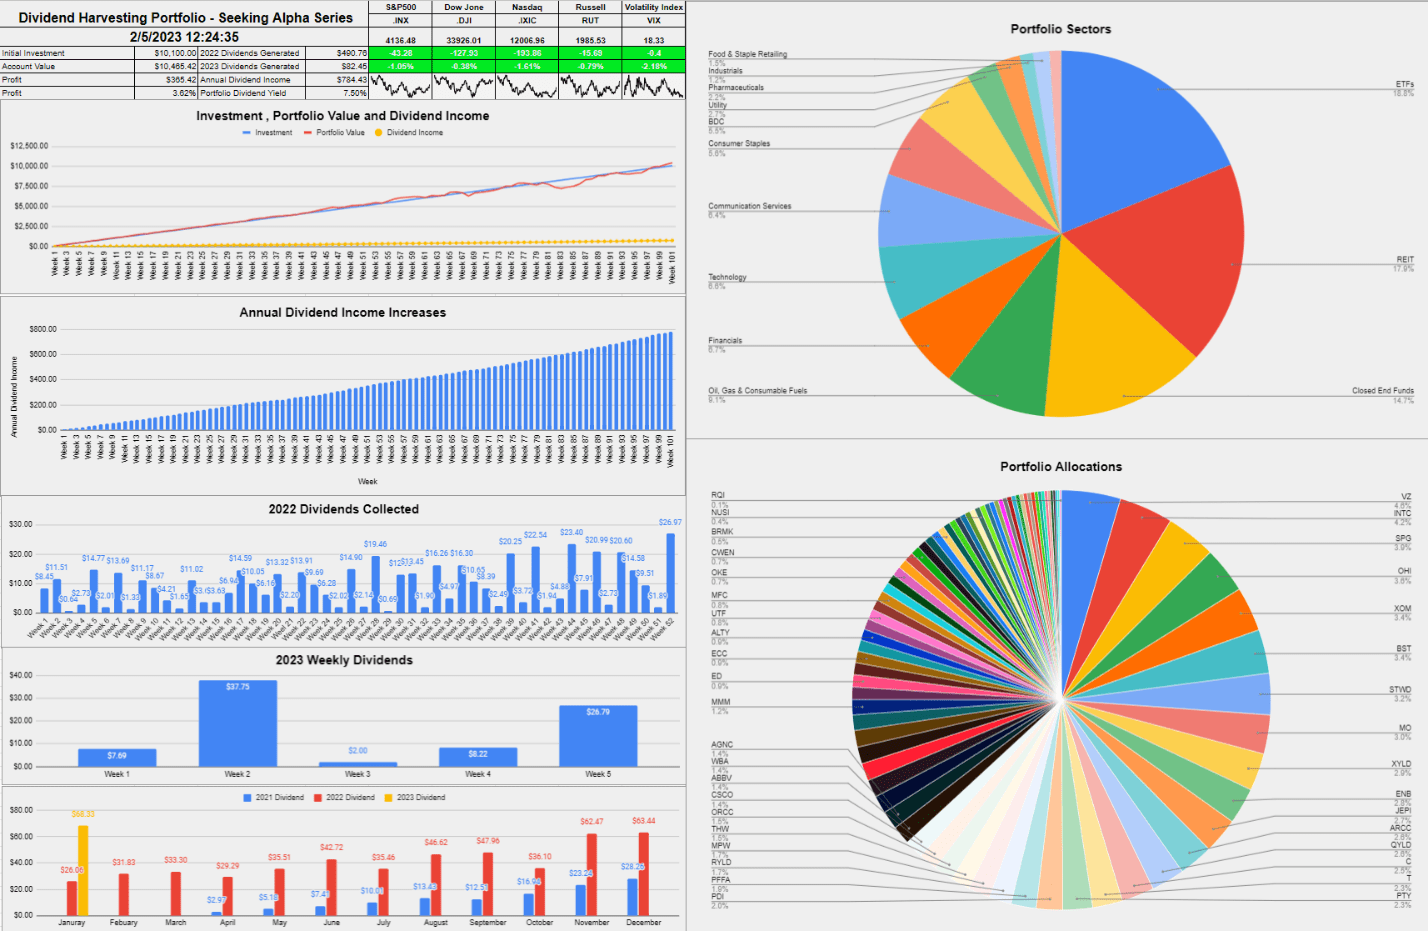
After 101 weeks and $10,100 of capital allocated, the Dividend Harvesting Portfolio's balance is $10,465.42, up $365.42 or 3.62% on invested capital. In week 101, I collected $26.79 in dividend income from 20 individual dividends. YTD the Dividend Harvesting Portfolio has generated $82.45 in dividend income, which is 16.80% of the total income generated in 2022. In week 101, I added the InfraCap Equity Income Fund ETF ( ICAP ) to the portfolio while adding an additional share to the Virtus InfraCap U.S. Preferred Stock ETF ( PFFA ), Verizon ( VZ ), and Barings BDC ( BBDC ). These additions increased my annual projected dividend income to $784.43, which is a forward yield of 7.5%.
I allocate capital toward big tech, funds, dividends, and growth outside of my retirement accounts. These are not my only investments, but I did open a separate account, so I could easily track and document this series. I intentionally created broad diversification throughout the Dividend Harvesting portfolio so I could benefit from sector rotations and mitigate my downside risk. Investors who are too exposed to growth companies or large-cap tech have gotten crushed as the investment landscape changes. On the growth and tech side of my investments, I am feeling the pain as some of my favorite companies, including Alphabet ( GOOGL , GOOG ), Amazon ( AMZN ), and Meta Platforms ( META ), have been taken to the woodshed.
I am going to address a question that continues to surface. I am not trying to beat the market with this portfolio. I love index funds and am invested in several index funds. I love dividend investing due to the stream of cash flow it generates. I don't want 100% of my assets outside of real estate tied to an S&P index fund. I have created a personal investment strategy that works to achieve my investment goals, and having a stream of income generated from dividends is part of my investment strategy. Low-cost index funds are one of the best investments anyone can make in my opinion, and the Dividend Harvesting portfolio is not meant to be a substitute for an index fund. I have read many questions about dividend investing and wanted to start a portfolio from the ground up and document its progress to disprove many misconceptions, including that you need a large amount of seed capital to make dividend investing work for you.
This series has never been about hitting a target yield, generating a certain amount of profit, or beating the market. I had two specific goals with this series. The first was to create a blueprint for constructing a dividend portfolio by documenting the journey starting from the beginning. The second goal was to illustrate how allocating capital each week toward investing, regardless of the amount, would be beneficial in the long run.
Too many people are under the illusion that you need tens of thousands or even hundreds of thousands to benefit from investing. Instead of using my real dividend portfolio as an example, I decided to start a new account, fund it with $100, and add $100 weekly, providing a step-by-step guide to dividend investing. This methodology doesn't have to be used for dividend investing, and it could be as simple as an S&P index fund or a Total Market fund. Hopefully, this series is inspiring people to invest in their future to attain financial freedom.
A Historical Recap of the Dividend Harvesting Portfolio's Investment Principles and Historical Performance
Investment Objectives
- Income generation
- Downside mitigation through diversification
- Capital appreciation
Below are the fundamental rules I have put in place for this Portfolio:
- Allocate $100 weekly to this Portfolio
- Only invest in dividend-producing investments
- No position can exceed 5% of the Portfolio
- No sector can exceed 20% of the Portfolio
- All dividends & distributions are to be reinvested
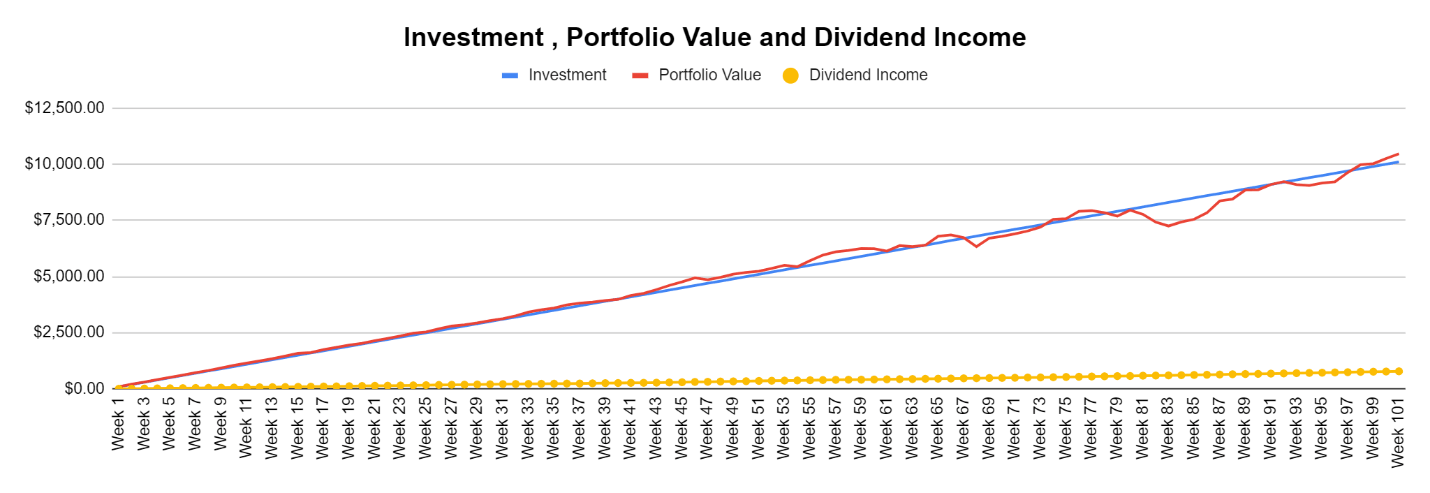
Below is a chart that extends from week 1 through the current week to illustrate the Dividend Harvesting Portfolio's Progression
- Blue line is my initial investment $100 in week 1, $1,000 in week 10, etc.
- Red line is the account value at the end of each week
- Yellow line is the annual dividend income the Dividend Harvesting Portfolio was projected to generate after that week's investments and dividends reinvested
The Dividend Harvesting Portfolio Dividend Section
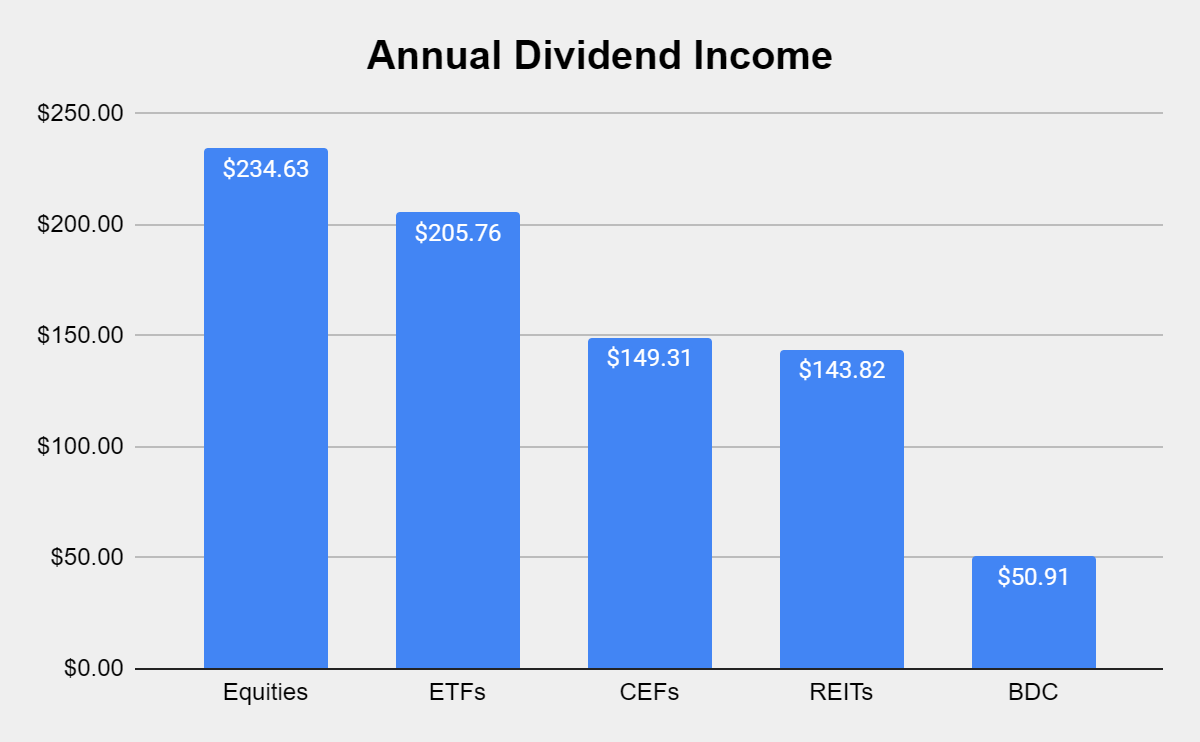
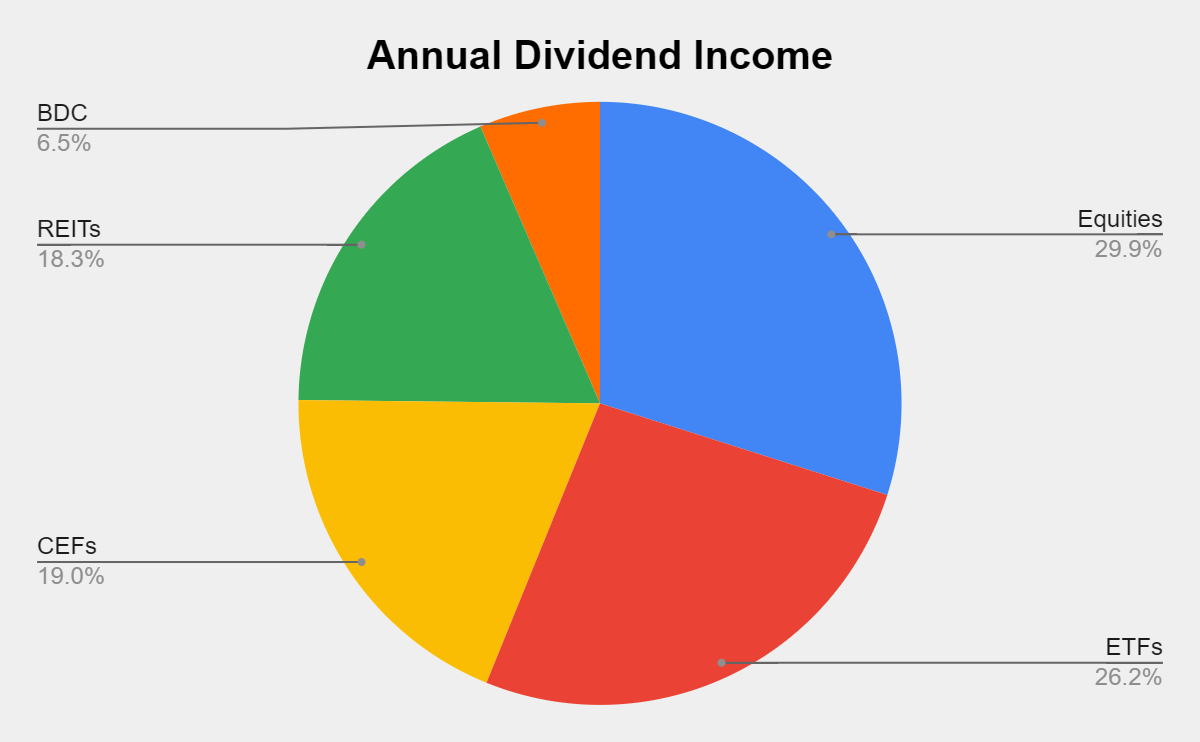
Here is how much dividend income is generated per investment basket:
- Equities $234.63 (29.91%)
- ETFs $205.76 (26.23%)
- CEFs $149.31 (19.03%)
- REITs $143.82 (18.33%)
- BDCs $50.91 (6.49%)
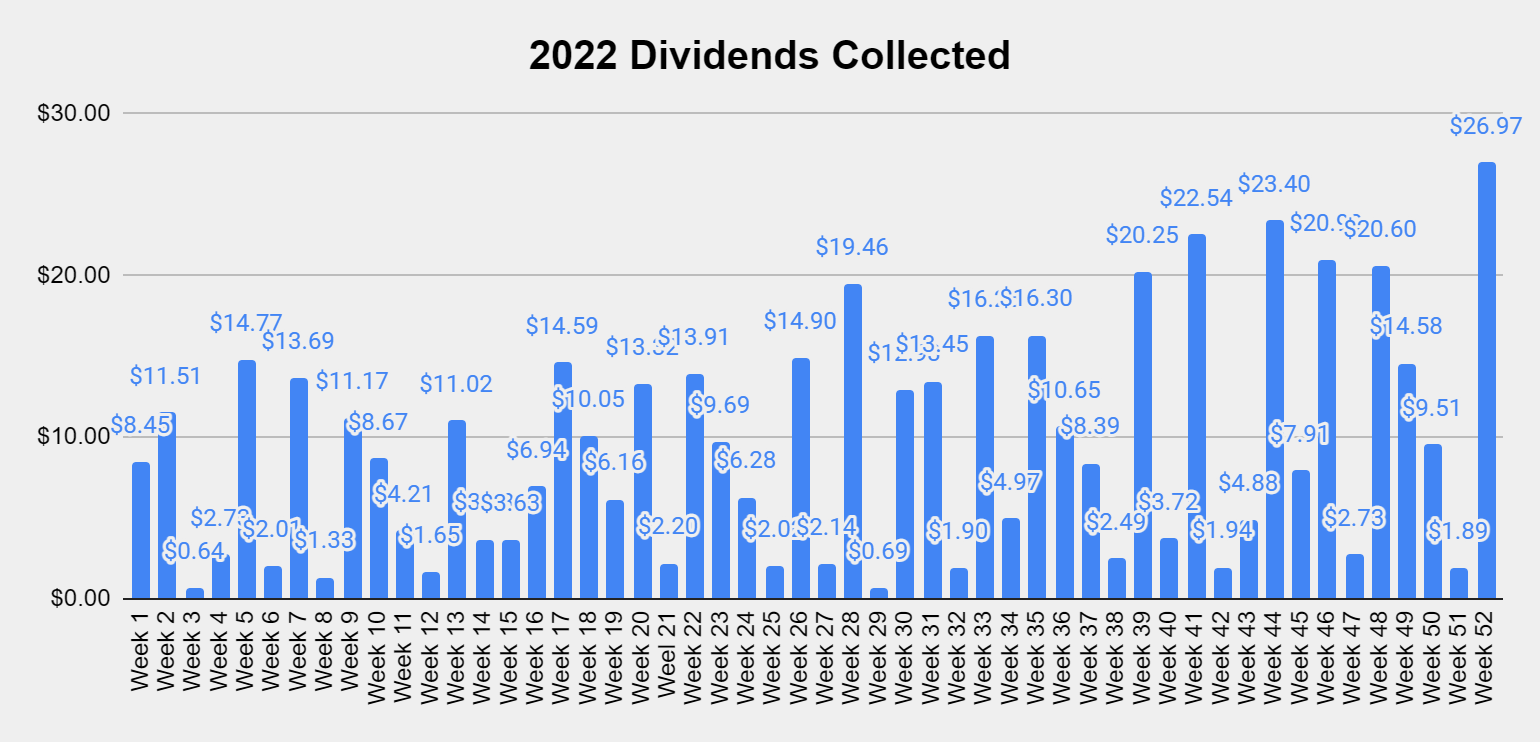
Collecting dividends can serve many functions in a portfolio. Some investors utilize dividends to supplement their income and live off. I am building a dividend portfolio for myself 30 years into the future. In 2022, I collected $490.76 in dividend income from 533 dividends. This has allowed the Dividend Harvesting portfolio to stay in the black while growing the snowball effect. In week 5 of 2023, I collected $26.79 in dividends, and in 2023 I generated $82.45 in dividend income. YTD I have generated 16.80% of my 2022 dividend income from 62 dividends which is 11.63% of the dividends generated throughout 2022.
These dividends allow me to gain additional equity in my investments while increasing my future cash flow in down markets. This style of investing isn't for everyone, but if you're looking to generate consistent cash flow while mitigating downside risk, this method has worked for me. I am hoping to collect around $1,000 in dividends in 2023, which will be reinvested.
January 2023 has come to an end, and it was the largest month for dividend income since the inception of this series. In January, I generated $68.33 in dividend income, which was a 162.20% YoY increase from January 2022. This chart is going to get progressively more interesting as the dividend income continues to grow.
In week 101, I added ICAP to the Dividend Harvesting Portfolio, which added 12 individual dividends, bringing my total annual dividend count to 632. There is dividend income coming in every week, and at some point, I may start tracking this by the day. Let me know if this is something that you would find interesting by leaving a comment in the comment section
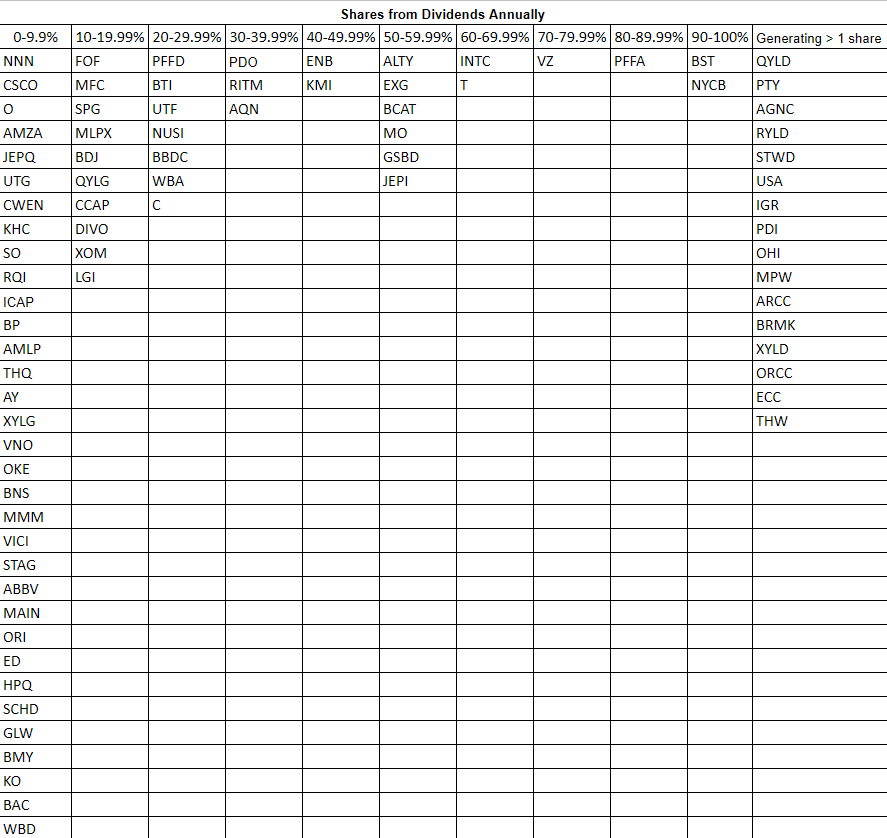
The goal of generating enough income from the dividends to purchase an additional share per year has been the never-ending project of this portfolio. As the market appreciated, 2 of my positions fell just under the 100% threshold of creating a new share annually through their dividends, and there are now 16 positions that are accomplishing this task. I am going to set a goal of getting 30 positions to generate at least 1 share per year through their dividends by the end of 2023.
The Dividend Harvesting Portfolio Composition
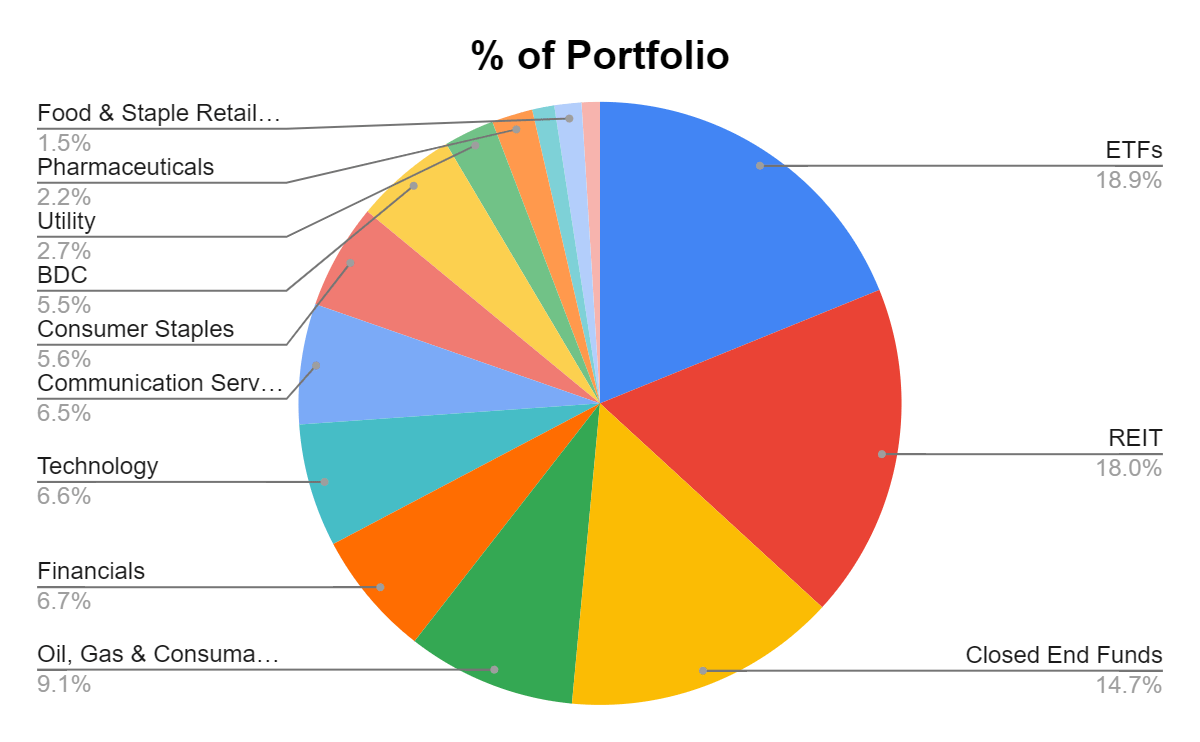
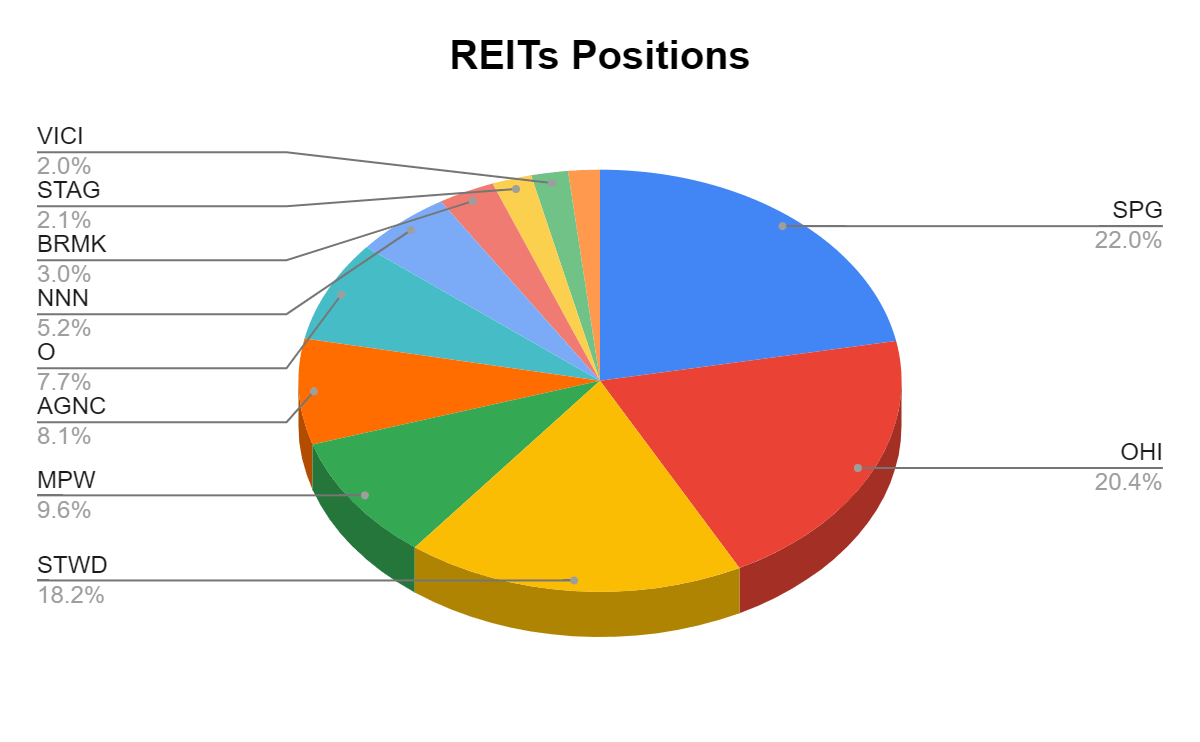
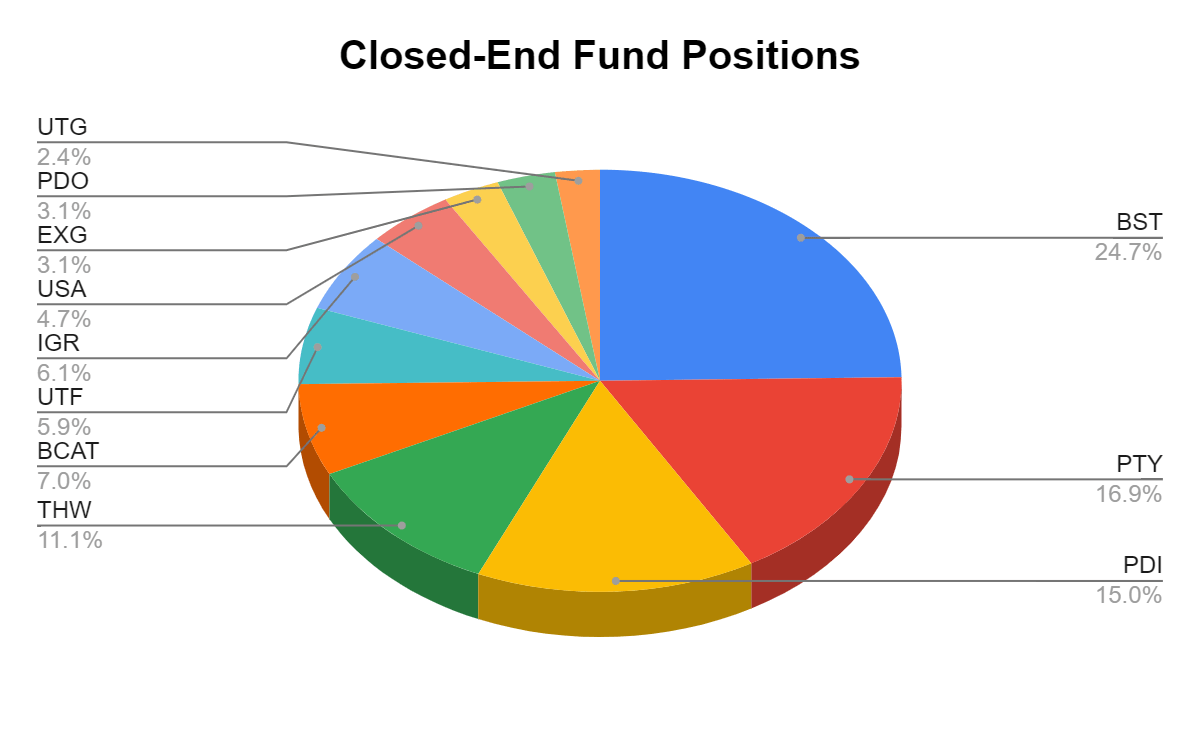
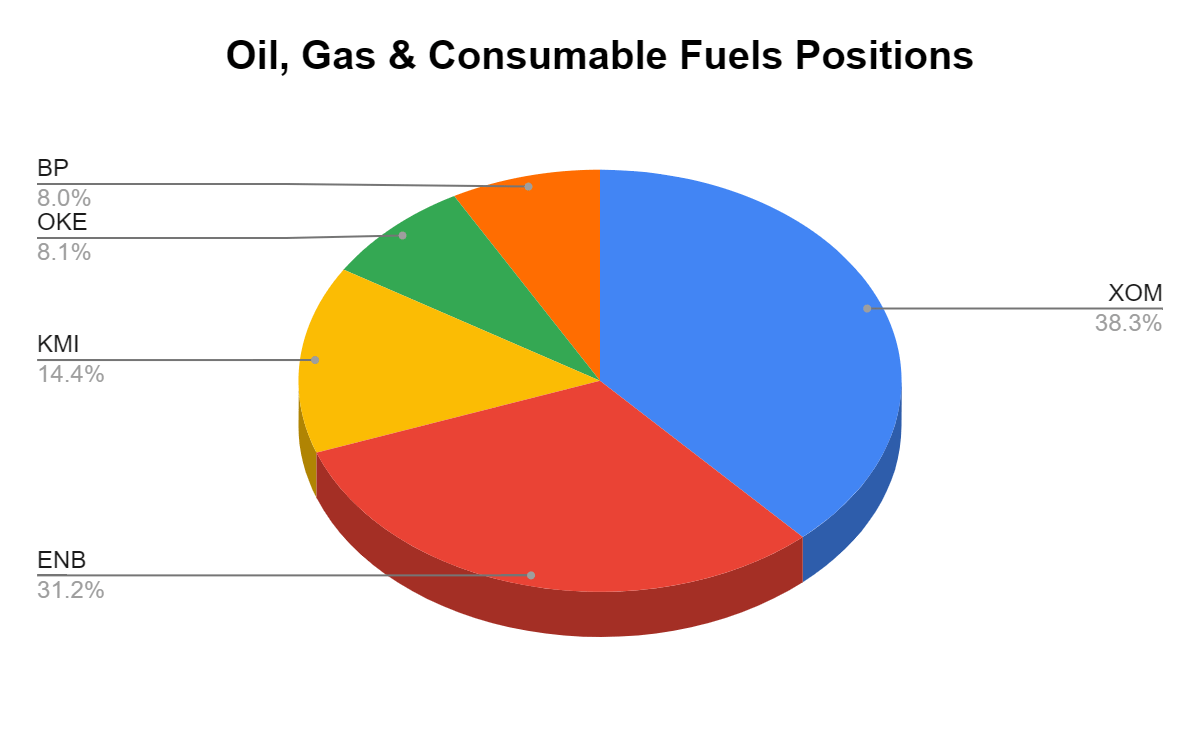
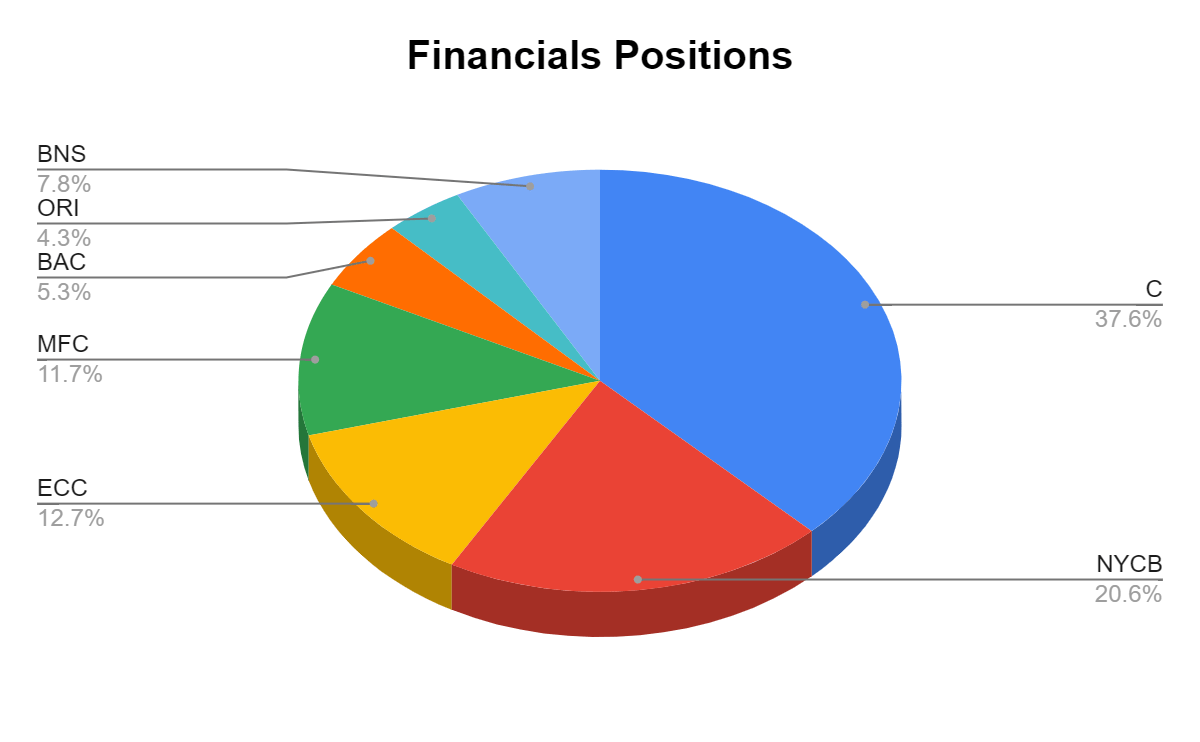
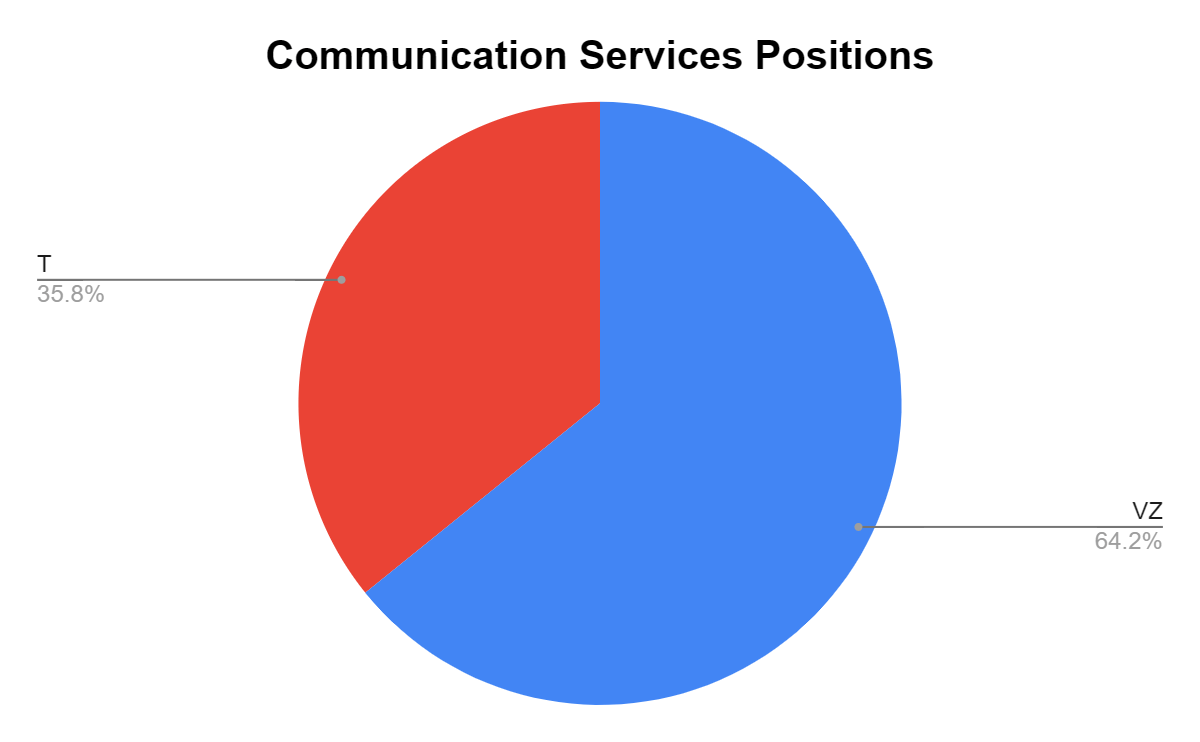
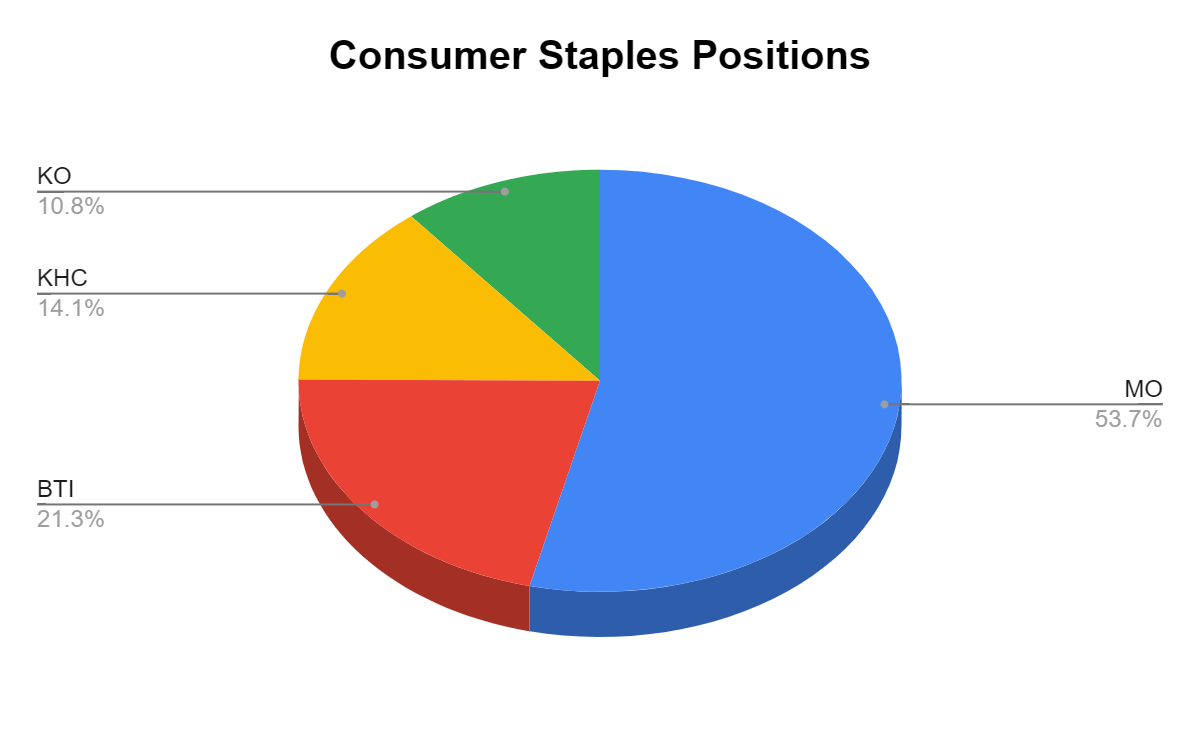
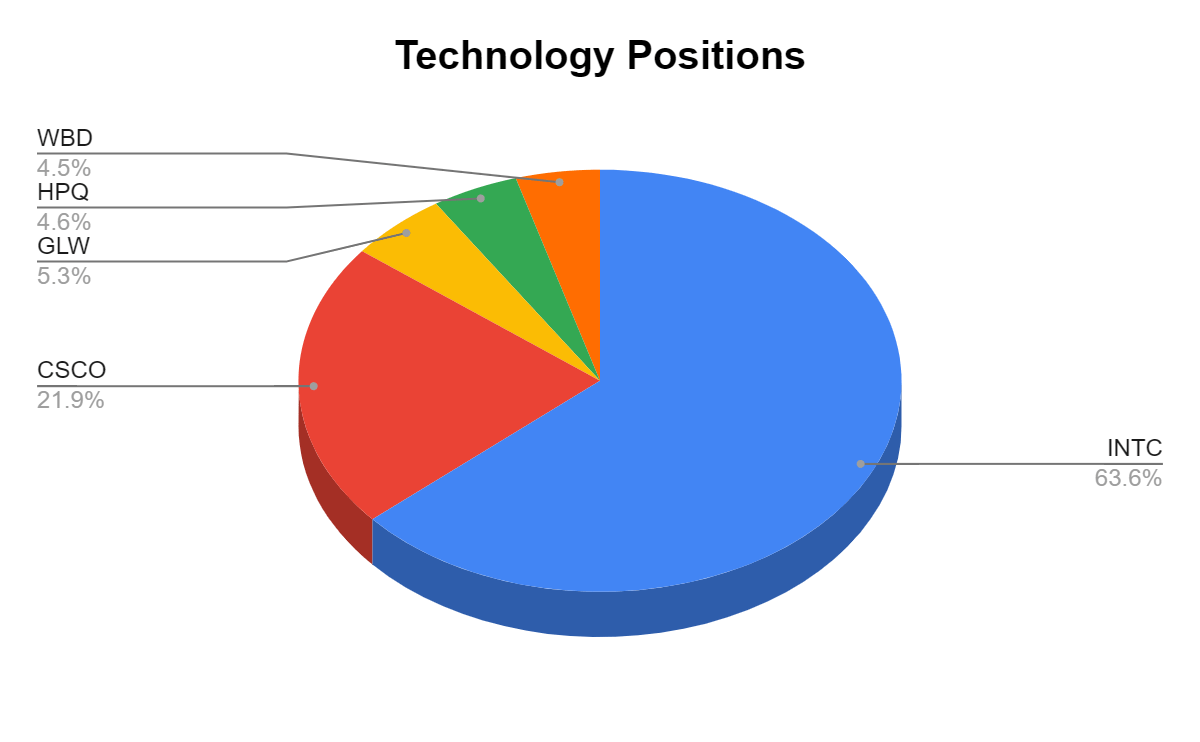
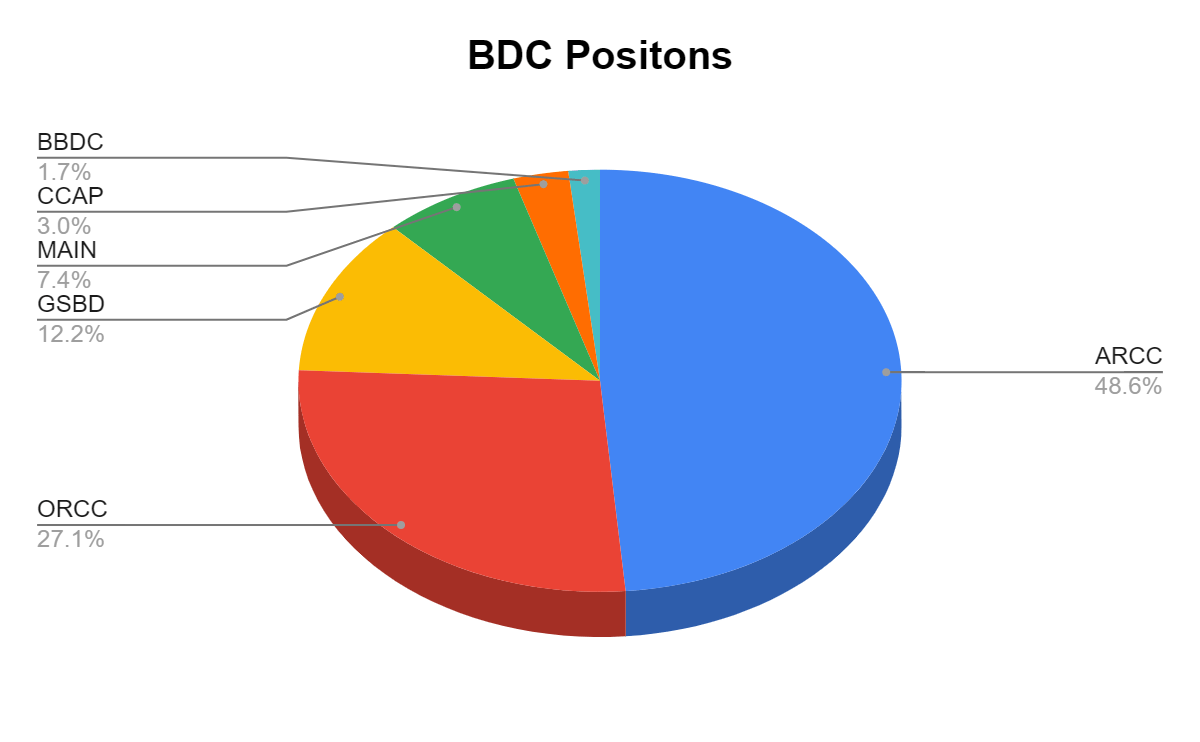
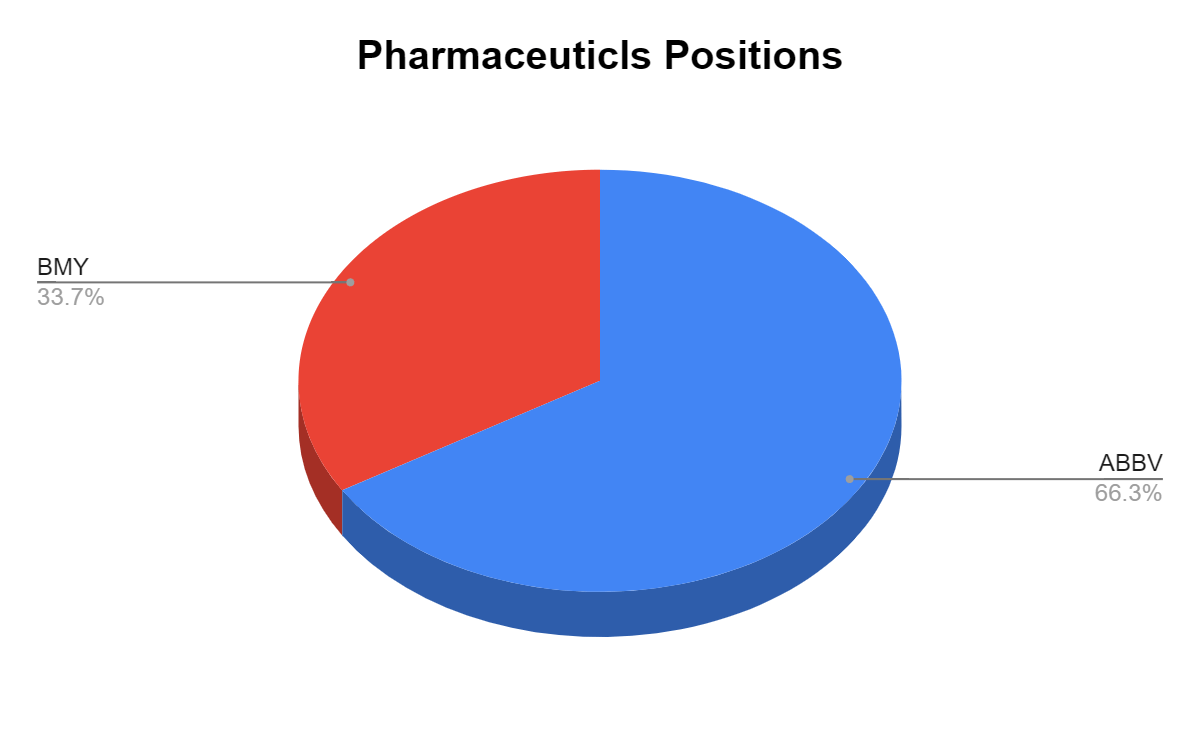
Many of the readers have asked if I could break down the individual positions within these sectors. I created pie charts for each individual sector and have illustrated how much each position represents of that sector of the Dividend Harvesting portfolio. Since I only have 1 position in Food & Staple Retailing and Industrials, I did not make a chart for those. 3M ( MMM ) and Walgreens Boots Alliance ( WBA ) represent 100% of those sectors. The charts will follow the normal portfolio total I have constructed. Please keep the ideas coming, as I am happy to add as much detail to this series as I can.
In week 101, ETFs remained the largest section of the Dividend Harvesting Portfolio's composition. Individual equities make up 42.54% of the portfolio and generate 29.91% of the dividend income, while exchange-traded funds ("ETFs"), closed-end funds ("CEFs"), real estate investment trusts ("REITs"), business development companies ("BDCs"), and exchange-traded notes ("ETNs") represent 57.46% of the portfolio and generate 70.09% of the dividend income.
I have a 20% maximum sector weight, so when a singular sector gets close to that level, I make sure capital is allocated away from that area to balance things out. In 2022, I will make an effort to even out these portfolio percentages. As more capital is deployed, the bottom half of the portfolio weighting will increase.
| Industry |
| Investment |
| Portfolio Total |
| % of Portfolio |
| ETFs |
| $1,952.11 |
| $10,465.42 |
| 18.65% |
| REIT |
| $1,858.63 |
| $10,465.42 |
| 17.76% |
| Closed End Funds |
| $1,518.06 |
| $10,465.42 |
| 14.51% |
| Oil, Gas & Consumable Fuels |
| $937.37 |
| $10,465.42 |
| 8.96% |
| Financials |
| $697.33 |
| $10,465.42 |
| 6.66% |
| Technology |
| $683.60 |
| $10,465.42 |
| 6.53% |
| Communication Services |
| $667.95 |
| $10,465.42 |
| 6.38% |
| Consumer Staples |
| $584.04 |
| $10,465.42 |
| 5.58% |
| BDC |
| $569.63 |
| $10,465.42 |
| 5.44% |
| Utility |
| $279.85 |
| $10,465.42 |
| 2.67% |
| Pharmaceuticals |
| $227.47 |
| $10,465.42 |
| 2.17% |
| Industrials |
| $122.78 |
| $10,465.42 |
| 1.17% |
| Food & Staple Retailing |
| $150.18 |
| $10,465.42 |
| 1.43% |
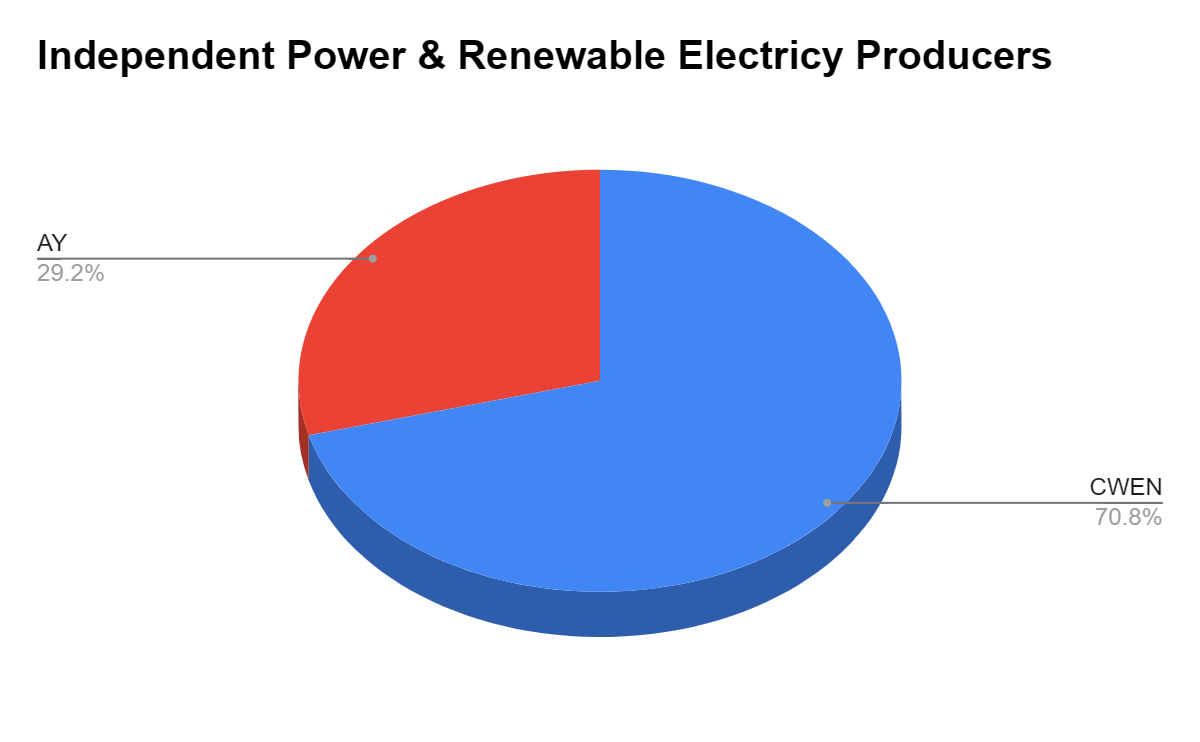
| Independent Power & Renewable Electricity Producers |
| $101.45 |
| $10,465.42 |
| 0.97% |
| Cash |
| $7.64 |
| $10,465.42 |
| 0.07% |
In week 101, Verizon ( VZ ) regained the largest position as I added an additional share. I am going to hold off on adding to VZ for at least several weeks as I want it to come back down to around 4% before adding to it again.
Week 101 Additions
In week 101 I added the following positions in the portfolio:
- InfraCap Equity Income Fund ETF ( ICAP ) to the portfolio
- Virtus InfraCap U.S. Preferred Stock ETF ( PFFA )
- Verizon ( VZ )
- Barings BDC ( BBDC )
InfraCap Equity Income Fund ETF
- I recently wrote a dedicated article about ICAP ( can be read here ). ICAP is an interesting ETF from Infrastructure Capital Advisors that seeks to maximize income for its investors while actively managing its portfolio to pursue total return opportunities. I like the premise and the managing partners outlook, so I added it to the Dividend Harvesting Portfolio.
Virtus InfraCap U.S. Preferred Stock ETF
- I think preferred stocks are going to appreciate in 2023. Since I don't own individual preferred stock, I continue to invest in PFFA as I think the managing partner has a great beat on the economy and the market. PFFA generates a large single-digit yield, and I will continue to add to this position.
Verizon
- I think VZ is undervalued, and it's a strong dividend equity. As the yield is still over 6% I will continue purchasing more.
Barings BDC
- I was down around -18% on the position prior to dividends so I decided to dollar cost average into the position. I think this BDC will have a better 2023 than 2022.
Week 102 gameplan
For further details see:
Dividend Harvesting Portfolio Week 100 Update: $10,1k Allocated, $784.43 In Dividends