WBA - Dividend Harvesting Portfolio Week 119: $11900 Allocated $1006.82 In Projected Dividends
2023-06-15 09:00:00 ET
Summary
- The Dividend Harvesting Portfolio has reached a milestone, generating over $1,000 of annual dividend income after 119 weeks.
- The portfolio focuses on income generation, downside mitigation through diversification, and capital appreciation, with a strategy of allocating $100 weekly to dividend-producing investments.
- The Dividend Harvesting Portfolio is not meant to beat the market or replace index funds but serves as a blueprint for constructing a dividend portfolio and illustrating the benefits of consistent investing.
I feel last week was the calm before the storm. All eyes will be on the FOMC meeting taking place on 6/14/23. The CME FedWatch Tool indicates there is a 70.1% chance the Fed will pause their rate hikes and a 29.9% chance that we see another 25 basis point increase. According to CME Group, the probability of a rate hike continues to increase, as on May 11th, there was only a 10.7% chance of a rate hike. Anything can happen this week depending on what the Fed decides and what Jerome Powell says during his speech. Things were calm the week of June 5 th as the S&P 500 increased by 0.19%, while the Nasdaq slid -0.05%. Regardless of what the Fed decides, I will be allocating capital every week to Dividend Harvesting Portfolio and documenting everything I do.
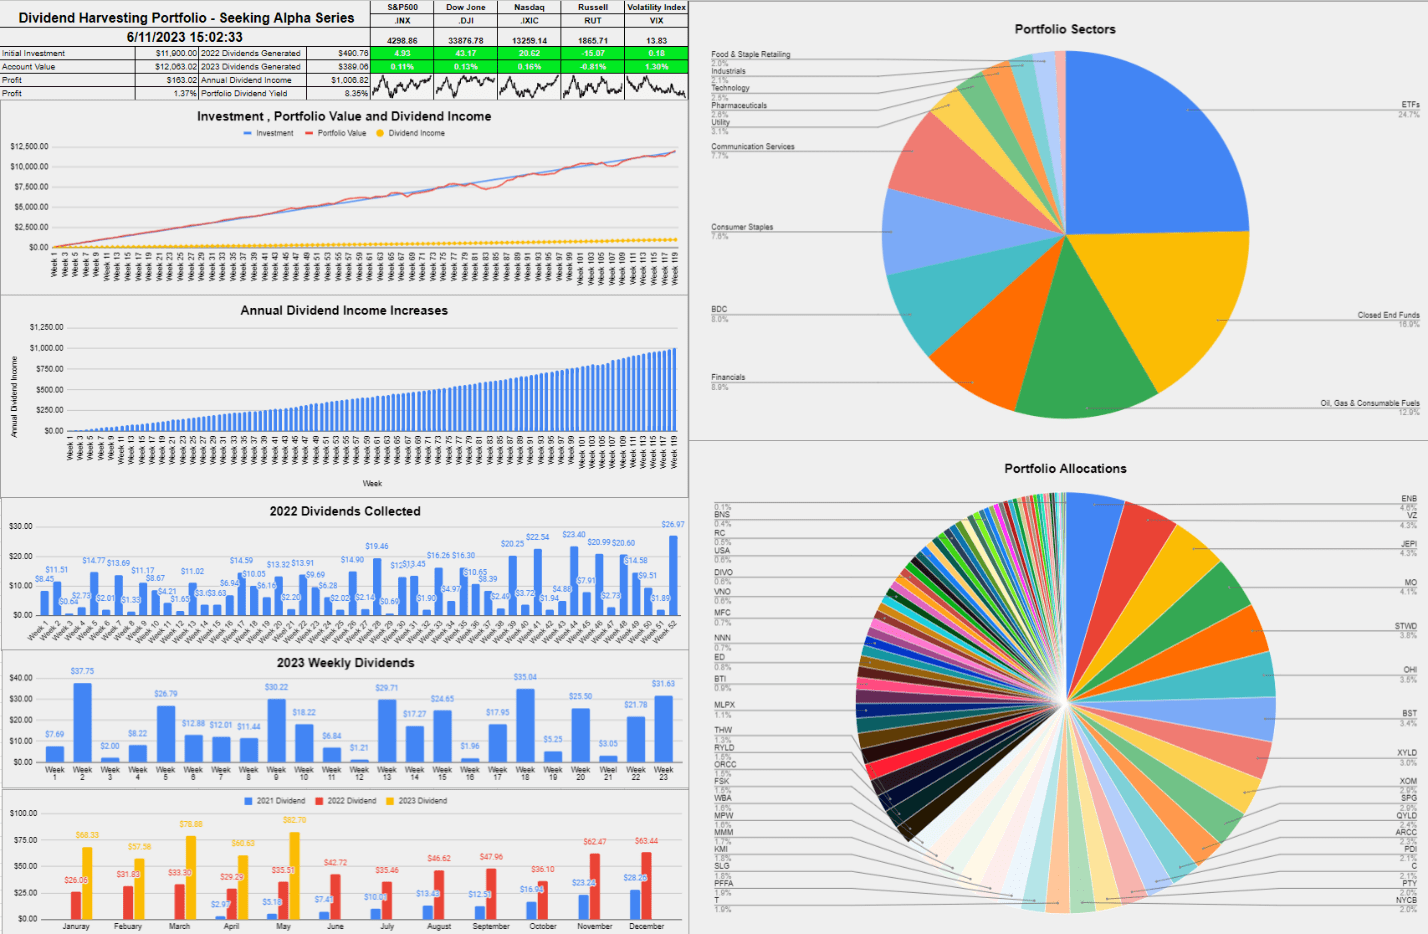
The Dividend Harvesting Portfolio is no longer in the red and is back in the black. After 119 weeks and $11,900 allocated, the balance of the Dividend Harvesting Portfolio is $12,063.02. The account has now appreciated by 1.37% on invested capital as it continued its upward trend into positive territory. This was another solid week for dividend income as 17 positions generated $31.63, bringing 2023's total dividend income generated to $389.06. In week 119, I added to my positions in AT&T ( T ), SL Green Realty ( SLG ), and the Global X S&P 500 Covered Call ETF ( XYLD ). At the end of week 119, my projected annual dividend income increased by $13.03 or 1.31% to $1,006.82, which is a forward yield of 8.35%. A new milestone has been reached as the Dividend Harvesting Portfolio has crossed over the $1,000 mark for annual dividend income.
I allocate capital toward big tech, funds, dividends, and growth outside of my retirement accounts. These are not my only investments, but I did open a separate account, so I could easily track and document this series. I intentionally created broad diversification throughout the Dividend Harvesting portfolio so I could benefit from sector rotations and mitigate my downside risk. Investors who are too exposed to growth companies or large-cap tech have gotten crushed as the investment landscape changes. On the growth and tech side of my investments, I'm feeling the pain as some of my favorite companies, including Alphabet ( GOOG , GOOGL ), Amazon ( AMZN ), and Meta Platforms ( META ), have been taken to the woodshed.
I'm going to address a question that continues to surface. I'm not trying to beat the market with this portfolio. I love index funds and am invested in several index funds. I love dividend investing due to the stream of cash flow it generates. I don't want 100% of my assets outside of real estate tied to an S&P index fund. I have created a personal investment strategy that works to achieve my investment goals, and having a stream of income generated from dividends is part of my investment strategy. Low-cost index funds are one of the best investments anyone can make in my opinion, and the Dividend Harvesting portfolio is not meant to be a substitute for an index fund. I have read many questions about dividend investing and wanted to start a portfolio from the ground up and document its progress to disprove many misconceptions, including that you need a large amount of seed capital to make dividend investing work for you.
This series has never been about hitting a target yield, generating a certain amount of profit, or beating the market. I had two specific goals with this series. The first was to create a blueprint for constructing a dividend portfolio by documenting the journey starting from the beginning. The second goal was to illustrate how allocating capital each week toward investing, regardless of the amount, would be beneficial in the long run.
Too many people are under the illusion that you need tens of thousands or even hundreds of thousands to benefit from investing. Instead of using my real dividend portfolio as an example, I decided to start a new account, fund it with $100, and add $100 weekly, providing a step-by-step guide to dividend investing. This methodology doesn't have to be used for dividend investing, and it could be as simple as an S&P index fund or a Total Market fund. Hopefully, this series is inspiring people to invest in their future to attain financial freedom.
A Historical recap of the Dividend Harvesting Portfolio's investment principles
Investment Objectives
- Income generation
- Downside mitigation through diversification
- Capital appreciation
Below are the fundamental rules I have put in place for this Portfolio:
- Allocate $100 weekly to this Portfolio
- Only invest in dividend-producing investments
- No position can exceed 5% of the Portfolio
- No sector can exceed 20% of the Portfolio
- All dividends and distributions are to be reinvested
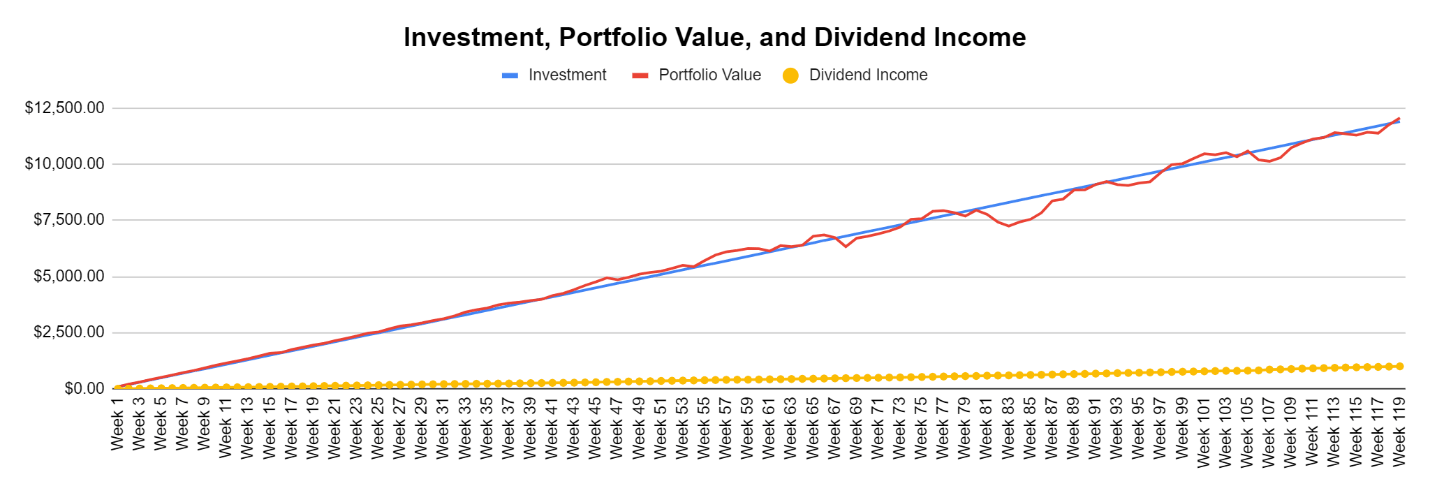
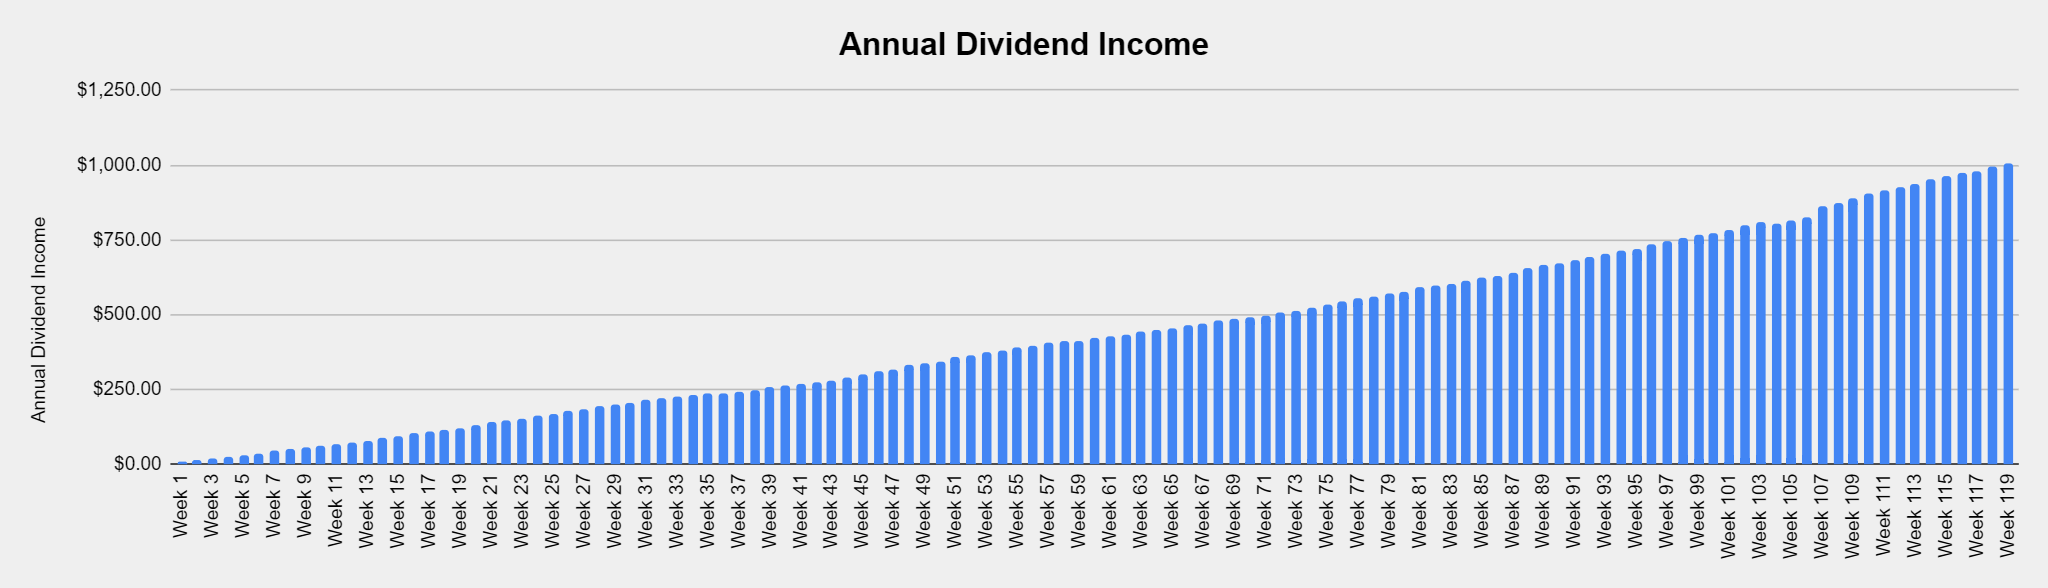
Below is a chart that extends from week 1 through the current week to illustrate the Dividend Harvesting Portfolio's Progression
- Blue line is my initial investment of $100 in week 1, $1,000 in week 10, etc.
- Red line is the account value at the end of each week
- Yellow line is the annual dividend income the Dividend Harvesting Portfolio was projected to generate after that week's investments and dividends reinvested
The Dividend Harvesting Portfolio dividend section
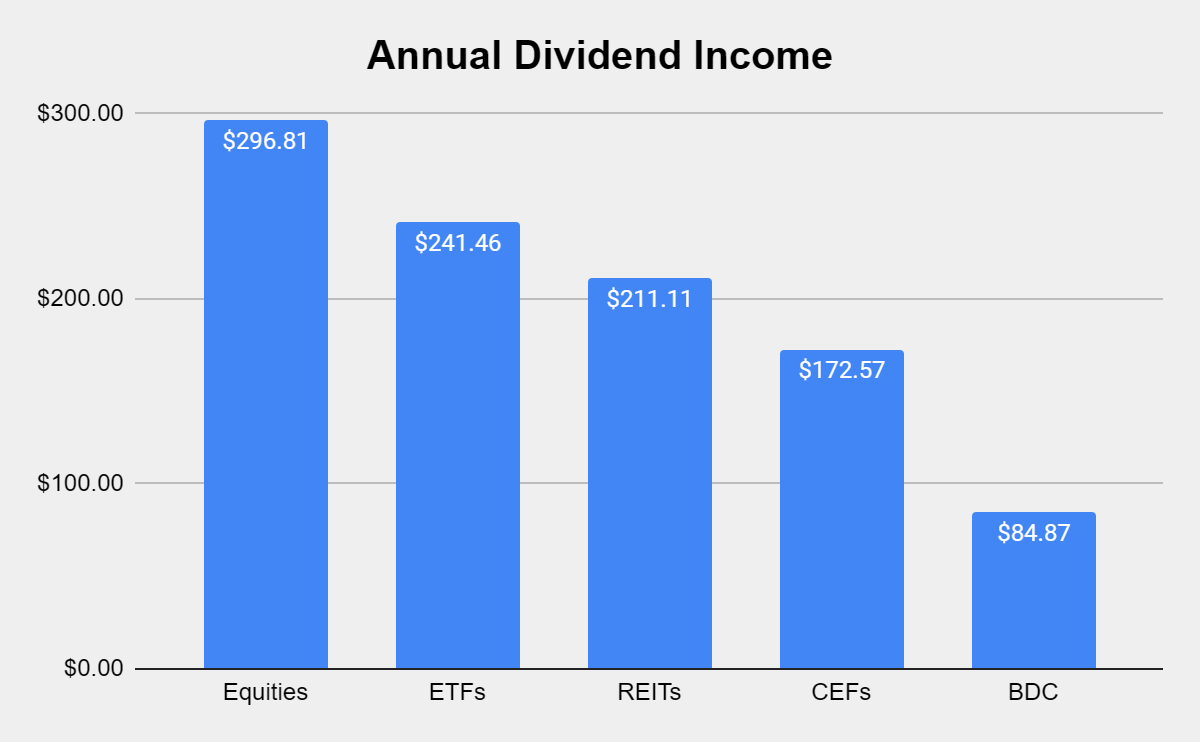
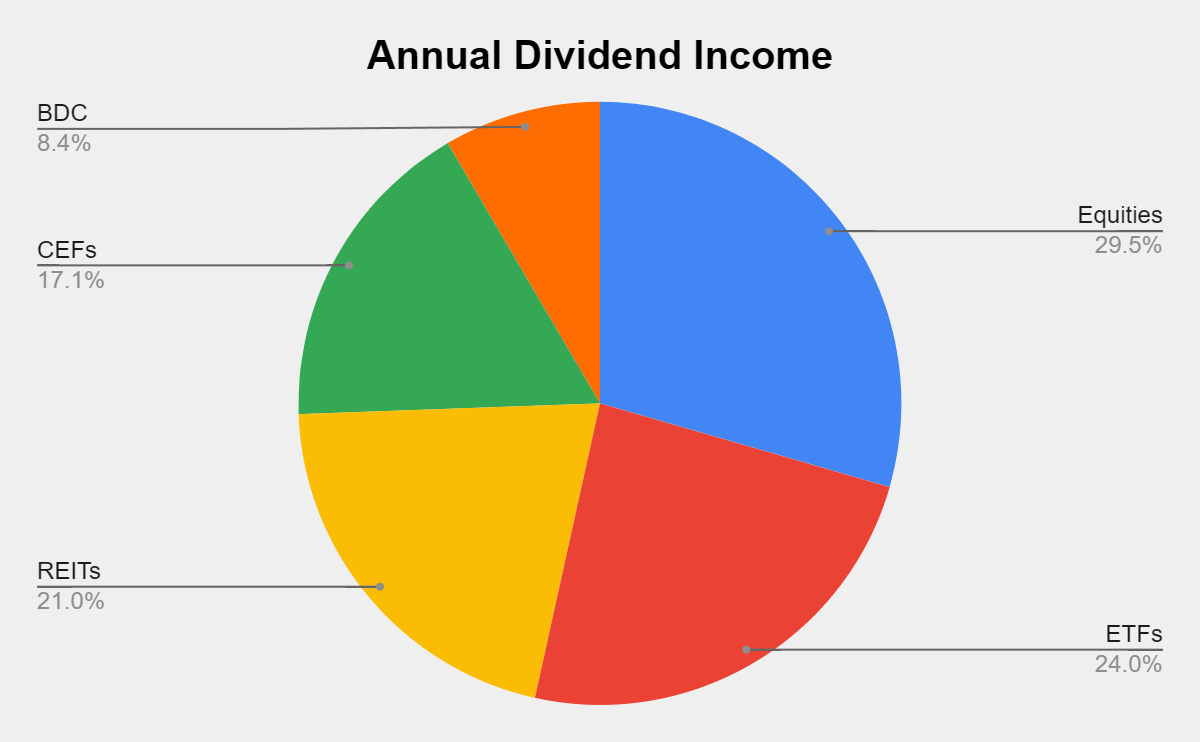
Here's how much dividend income is generated per investment basket:
- Equities $296.81 (29.48%)
- ETFs $241.46 (23.98%)
- REITs $211.11 (20.97%)
- CEFs $172.57 (17.14%)
- BDCs $84.87 (8.43%)
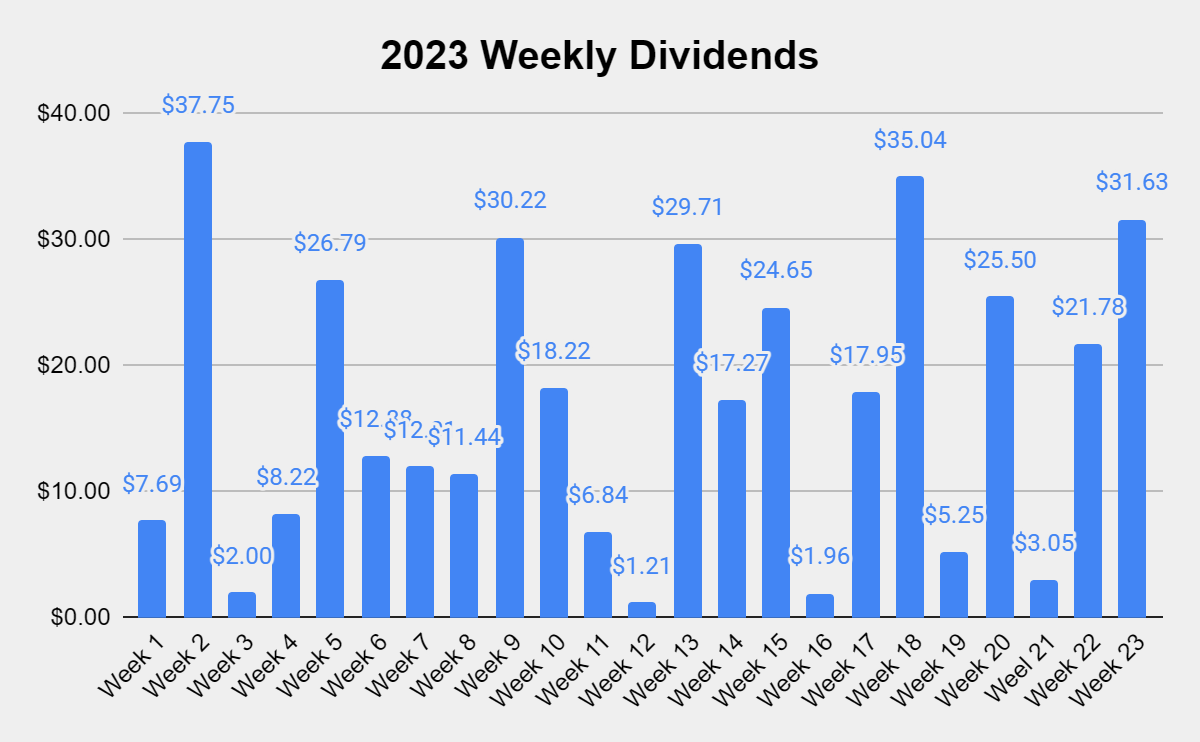
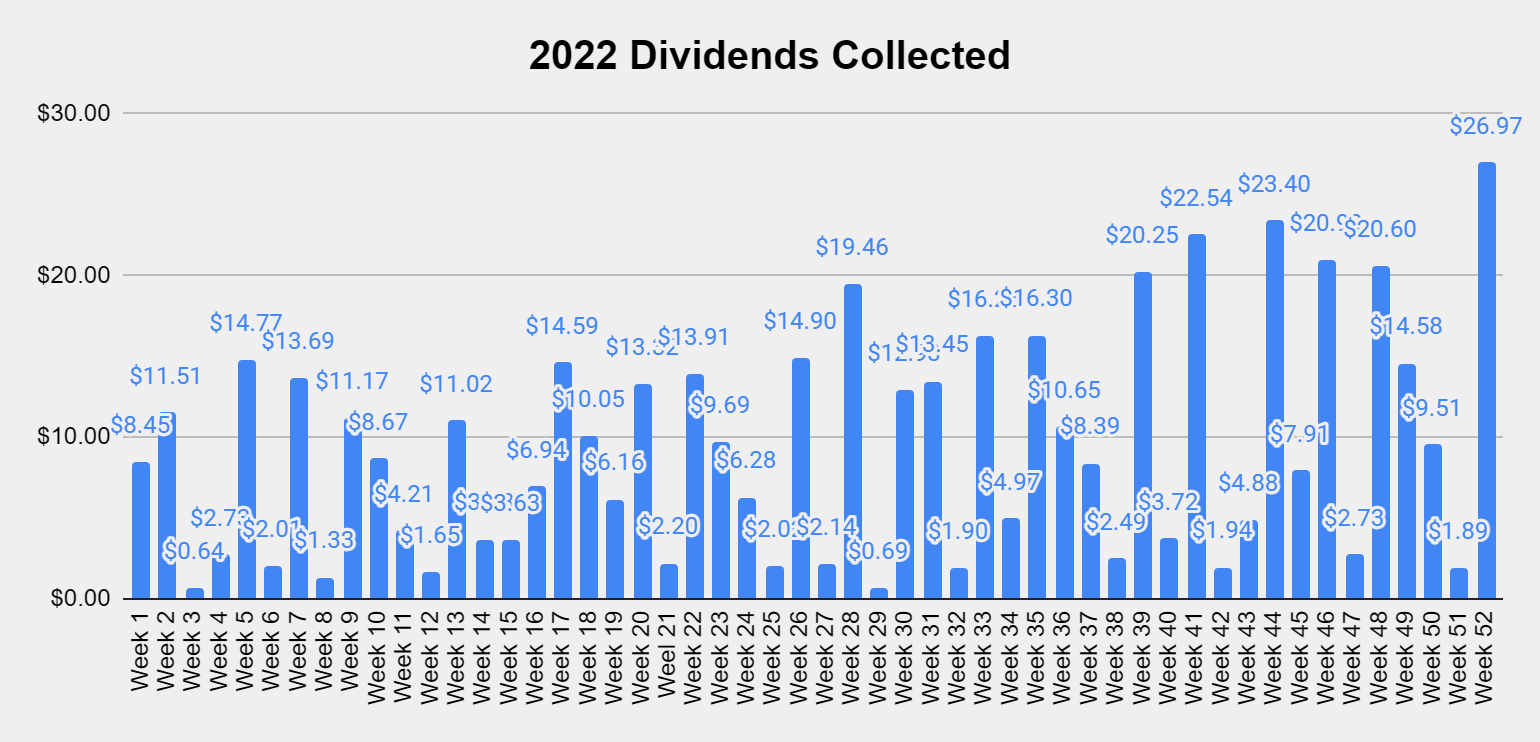
Collecting dividends can serve many functions in a portfolio. Some investors utilize dividends to supplement their income and live off of them. I'm building a dividend portfolio for myself 30 years into the future. In 2022, I collected $490.76 in dividend income from 533 dividends. In week 23 of 2023, I collected $31.63 in dividends, and in 2023 I generated $389.06 in dividend income. YTD, I have generated 79.28% of my 2022 dividend income from 283 dividends which is 53.10% of the dividends generated throughout 2022.
These dividends allow me to gain additional equity in my investments while increasing my future cash flow in down markets. This style of investing isn't for everyone, but if you're looking to generate consistent cash flow while mitigating downside risk, this method has worked for me. I'm hoping to collect around $1,000 in dividends in 2023, which will be reinvested.
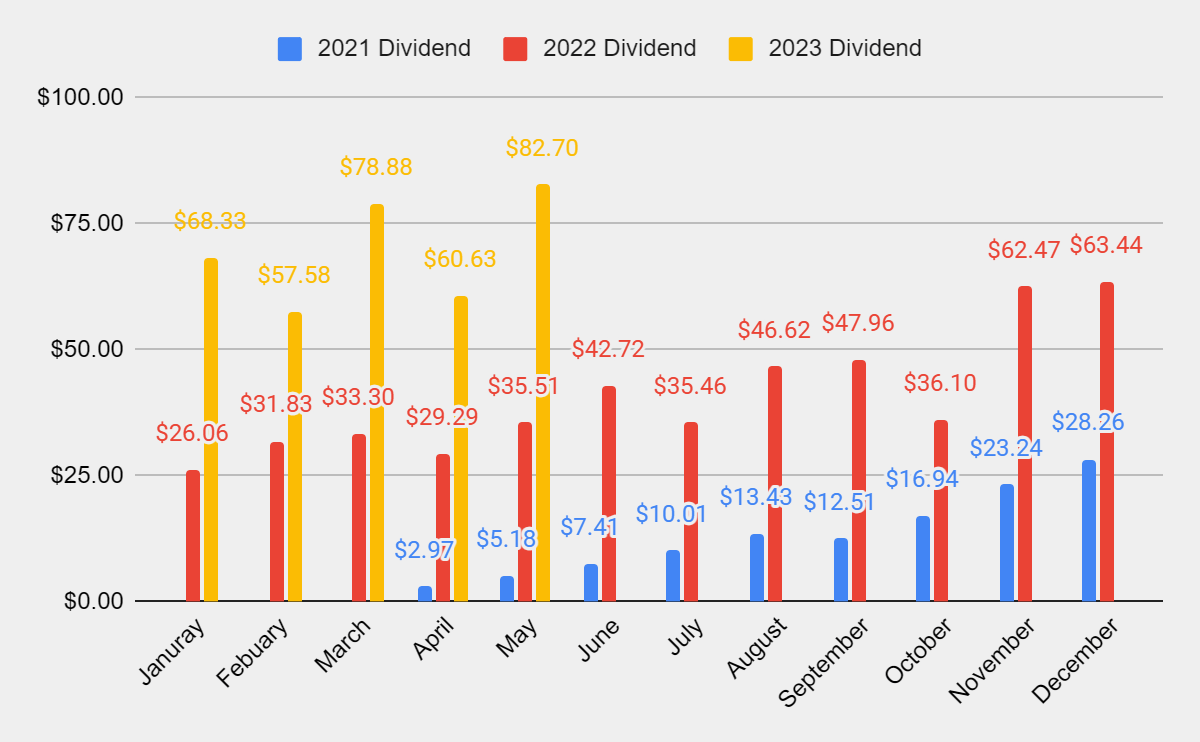
May has officially ended, and it was my largest month of dividend income to date. Throughout May, the Dividend Harvesting Portfolio produced 57 individual dividends and generated $82.70 in income. This is an increase of 132.89% YoY as my dividend income in May of 2023 jumped $47.19 from May of 2022.
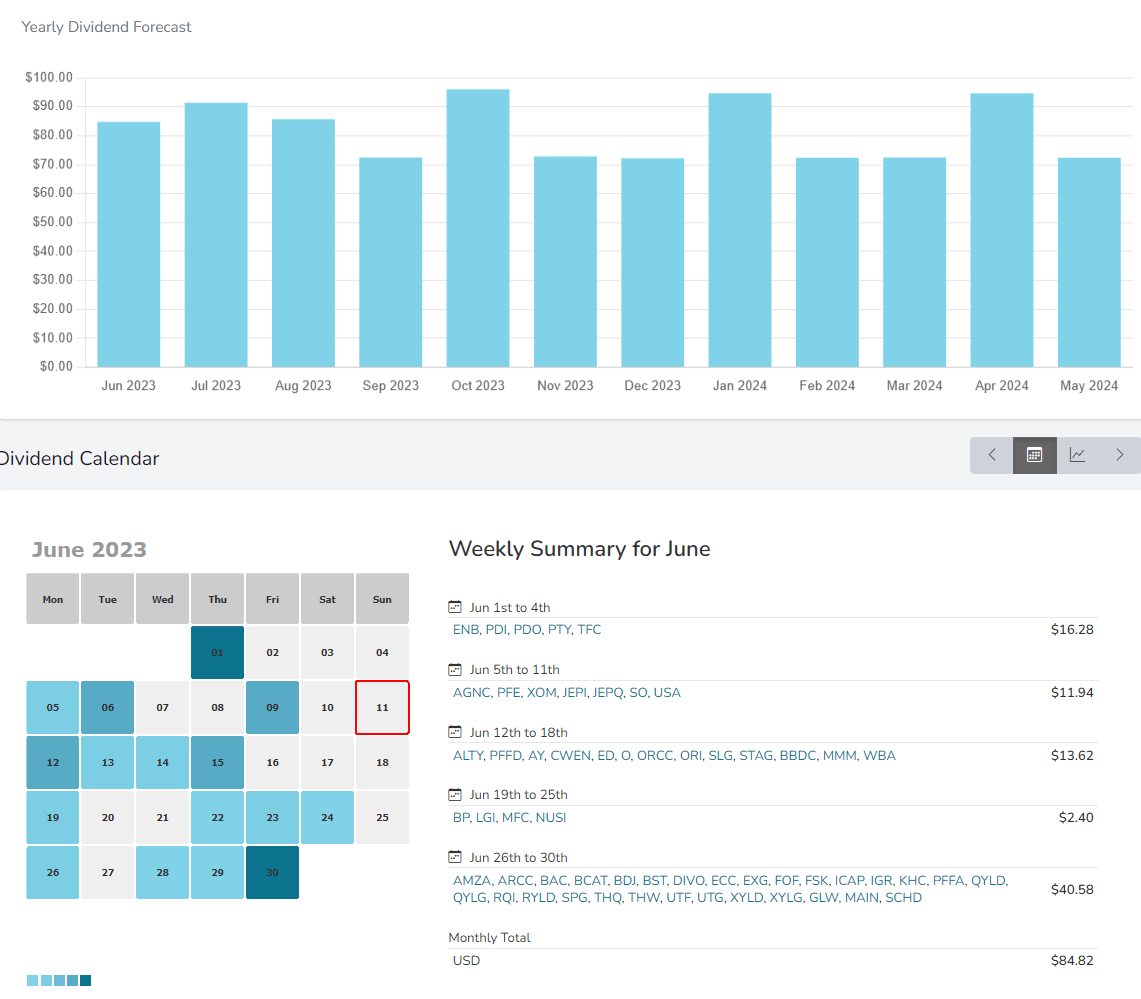
I found a tool that can track and visualize my monthly and weekly dividend income. I plan on showing this graph rather than the full year as it's a better visualization than what I had created. I really enjoy the payout calculator feature as this allows me to see my estimated monthly and weekly income and view every dividend rolling in one place. In the first several days of June, some big positions, such as Enbridge ( ENB ) generated its dividend. I am looking forward to more than 50 positions generating dividends as the month progresses. June should be another $80+ month of dividend income.
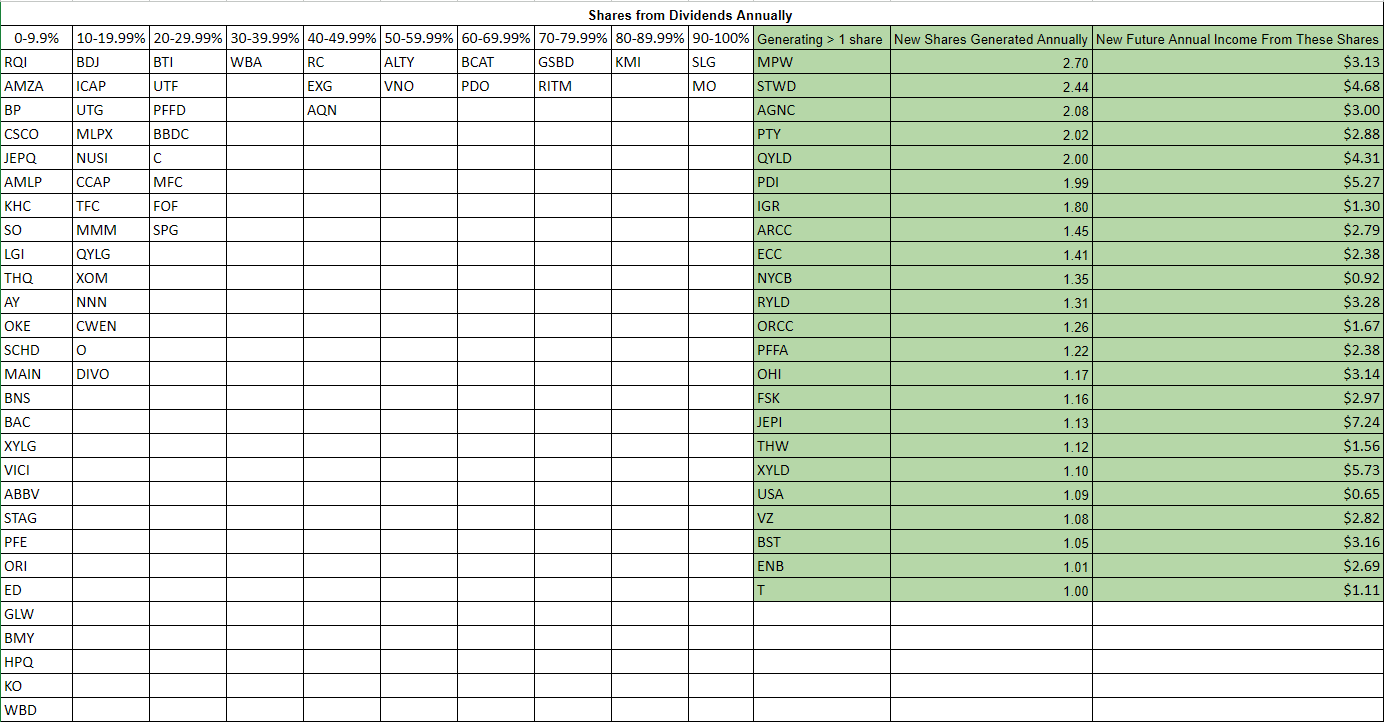
I have broken this into two sections, positions not generating at least one share per year through its dividend and positions that are. In the section for the positions that are, I have shaded it green and added how many shares annually are being generated and the new future dividend income those new shares will generate. There are currently 23 positions generating at least one new share annually from their dividends, and the new annual dividend income being generated from these shares is $69.05.
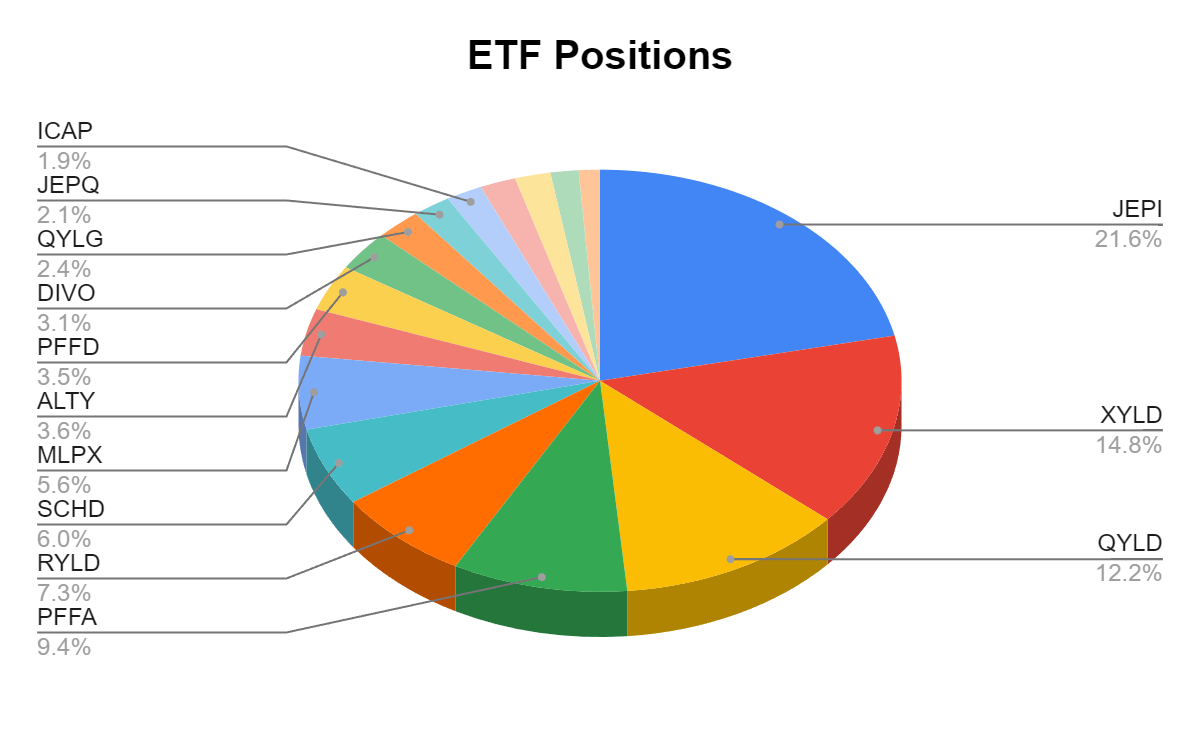
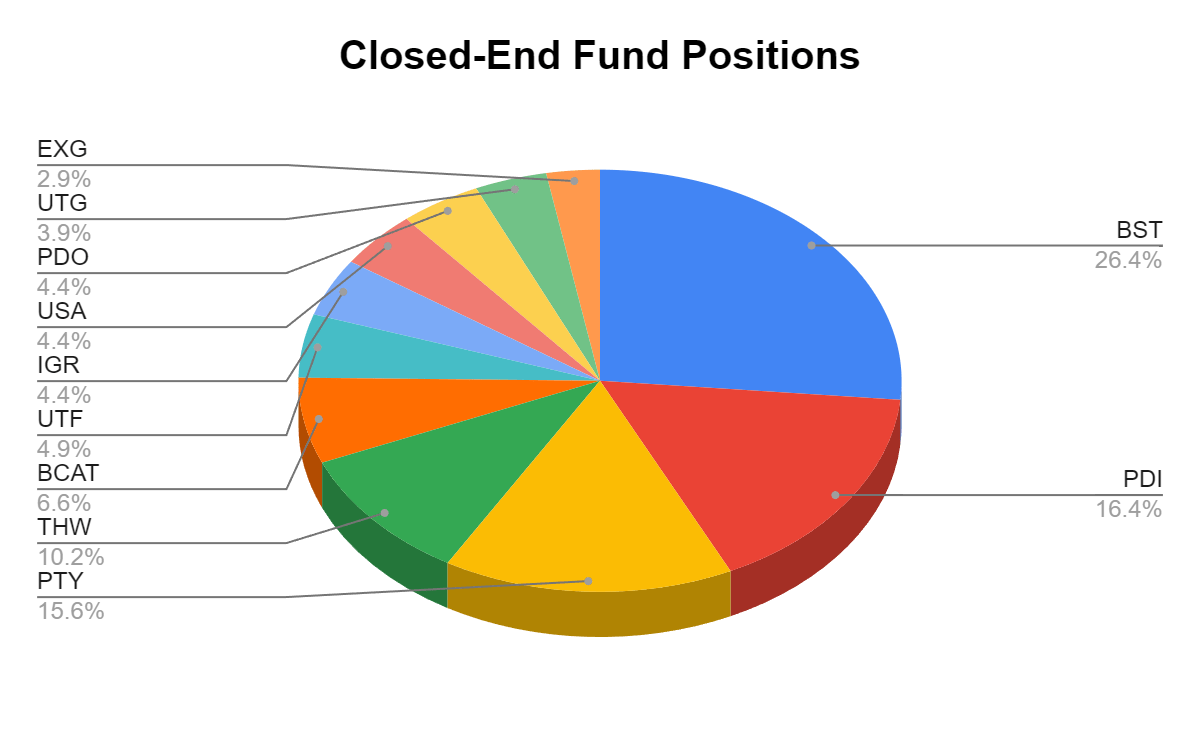
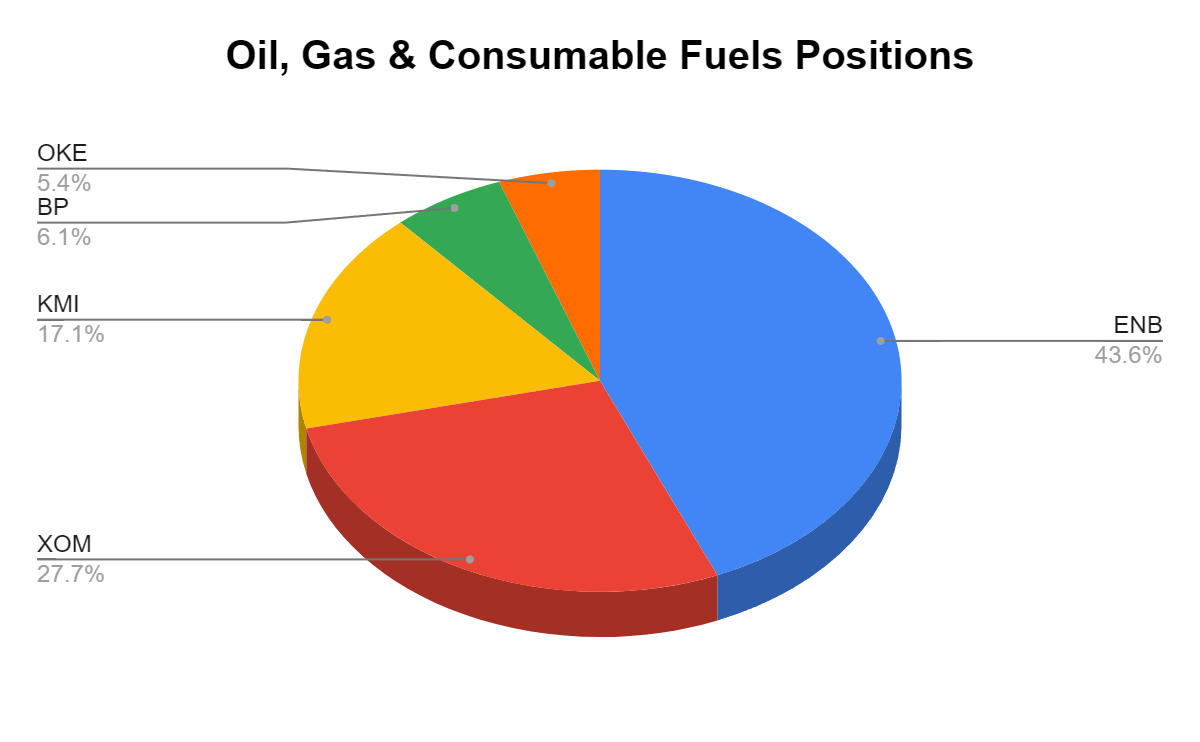
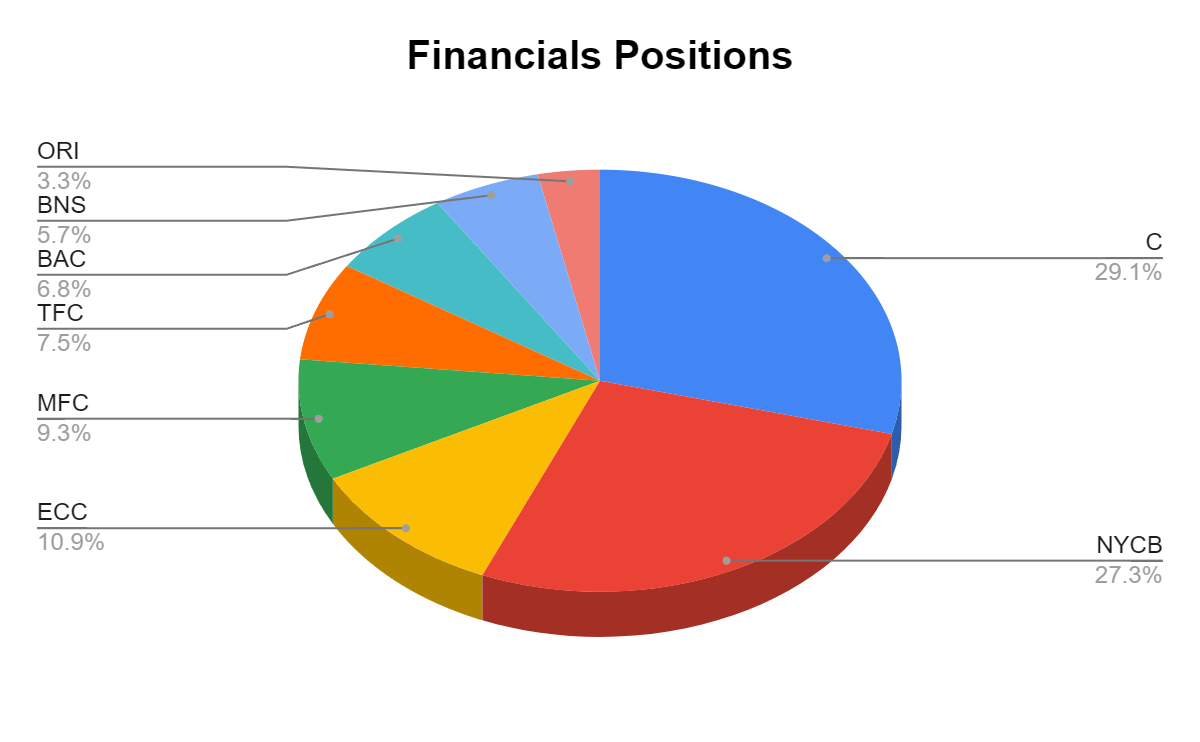
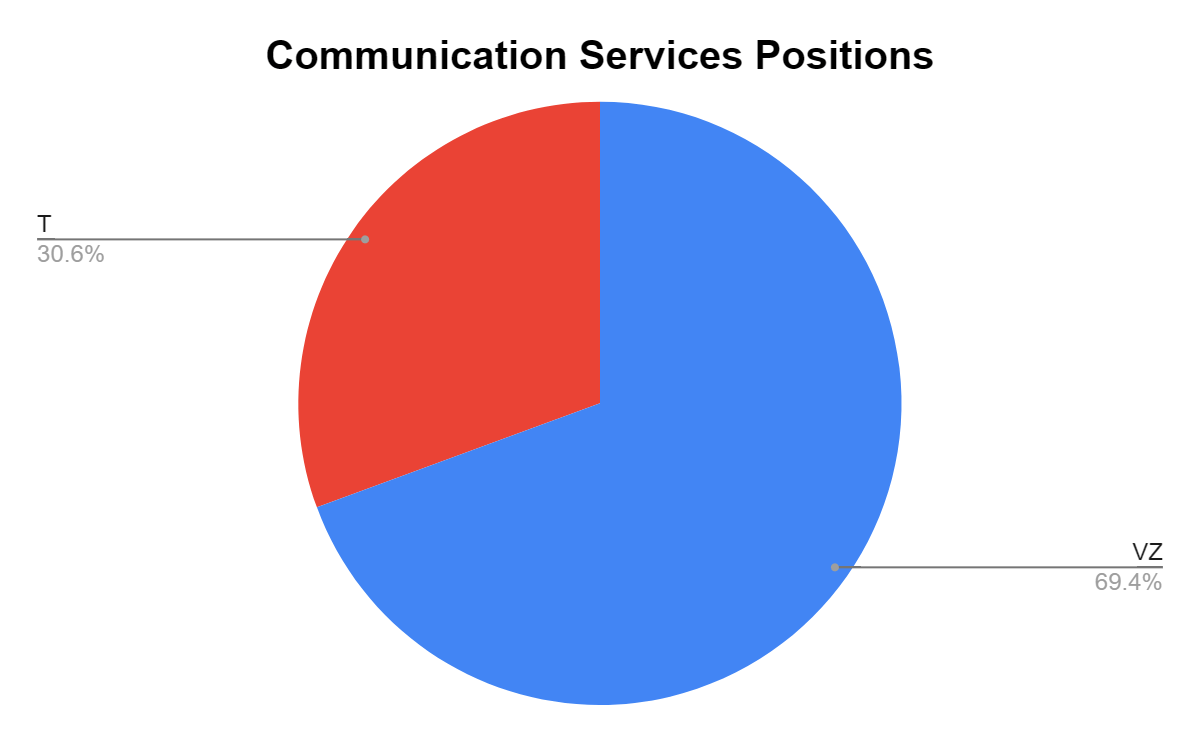
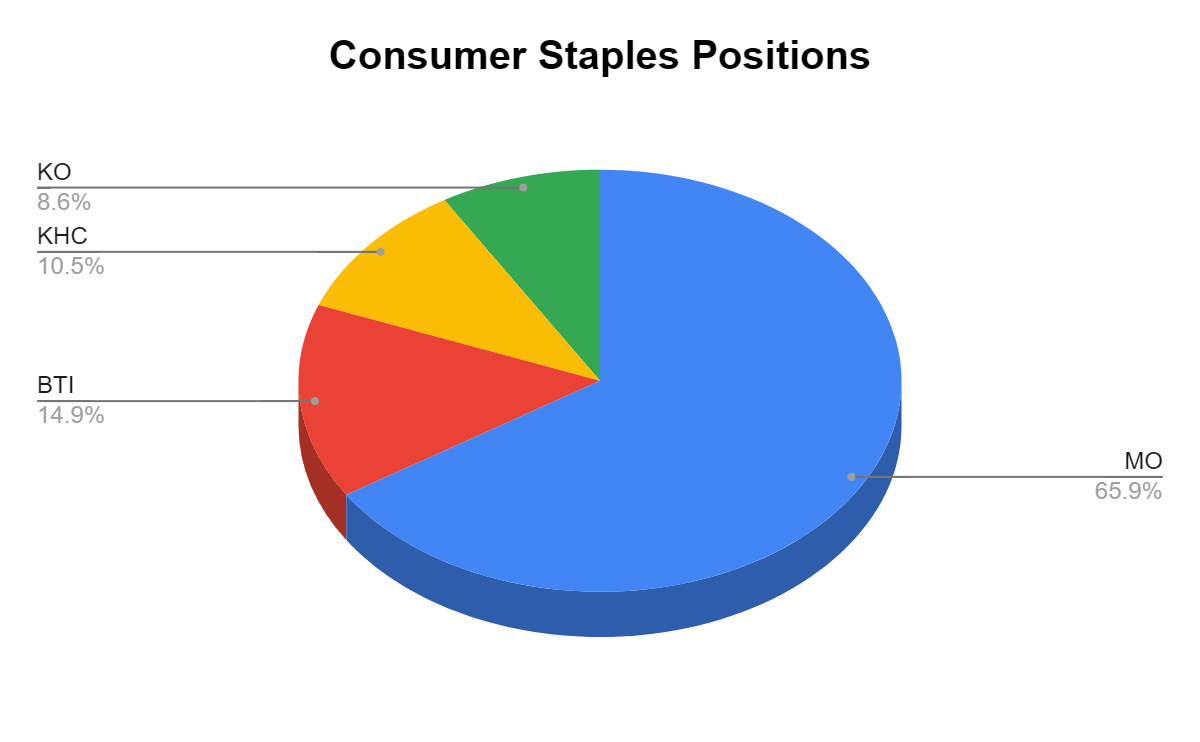
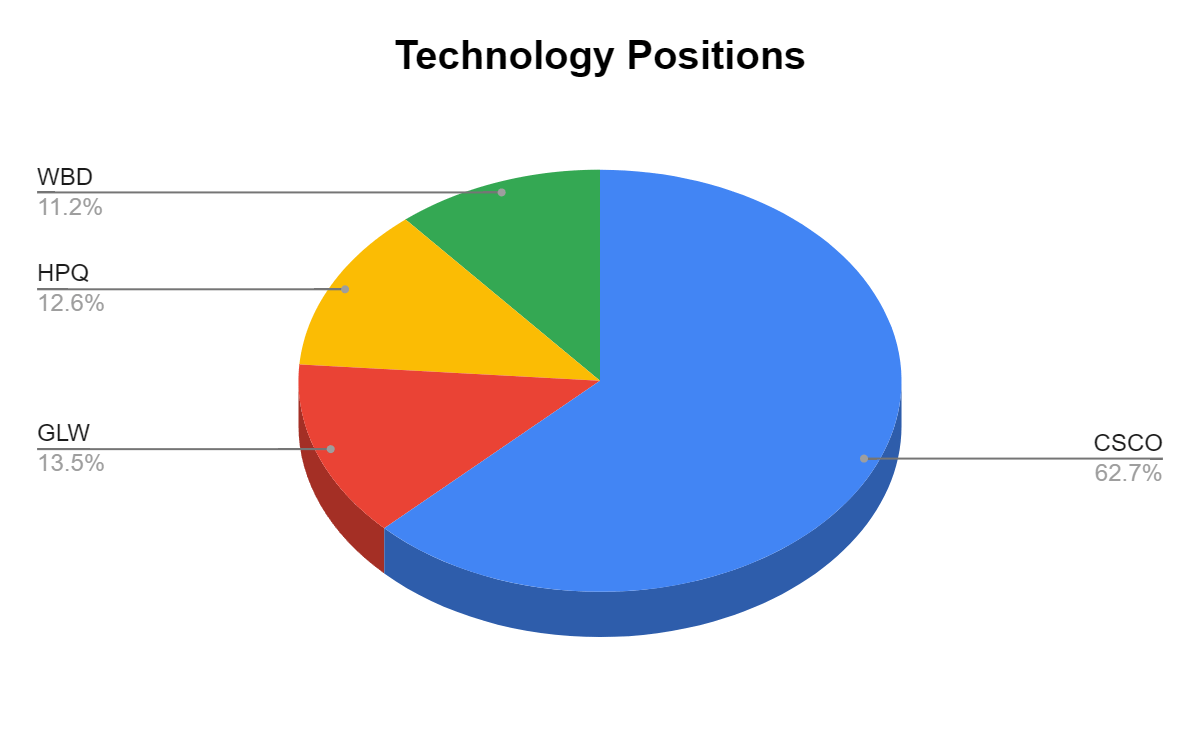
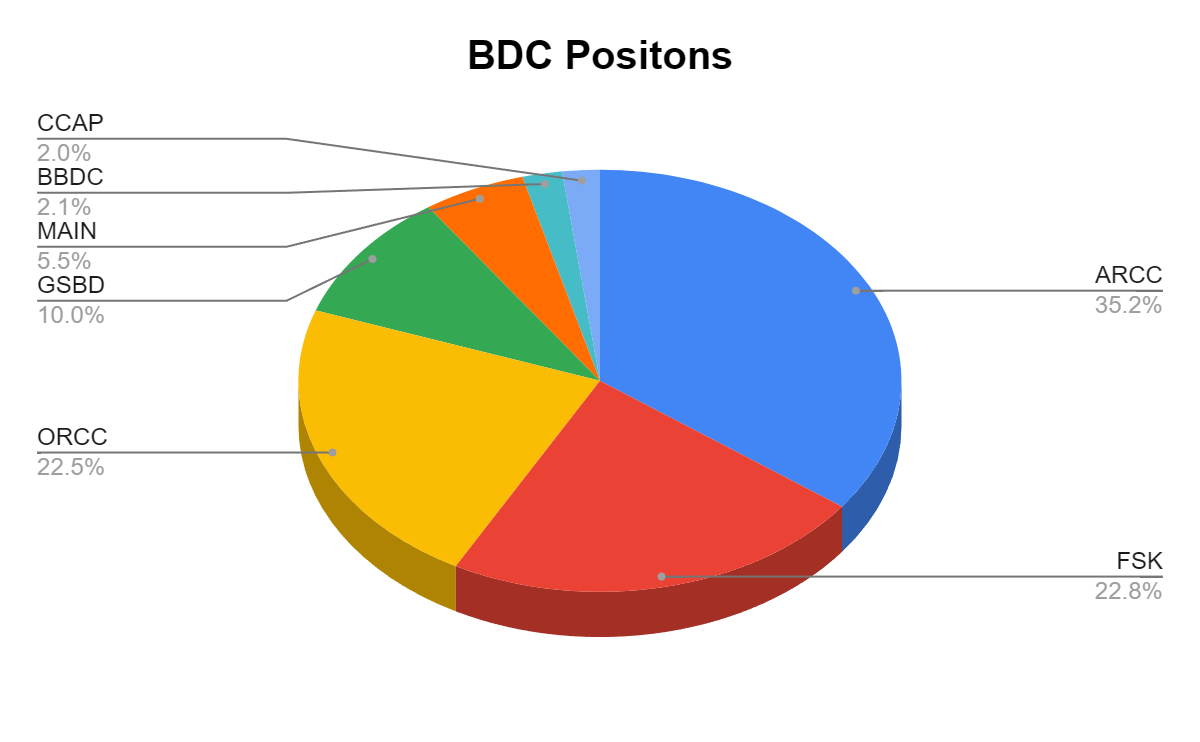
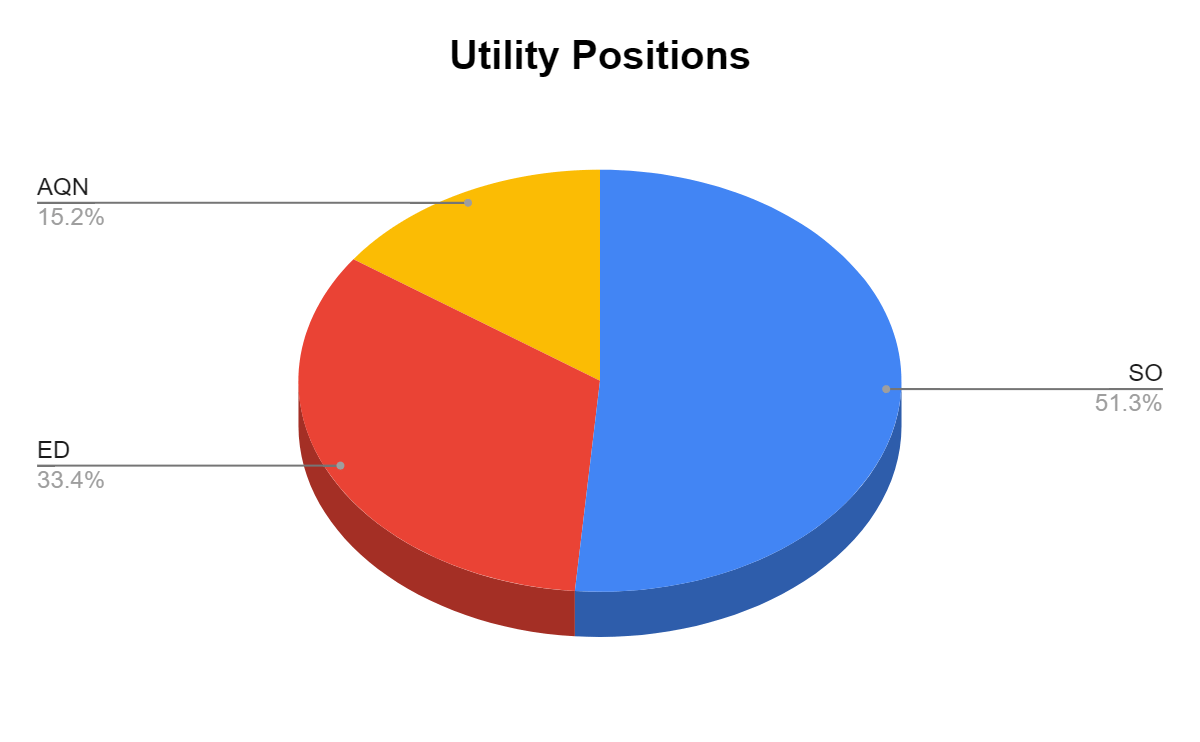
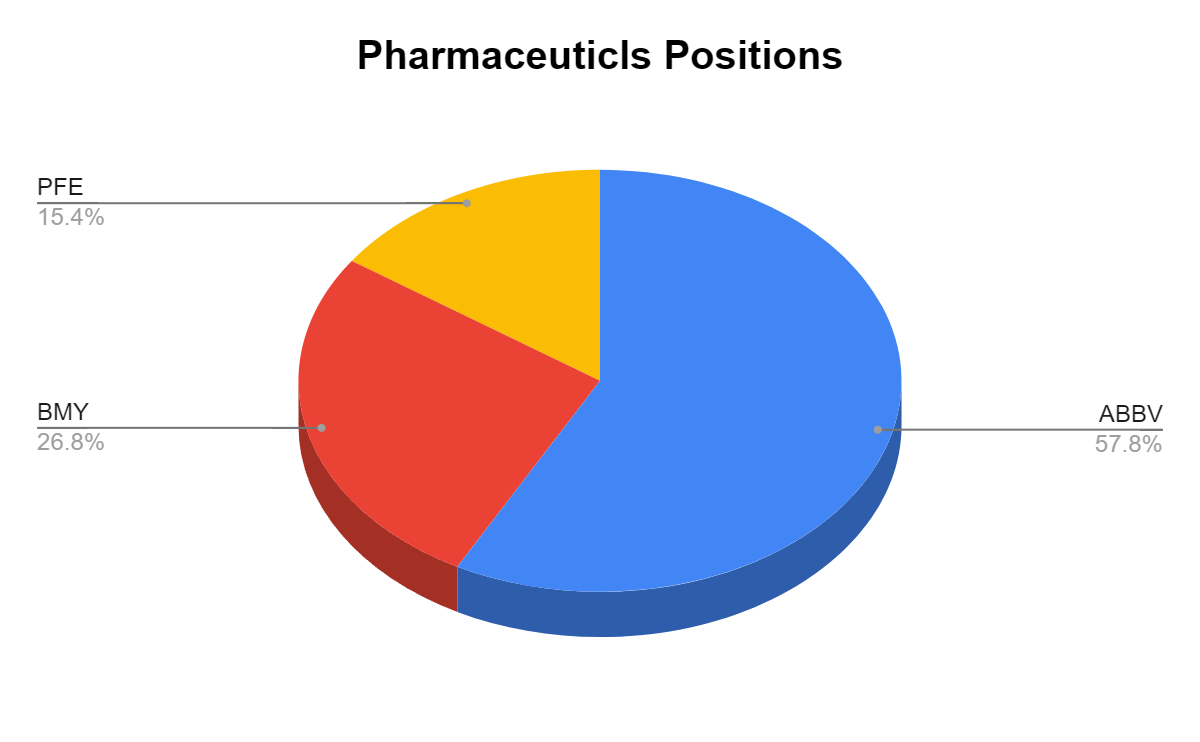
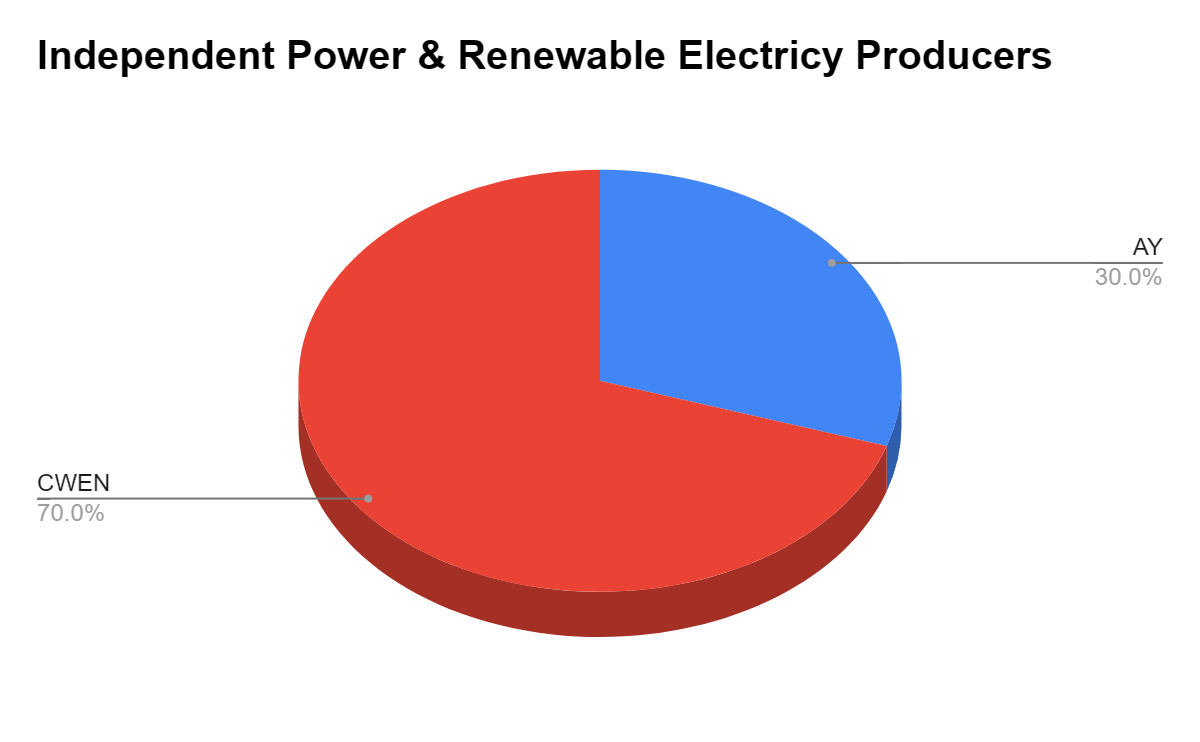
The Dividend Harvesting Portfolio Composition
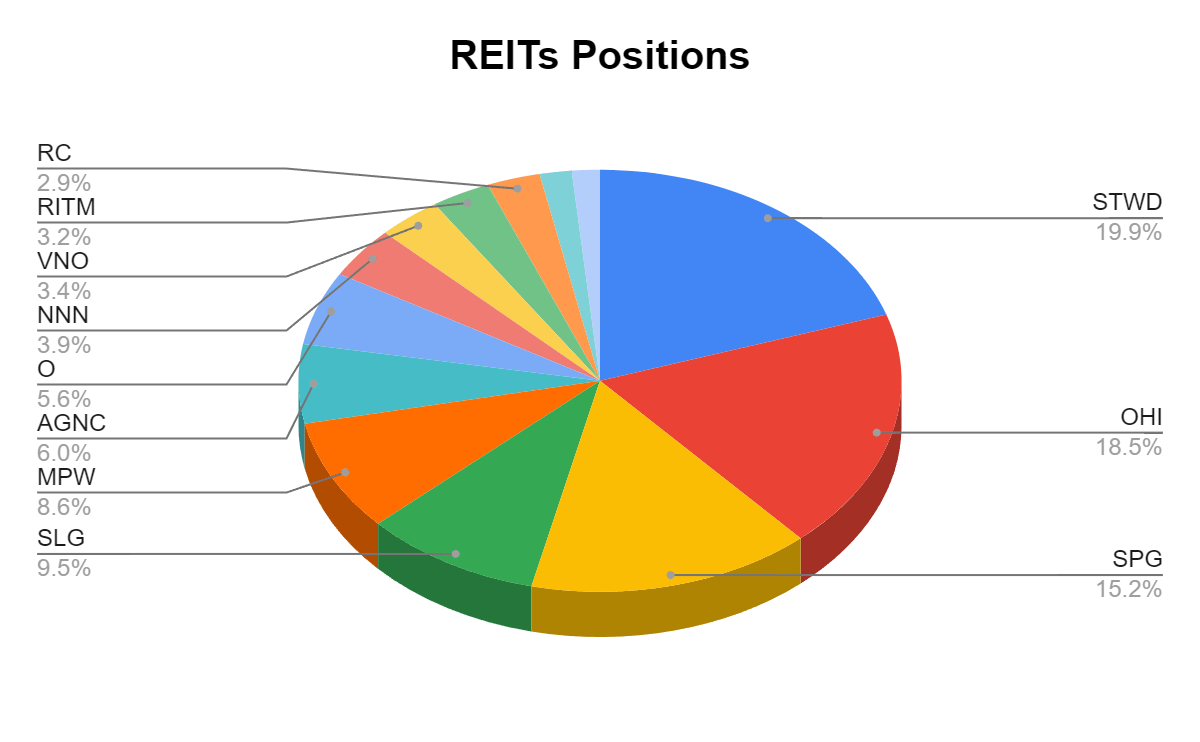
Many of the readers have asked if I could break down the individual positions within these sectors. I created pie charts for each individual sector and have illustrated how much each position represents of that sector of the Dividend Harvesting portfolio. Since I only have one position in Food & Staple Retailing and Industrials, I did not make a chart for those. 3M ( MMM ) and Walgreens Boots Alliance ( WBA ) represent 100% of those sectors. The charts will follow the normal portfolio total I have constructed. Please keep the ideas coming, as I am happy to add as much detail to this series as I can.
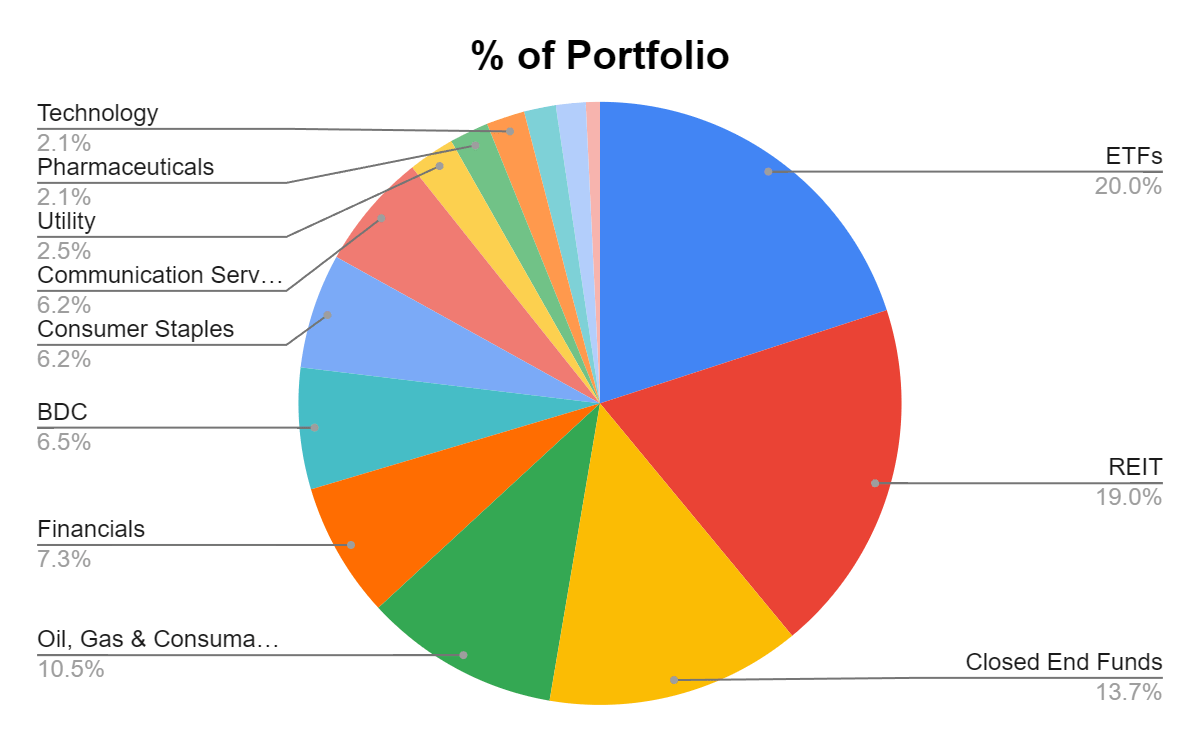
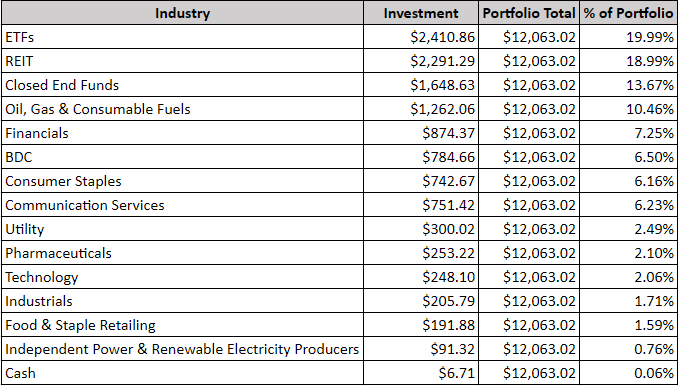
ETFs have finally gotten back to the 20% threshold. ETFs remained the largest section of the Dividend Harvesting Portfolio's composition after week 119 finished. I am going to try and bring ETFs down a bit further prior to adding to the current positions. Individual equities make up 40.79% of the portfolio and generate 29.48% of the dividend income, while exchange-traded funds ("ETFs"), closed-end funds ("CEFs"), real estate investment trusts ("REITs"), business development companies ("BDCs"), and exchange-traded notes ("ETNs") represent 59.21% of the portfolio and generate 70.52% of the dividend income.
I have a 20% maximum sector weight, so when a singular sector gets close to that level, I make sure capital is allocated away from that area to balance things out. This is the first time I have exceeded 20% in a single sector of the portfolio. I will be allocating capital away from ETFs for a while to get this sector under 20%.
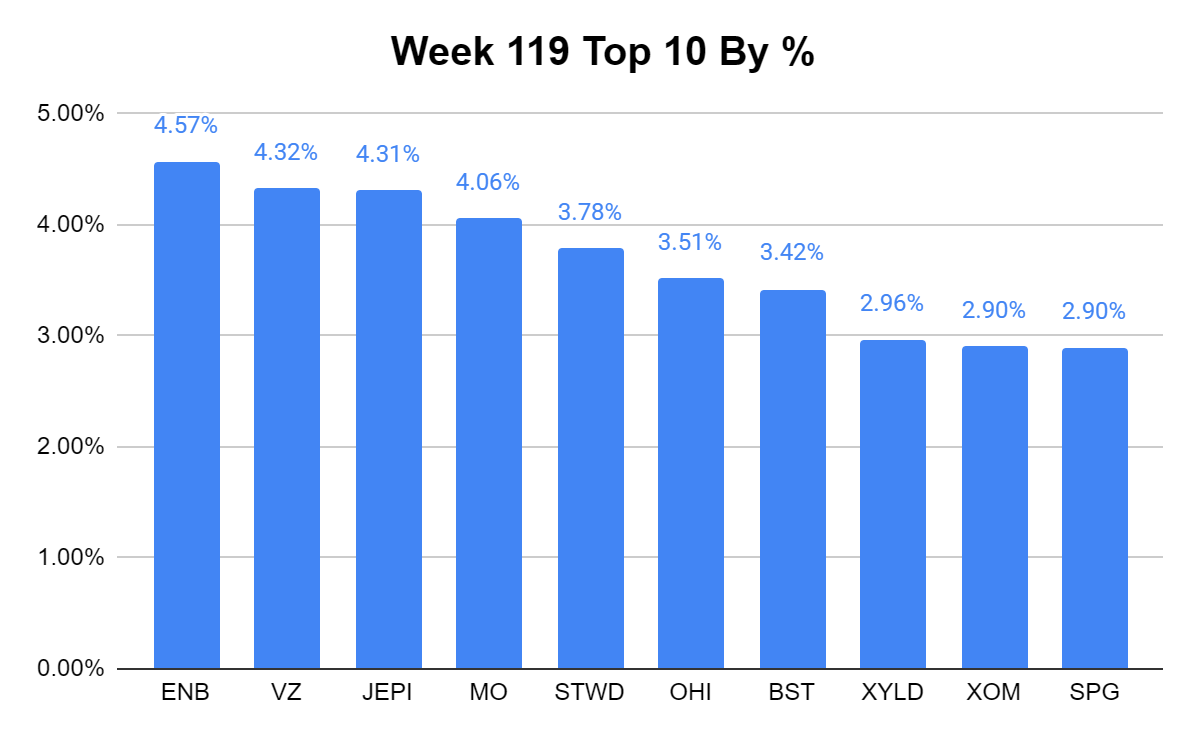
In week 119, Enbridge ( ENB ) remained my largest position, while Verizon ( VZ ) slid back into the second largest spot. I am happy that nothing is close to the 5% level, and I am planning on trying to have ENB, VZ, and the JPMorgan Equity Premium Income ETF ( JEPI ) get closer to 4% as the weeks progress.
Week 119 Additions
In week 119, I added to the following positions:
AT&T
- After news broke that Amazon ( AMZN ) was considering offering mobile service to Prime customers, shares of AT&T dropped. I wrote a dedicated article ( can be read here ) discussing why I was still bullish on AT&T. AS the yield crossed the 7% level, I added 2 shares to my position, and I plan on adding more in the future.
SL Green Realty
- I needed to add another share to get SLG to generate an additional share per year through its dividends. I added to my position, and SLG continued to go up and fell back under the 100% level. I think SLG is undervalued, and the narrative around NYC is incorrect for class-A buildings near Grand Central and Penn Station.
Global X S&P 500 Covered Call ETF
- I added XYLD because I think the S&P 500 will continue to appreciate, and I needed another share to generate 1 share annually from its dividend.
Conclusion
The Dividend Harvesting Portfolio has officially reached a new milestone, as it is now producing over $1,000 of annual dividend income. It took 119 weeks to get here. I am interested to see how long it will take to reach $2,000 of projected annual dividend income. We're heading into week 120, and I will be adding a new position from the reader suggestions. There have been some excellent suggestions, and I am looking forward to seeing this week's recommendations. Hopefully, the outcome of the FOMC meeting doesn't negatively impact the markets, and the Dividend Harvesting Portfolio continues its uptrend further into positive territory.
For further details see:
Dividend Harvesting Portfolio Week 119: $11,900 Allocated, $1,006.82 In Projected Dividends