DLN - DLN: Ahead Of Competitors In 2023 But Behind SCHD In The Long Run
2023-09-08 02:18:53 ET
Summary
- WisdomTree U.S. LargeCap Dividend Fund invests in dividend stocks after filtering them with a risk score.
- DLN is superior to the S&P 500 index regarding both valuation and quality.
- Year-to-date, DLN is ahead of the most popular dividend ETFs with a 2.5% to 4% yield.
- However, it is behind SCHD in the last 10 years, regarding both return and dividend growth.
This article series aims at evaluating ETFs (exchange-traded funds) regarding past performance and portfolio metrics. Reviews with updated data are posted when necessary.
DLN strategy and portfolio
WisdomTree U.S. LargeCap Dividend Fund (DLN) started investing operations on 06/16/2006 and tracks the WisdomTree U.S. LargeCap Dividend Index. It has 298 holdings, a distribution yield of 2.55%, and an expense ratio of 0.28%. Distributions are paid monthly.
As described by WisdomTree , the index is constituted of the 300 largest companies ranked by market capitalization from the WisdomTree U.S. Dividend Index. Eligible companies must be incorporated and headquartered in the U.S., have a market capitalization of at least $100 million and a 3-month median daily dollar volume of at least $100,000. Limited Partnerships (in particular MLPs) and Business Development Companies are excluded. A risk score is calculated based on profitability metrics and momentum. Companies in the bottom decile are excluded, as well as those in the bottom half and in the top 5% dividend yields.
Constituents are weighted annually based on total dividends, which is in favor of mega-cap companies. The weight is adjusted to the upside for companies in the safer two deciles of the risk ranking. Capping rules are applied to limit the weight of constituents and sectors.
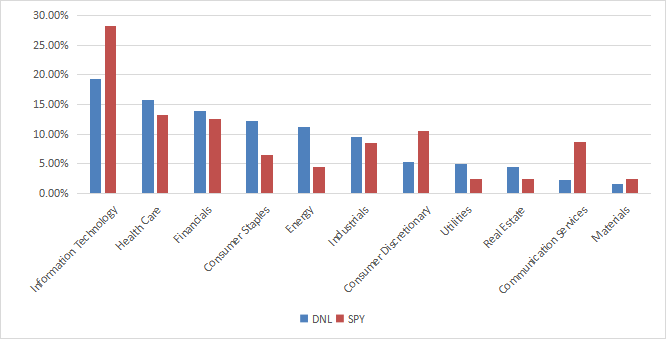
About 82% of asset value in large and mega caps companies. Information technology is the heaviest sector, but with a lower weight than in the S&P 500 ( SPY ): 19.2% vs. 28.2%. Compared to the large cap benchmark, DLN significantly overweights consumer staples, energy, utilities and real estate. It underweights technology, consumer discretionary and communication.
DLN sector breakdown (chart: author; data: WisdomTree, SSGA)
The top 10 holdings, listed below with fundamental ratios, represent 26.4% of asset value. Risks related to individual companies are moderate: all weights are below 5%.
| Ticker |
| Name |
| Weight |
| EPS growth % ttm |
| P/E ttm |
| P/E fwd |
| Yield % |
| Apple, Inc. |
| 4.41% |
| -1.68 |
| 30.74 |
| 30.21 |
| 0.52 |
| Microsoft Corp. |
| 4.34% |
| 0.42 |
| 34.37 |
| 30.29 |
| 0.82 |
| Exxon Mobil Corp. |
| 3.88% |
| 36.57 |
| 9.16 |
| 12.47 |
| 3.18 |
| Chevron Corp. |
| 2.50% |
| 5.30 |
| 10.57 |
| 12.43 |
| 3.62 |
| AbbVie, Inc. |
| 2.24% |
| -31.10 |
| 29.90 |
| 13.18 |
| 4.07 |
| JPMorgan Chase & Co. |
| 2.08% |
| 24.77 |
| 9.32 |
| 9.14 |
| 2.76 |
| Broadcom Inc. |
| 1.76% |
| 41.21 |
| 26.92 |
| 20.71 |
| 2.11 |
| Cisco Systems, Inc. |
| 1.74% |
| 9.02 |
| 18.60 |
| 14.07 |
| 2.73 |
| Merck & Co., Inc. |
| 1.72% |
| -81.42 |
| 87.70 |
| 35.32 |
| 2.74 |
| The Coca-Cola Co. |
| 1.70% |
| 9.95 |
| 24.30 |
| 22.24 |
| 3.13 |
Ratios from Portfolio123
Performance
Since 7/1/2006, DLN has underperformed SPY by 1.4 percentage point in annualized return. Risk metrics are close to the benchmark (volatility and maximum drawdown in the next table).
| Total Return |
| Annual Return |
| Drawdown |
| Sharpe Ratio |
| Volatility |
| DLN |
| 287.86% |
| 8.21% |
| -57.84% |
| 0.53 |
| 14.86% |
| SPY |
| 385.79% |
| 9.64% |
| -55.19% |
| 0.6 |
| 15.68% |
Data calculated with Portfolio123
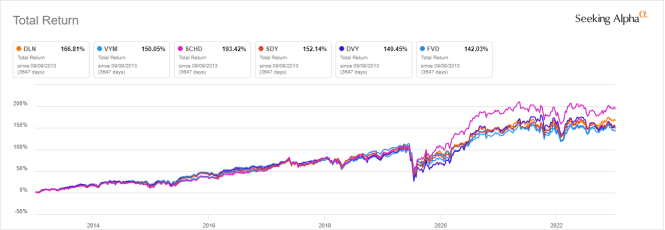
The next chart compares the 10-year total returns of DLN and five popular dividend ETFs with yields between 2.5% and 4%:
- Vanguard High Dividend Yield Index ETF (VYM)
- Schwab US Dividend Equity ETF (SCHD)
- SPDR S&P Dividend ETF (SDY)
- iShares Select Dividend ETF (DVY)
- First Trust Value Line Dividend Index Fund (FVD)
DLN is the second best performer after SCHD. The gap was mostly created after the 2020 market meltdown.
DLN vs. Competitors, last 10 years (Seeking Alpha)
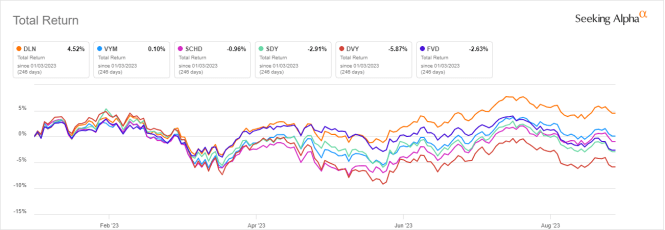
However, DLN is leading the pack in 2023 to date:
DLN vs. Competitors, year-to-date (Seeking Alpha)
In previous articles, I have shown how three factors may help cut the risk in a dividend portfolio: Return on Assets , Piotroski F-score , and Altman Z-score .
The next table compares DLN since 7/1/2006 with a subset of the S&P 500: stocks with an above-average dividend yield, an above-average ROA, a good Altman Z-score, a good Piotroski F-score and a sustainable payout ratio. The subset is rebalanced annually to make it comparable with a passive index.
| Total Return |
| Annual Return |
| Drawdown |
| Sharpe Ratio |
| Volatility |
| DLN |
| 287.86% |
| 8.21% |
| -57.84% |
| 0.53 |
| 14.86% |
| Dividend quality subset |
| 512.67% |
| 11.13% |
| -43.59% |
| 0.69 |
| 15.59% |
P ast performance is not a guarantee of future returns. Data Source: Portfolio123
DLN underperforms this dividend quality subset by about 2 percentage points in annualized return. However, ETF performance is real and the subset is simulated. My core portfolio holds 14 stocks selected in this subset (more info at the end of this post).
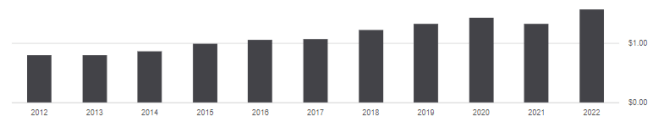
Annualized distributions have increased by 96% between 2012 and 2022, from $0.80 to $1.57 per share, beating the cumulative inflation (about 29%) by a wide margin.
DLN distribution history (Seeking Alpha)
However, this is far behind the 216% dividend growth of SCHD in the same time.
| Annual distributions per share |
| DLN |
| VYM |
| SCHD |
| SDY |
| DVY |
| FVD |
| 2012 |
| 0.8 |
| 1.59 |
| 0.81 |
| 1.91 |
| 2.12 |
| 0.5 |
| 2022 |
| 1.57 |
| 3.25 |
| 2.56 |
| 3.2 |
| 4.14 |
| 0.83 |
| Increase |
| 96.25% |
| 104.40% |
| 216.05% |
| 67.54% |
| 95.28% |
| 66.00% |
Scanning DLN portfolio
The fund is cheaper than the S&P 500 regarding usual valuation ratios, as reported in the next table.
| DLN |
| SPY |
| Price/Earnings TTM |
| 17.73 |
| 22.4 |
| Price/Book |
| 3.07 |
| 3.99 |
| Price/Sales |
| 2.05 |
| 2.55 |
| Price/Cash Flow |
| 12.29 |
| 15.81 |
D ata: Fidelity
I have scanned DLN holdings with the quality metrics described in the previous paragraph. I consider that risky stocks are companies with at least 2 red flags among: bad Piotroski score, negative ROA, unsustainable payout ratio, bad or dubious Altman Z-score, excluding financials and real estate where these metrics are unreliable. With these assumptions, 19 holdings out of 298 are risky, and they weigh only 6.6% of asset value, which is a good point.
Based on calculations reported below, my three preferred quality metrics are superior to the benchmark.
| DLN |
| SPY |
| Altman Z-score |
| 4.4 |
| 3.54 |
| Piotroski F-score |
| 5.99 |
| 5.66 |
| ROA % TTM |
| 10.2 |
| 7.04 |
Takeaway
WisdomTree U.S. LargeCap Dividend Fund invests in dividend stocks after filtering them with a risk score. It is well-diversified across sectors and holdings. DLN is superior to the S&P 500 index regarding both valuation and quality. It has outperformed its most popular competitors in 2023 and in the last 10 years, except SCHD. Moreover, the 10-year dividend growth rate beats inflation. Nevertheless, it has underperformed the large cap benchmark in total return since inception.
For further details see:
DLN: Ahead Of Competitors In 2023, But Behind SCHD In The Long Run