DLN - DLN: Smart-Beta Dividend Play With Robust Quality
2023-11-25 01:14:20 ET
Summary
- DLN offers a mostly unsophisticated take on the U.S. mega/large-cap echelon.
- This portfolio delivers only a modest yield, which nonetheless comes with solid exposure to dividend growth stories.
- DLN's equity mix has rock-solid quality, as the unsophisticated yet capable methodology of its underlying index somewhat immunizes it from companies with value-trap symptoms.
- I am impressed by DLN's profitability and capital efficiency characteristics, but I would favor a better-valued mix, so a Hold rating is maintained.
Continuing the series of updates on dividend ETFs, today I would like to offer a fresh look at the WisdomTree U.S. LargeCap Dividend Fund ETF (DLN), which I previously reviewed in October 2020 in a note with a predominantly neutral tone.
Incepted in June 2006, DLN is a fund with a mostly unsophisticated strategy, with the simple idea of representing the performance of the U.S. large-cap dividend-paying names picked from the WisdomTree U.S. Dividend Index. As described in the summary prospectus , the goal is to select 300 constituents. Regarding weighting, the index website says that it is
...dividend weighted annually to reflect the proportionate share of the aggregate cash dividends each component company is projected to pay in the coming year, based on the most recently declared dividend per share.
There is a 25% sector cap, with the exception being real estate, which cannot account for more than 10%.
What is inside the portfolio?
As of November 22, investors could find 299 holdings inside the DLN portfolio, with Microsoft (MSFT) and Apple (AAPL) being the heaviest positions, accounting for 4.9% and 4.6%, respectively, which does not come as a surprise as in the last twelve months, MSFT returned $20.23 billion to shareholders via dividends while AAPL poured into their coffers over $15 billion . For context, the 20th largest holding, McDonald's Corporation (MCD) could afford $4.4 billion in dividends.
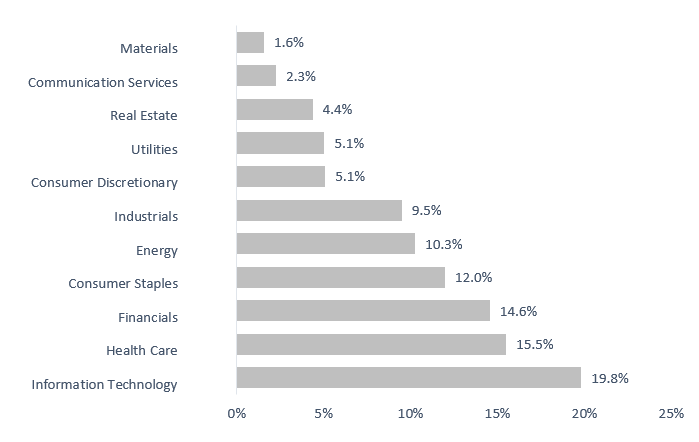
Overall, the weighting schema that prioritizes the most generous dividend payers is supportive of the mega-cap tilt. It also secures the information technology sector's dominant position in the portfolio.
Created using data from the fund
Please take notice that one of the holdings is the WisdomTree U.S. Total Dividend Fund ETF (DTD), though with a microscopic weight of 0.00035%.
Now, let us discuss the factor story in greater depth.
| Metric |
| 22-Nov |
| Market Cap |
| $448.2 billion |
| EY |
| 5.4% |
| P/S |
| 4.9 |
| EPS Fwd |
| 7.4% |
| Revenue Fwd |
| 6.2% |
| ROE |
| 51.6% |
| ROA |
| 10.1% |
| Quant Valuation B- or better |
| 18.9% |
| Quant Valuation D+ or weaker |
| 58.7% |
| Quant Profitability B- or better |
| 95.5% |
| Quant Profitability D+ or weaker |
| 2.1% |
Calculated using data from Seeking Alpha and the fund
- DLN carries a slight value tilt, as illustrated by its weighted-average earnings yield of 5.4% compared to the 4.4% EY of the S&P 500, which is achieved partly thanks to the lower market cap of $448.2 billion vs. $736.5 billion.
- Nevertheless, more meticulous investors will note here that this is just the tip of the iceberg, and with just 18.9% of the holdings having a B- Quant Valuation grade or higher, DLN looks too richly priced.
- Growth exposure is only modest, with both forward EPS and revenue growth rates in the mid-single-digits.
- Nevertheless, quality looks rock-solid, as only 2.1% of the holdings, predominantly utilities, look risky from a Quant Profitability rating perspective (D+ rating or lower).
Regarding capital efficiency, as it frequently happens with ETFs, ROE is not exactly reliable, as companies with bloated borrowings skew the figure. Let us illustrate this with a chart; the scatter plot below covers 84% of the holdings, as all components with either missing metrics or figures below 1% were removed.
Created using data from Seeking Alpha and the fund. A log scale is used for both axis
We see that DLN has exposure to firms with gargantuan debt and thus unrealistic ROE, with Home Depot (HD) being the notable example. However, we can double-check whether it has a healthy share of the most efficient companies using Return on Assets. And the ROA of over 10% here looks solid, but please bear in mind that the figure was bolstered chiefly by MSFT, AAPL, and NVIDIA (NVDA).
Dividend credentials
Uncoincidentally, DLN does not offer much exposure to high-yield plays, as it is not supposed to. There is a sibling name investors who are more into rich yields would be better off owing, the WisdomTree U.S. High Dividend Fund ETF (DHS), which has an LTM DY of 4.47%, on par with the 10-year bond yield ( US10Y ). DLN itself is significantly behind with its 2.5% DY, which is expectable as its portfolio has a modest weighted-average LTM dividend yield of 2.75%, with the forward one being just slightly higher at 2.8%, as per my calculations. Among the main contributors are the consumer staples, real estate, and financial sectors. The three companies with the highest DYs as of November 22 are shown below:
| Symbol |
| Weight |
| Sector |
| DY Fwd |
| Altria (MO) |
| 0.84% |
| Consumer Staples |
| 9.5% |
| Walgreens Boots Alliance (WBA) |
| 0.13% |
| Consumer Staples |
| 9.3% |
| W. P. Carey (WPC) |
| 0.10% |
| Real Estate |
| 7.2% |
While having only modest yield characteristics, the portfolio has something remarkable regarding dividend growth exposure. Below is a comparison of its WA 3-year and 5-year dividend compound annual growth rates to the CAGRs of the recently-reviewed ProShares S&P 500 Dividend Aristocrats ETF (NOBL), a vehicle popular with proponents of DGI strategies.
| Fund |
| Div 3Y CAGR |
| Div 5Y CAGR |
| DLN |
| 9.9% |
| 9.5% |
| NOBL |
| 6.8% |
| 7% |
Calculated using data from Seeking Alpha and the fund
A surprising finding is that although its underlying index's methodology does not incorporate dividend growth criteria, it solidly beats NOBL in that arena.
Nevertheless, I always recommend investors delve deeper while looking for the exact reason why a certain factor is so inflated or so depressed. In the case of the above rates, the major contributor is Cigna (CI), a healthcare firm that changed its dividend policy in 2021, switching from the annual to the quarterly schedule while also massively boosting the DPS. In 2021, as page 83 of the Form 10-K illustrates , its 'common stock dividend paid' rose to $1.34 billion from $15 million a year before. And below are its overinflated CAGRs:
| 3Y CAGR |
| 5Y CAGR |
| 393.58% |
| 160.63% |
So, in the case of the 3-year rate shown above, CI is responsible for more than 1%, which means if its CAGR was zero, the portfolio-wise figure would be only 8.7%.
Performance analysis
Over the July 2006-October 2023 period, through two recessions, DLN delivered a strong annualized total return of 7.87%, outperforming its yield-chasing peer DHS, with a much lower standard deviation and higher risk-adjusted returns (Sharpe, Sortino ratios), and with a max drawdown not that steep (during the 2007-2009 downturn). Interestingly, DON's result was surprisingly stronger, but only by a few bps.
| Portfolio |
| IVV |
| DHS |
| DON |
| DLN |
| Initial Balance |
| $10,000 |
| $10,000 |
| $10,000 |
| $10,000 |
| Final Balance |
| $46,173 |
| $28,109 |
| $37,578 |
| $37,166 |
| CAGR |
| 9.23% |
| 6.14% |
| 7.94% |
| 7.87% |
| Stdev |
| 15.59% |
| 16.54% |
| 18.65% |
| 14.78% |
| Best Year |
| 32.30% |
| 24.48% |
| 33.25% |
| 28.91% |
| Worst Year |
| -37.02% |
| -38.90% |
| -32.27% |
| -35.07% |
| Max. Drawdown |
| -50.78% |
| -63.03% |
| -56.18% |
| -53.40% |
| Sharpe Ratio |
| 0.57 |
| 0.37 |
| 0.44 |
| 0.51 |
| Sortino Ratio |
| 0.83 |
| 0.51 |
| 0.62 |
| 0.73 |
| Market Correlation |
| 1 |
| 0.84 |
| 0.92 |
| 0.95 |
Data from Portfolio Visualizer
However, none of the WisdomTree dividend funds compared above were capable of outperforming the iShares Core S&P 500 ETF (IVV), the bellwethers-focused vehicle, with almost every metric being the strongest, except for the standard deviation (DLN was less volatile over the period), total return in its best year (2013 for both DON and IVV), and a decline in its worst year (2008 for both DON and IVV).
Also, DLN is lagging IVV dismally this year after beating it easily in 2022 (by 14.2%).
Final thoughts
The WisdomTree U.S. LargeCap Dividend Fund ETF offers a mostly unsophisticated take on the U.S. mega/large-cap echelon.
This portfolio delivers only a modest dividend yield, which comes with solid exposure to dividend growth stories, with the nuance that the CAGRs discussed above are meaningfully influenced by just one constituent.
An important consideration is that DLN's equity mix has rock-solid quality, as the unsophisticated yet capable methodology of its underlying index somewhat immunizes it from companies with value-trap symptoms.
I am impressed by DLN's profitability and capital efficiency characteristics, but I would favor a better-valued mix, so a Hold rating is maintained.
For further details see:
DLN: Smart-Beta Dividend Play With Robust Quality