XLU - DNP Vs. UTG: 2 Solid Long-Term Infrastructure Income Plays
2023-06-30 12:38:05 ET
Summary
- DNP Select Income and Reaves Utility Income are both solid long-term choices in the utility/infrastructure closed-end fund space.
- UTG gets the edge over DNP due to its valuation, as the discount/premium can play a significant role in the outcome for investors.
- Buying DNP at a premium of below 10% is generally a good buying opportunity, but even more ideally, it would be at a discount which doesn't come around often.
Written by Nick Ackerman, co-produced by Stanford Chemist. This article was originally published to members of the CEF/ETF Income Laboratory on June 16th, 2023.
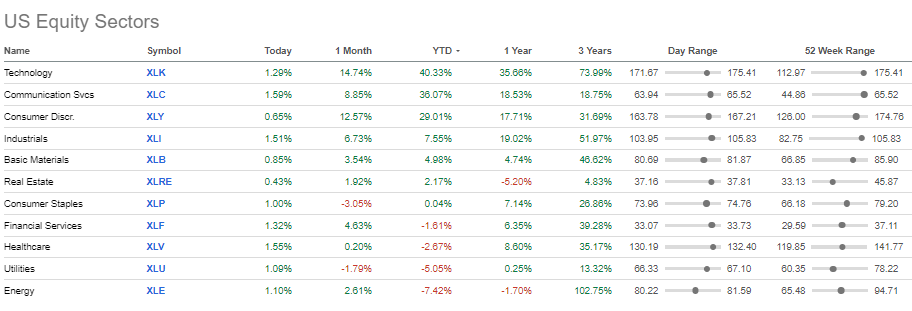
Utilities haven't been having the best 2023; energy has been even worse off. However, being in the down sectors could indicate valuations are coming down and creating longer-term opportunities.
Sector Performance Through June 16th, 2023 (Seeking Alpha)
Both DNP Select Income ( DNP ) and Reaves Utility Income ( UTG ) provide diversified exposure to various infrastructure plays, including utility and energy positions. However, they are quite flexible in terms of what can be considered "infrastructure," as UTG will also incorporate real estate investment exposure or REITs.
Both of these funds have a long history of offering steady distributions to investors. UTG gets to boast about growing its distribution quite regularly, and DNP gets to boast about its long-term steady track record. With both of these distinguishing features of these funds, it only seems fitting that they can be compared to see which may be the most appropriate to put capital to work in today.
UTG Basics
- 1-Year Z-score: 0.09.
- Premium: 0.36%.
- Distribution Yield: 8.22%.
- Expense Ratio: 1.04%.
- Leverage: 20.08%.
- Managed Assets: $2.489 billion.
- Structure: Perpetual.
UTG's strategy is to "invest at least 80% of its total assets in dividend-paying common and preferred stocks and debt instruments of companies within the utility industry." While they leave the door open for greater diversification across asset types, they primarily and consistently focus on equities. This can be positive as equities generally provide greater returns for the risks taken over the longer term.
UTG operates with a fairly mild amount of leverage relative to leveraged closed-end fund peers that generally operate with around a 30% effective leverage ratio. However, any leverage is going to mean added volatility and risks. This has also meant rising borrowing costs as the Fed has been increasing interest rates. That's why we've seen the total expense ratio that includes leverage expenses go from 1.23% to 1.42% as of their last fiscal year-end . Their fiscal year-end is October 31st, 2022, which means that the full impact hasn't been felt yet. At this point, we would anticipate that the total expense ratio would have climbed to over 2%.
DNP Basics
- 1-Year Z-score: 0.05.
- Premium: 21.39%.
- Distribution Yield: 7.59%.
- Expense Ratio: 0.98%.
- Leverage: 25.29%.
- Managed Assets: $4.224 billion.
- Structure: Perpetual.
DNP is identified as "a diversified, closed-end management investment company that first offered its common stock to the public in January 1987. The Fund's primary investment objectives are current income and long-term growth of income. Capital appreciation is a secondary objective."
They attempt to achieve this "by investing primarily in a diversified portfolio of equity and fixed income securities of companies in the public utilities industry. The Fund's investment strategies have been developed to take advantage of the income and growth characteristics and historical performances of securities of companies in the public utilities industry."
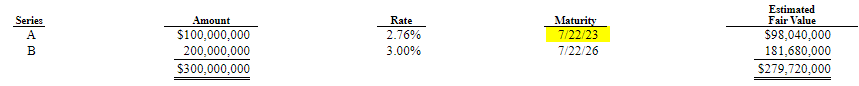
DNP also incorporates leverage into its strategy to potentially enhance returns. However, where UTG carries its leverage to only a credit facility, DNP utilizes a credit facility, senior notes and mandatorily redeemable preferred shares. This can be helpful when some of this is fixed-rate financing. As of their last fiscal year-end , they had a total of $1.105 billion in leverage, with $432 million or around 40%, being locked in at low fixed rates.
On the fixed-rate notes, the fund is going to see the Series A mature very soon, which could open them up to higher financing costs if replaced at today's rates.
DNP MRPS Leverage (Duff & Phelps)
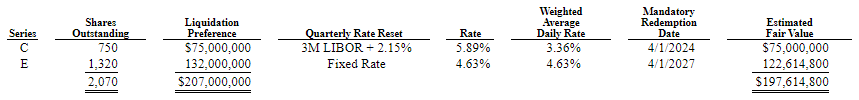
The MRPS has a longer maturity for the larger portion that is fixed, which is a positive.
DNP MRPS Leverage (Duff & Phelps)
Same as UTG, DNP will experience higher interest rate costs, but having some fixed means it's relatively more sheltered. The fund's total expense ratio went from 1.77% to 1.90%. They have the same fiscal year-end of October, so this is helpful when comparing these two directly. However, that means that DNP will also have experienced even higher interest rate costs and, therefore, will see their expense ratio climb.
Performance
When looking at the long-term performance since UTG's inception in 2004, we see an interesting divergence. On a total share price return, UTG has clearly been the best performer, and it isn't really close. On the other hand, we've seen that the total NAV returns for DNP have been the outperformer. On that basis, these funds have held incredibly close and diverged mostly in the last year or so.
YCharts
In looking back at the last three years, we can start to get a better picture of how DNP started to pull away in 2022.
YCharts
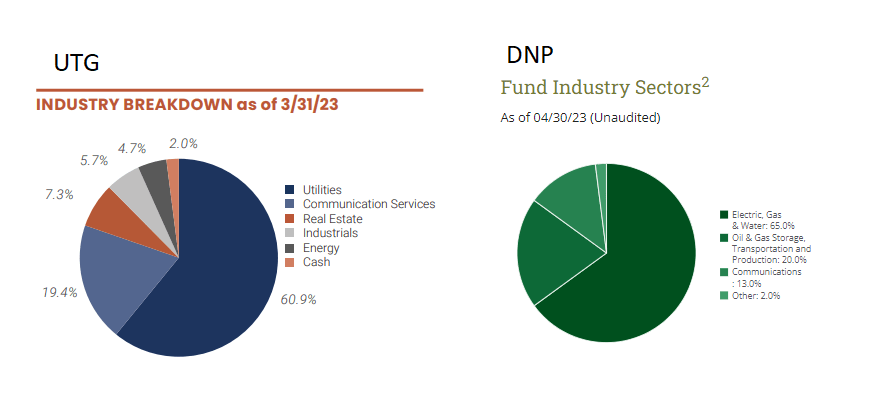
I believe this divergence was the result of DNP sticking heavier to energy plays, while this was when UTG started to dabble into more REIT exposure. They also had a lower exposure and continue to carry a lower exposure to energy/MLPs at around 4.7%. DNP carries around 20% of the oil and gas transportation and production industry. Note that the reporting periods for the pie charts below are two different periods, but it can give us some context regardless and is only a month difference.
UTG Vs. DNP Industry Breakdown (Reaves and Duff & Phelps)
Going forward, these allocations will obviously continue to play a significant role in the outcome of these funds. Both funds carry sizeable allocations to utilities, but it is what is in the rest of their portfolio that is steering the overall ship in relation to these two. If you believe that communication services and real estate - which are going to be somewhat dependent on interest rates - will outperform, then UTG could be the victor going forward. Conversely, if you expect the volatile energy sector to provide better returns going forward, then going with DNP could produce relatively outsized returns.
As we noted above, both the utilities and energy sectors are weak performers this year. However, it would appear that energy being slightly worse off has given a slight edge to UTG on a YTD total NAV return basis. On a total share price basis, UTG has performed even better.
YCharts
When looking at these funds, one might want to compare them to a less complex portfolio of vanilla utility exposure. The Utilities Select Sector SPDR ETF ( XLU ) can give us some color. Once again, the chart goes back to UTG's inception.
YCharts
Discount/Premiums
As we saw above, DNP had been the strongest performer of these two on a total NAV return basis, but it slipped up on a total share price basis. This is because even though DNP commands a high premium now, when UTG was incepted it was at an even higher premium. UTG's inception was on February 24th, 2004. On that day, DNP closed at around a 34% premium.
Both of these funds have traded at premiums fairly regularly, but it is DNP that has averaged a meaningful premium since the fund's launch.
YCharts
Discounts/premiums in CEFs can have a meaningful impact on performance going forward. Funds that trade at higher premiums can underperform on a share price basis, even while the underlying portfolio (NAV performance) does a better job. That's exactly what happened with these two funds, DNP's portfolio had performed better, but investors didn't feel it as the premium came down.
This occurred on a smaller scale on a YTD basis too, where DNP's premium has declined some. Conversely, UTG went from a slight discount to a slight premium now. Giving it a double punch to outperform on a YTD total share price return basis meaningfully.
We are kind of still at that same point today, too. DNP's premium is still quite high, and getting this fund around parity with its NAV would have resulted in better performance for investors. While the fund actually trading at a discount happens very infrequently, at least waiting for a premium of below 10% has historically proven to be a better entry. That could indicate that, in the case of valuation, UTG would be the choice for now.
Distributions
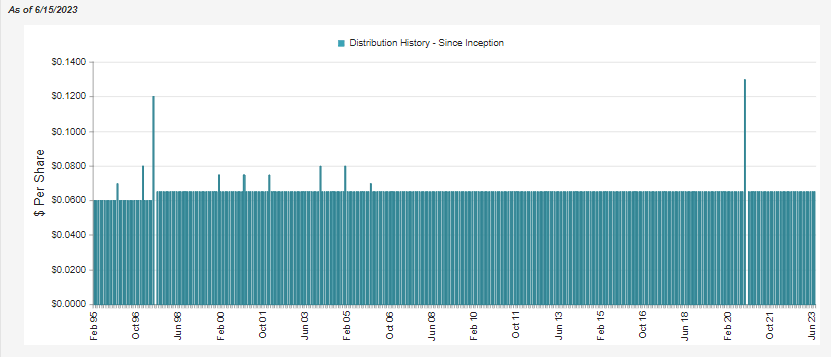
Both these funds have brag-worthy distribution records. First, DNP has the longest unchanged and uncut since inception distribution history of any closed-end fund on record.
DNP Distribution History (CEFConnect)
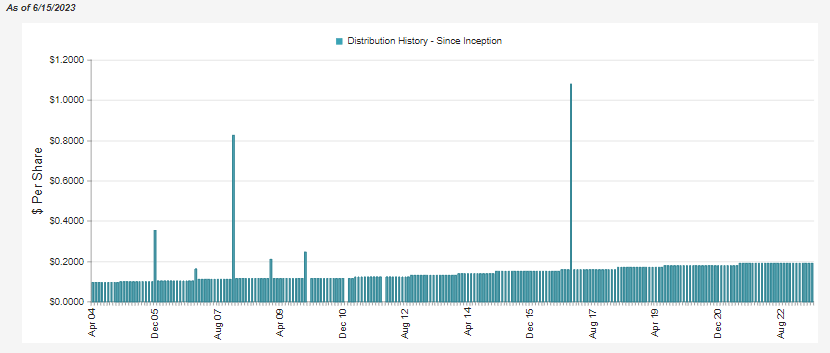
UTG has been successful enough to be able to raise its distribution many times since it launched.
UTG Distribution History (CEFConnect)
Now, that might not seem overly impressive compared to a regular C-Corp business, but as regulated investment companies, they have to pay out almost all of their capital gains and income that the underlying portfolios generate. Therefore, that leaves little wiggle room for them to be able to take a rough year or two and continue to pay out sustainable distributions. That's why these two are one of only a handful of CEFs with unchanged distribution history since before the Global Financial Crisis in 2008/09.
However, it should be noted that both of these funds will require capital gains to afford most of the distributions that they are paying out. Therefore, while we are in a slump in 2023, this would be something to consider.
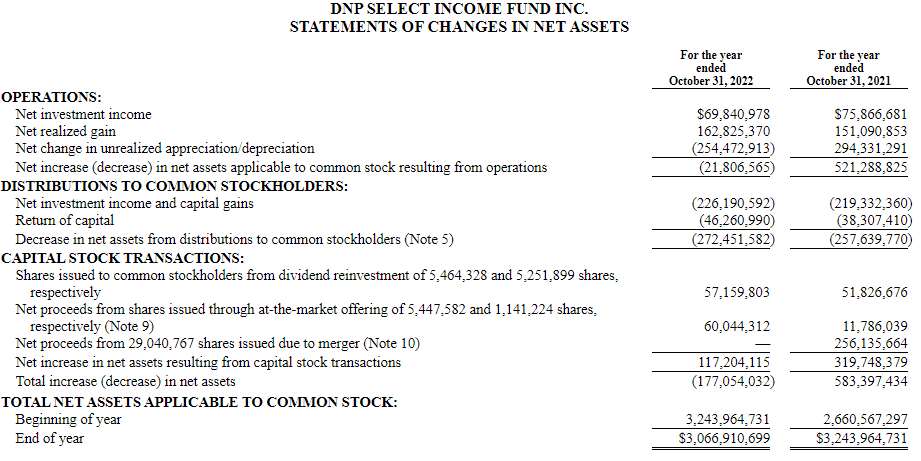
DNP, in the last year, saw its net investment income decline as higher interest rates cut into their borrowing costs. NII coverage for this fund came in at 25.6%.
DNP Annual Report (Duff & Phelps)
Since the fund issues shares through an at-the-market offering and DRIP, a look at the per-share NII can be important too. For DNP, NII per share went from $0.23 to $0.20. In this case, that gives us the same coverage of 25.6%.
For UTG, while they had higher borrowing costs due to leverage as well, NII increased year-over-year. Similar to DNP, NII coverage here stood at 22.47%, despite the increase from last year, which was less than last year when we saw coverage at 25.8%.
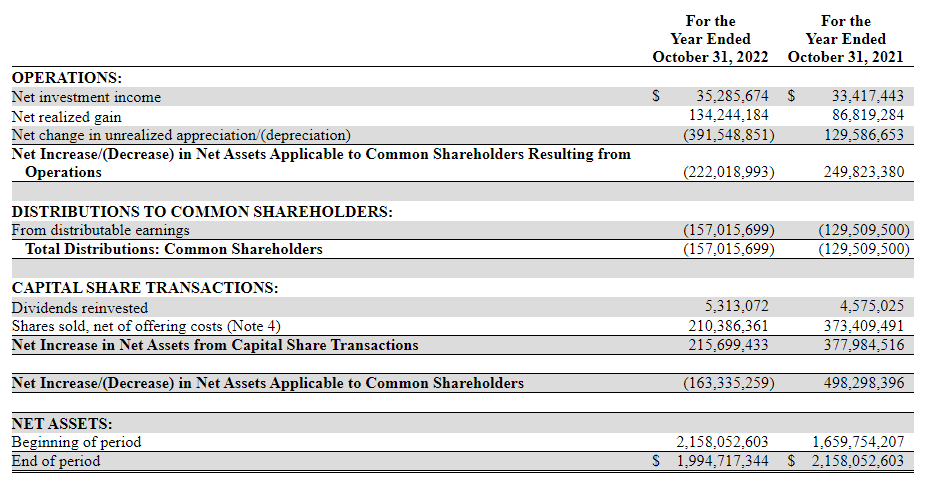
What we are seeing here is that UTG also has the benefit of issuing new shares due to trading at a premium. However, when we look at the per-share figure, NII actually declined from $0.57 to $0.51. That reflects the fund creating more shares than it could generate in additional NII on the fund. It's important to note, though, that any shares issued at a premium are accretive to NAV.
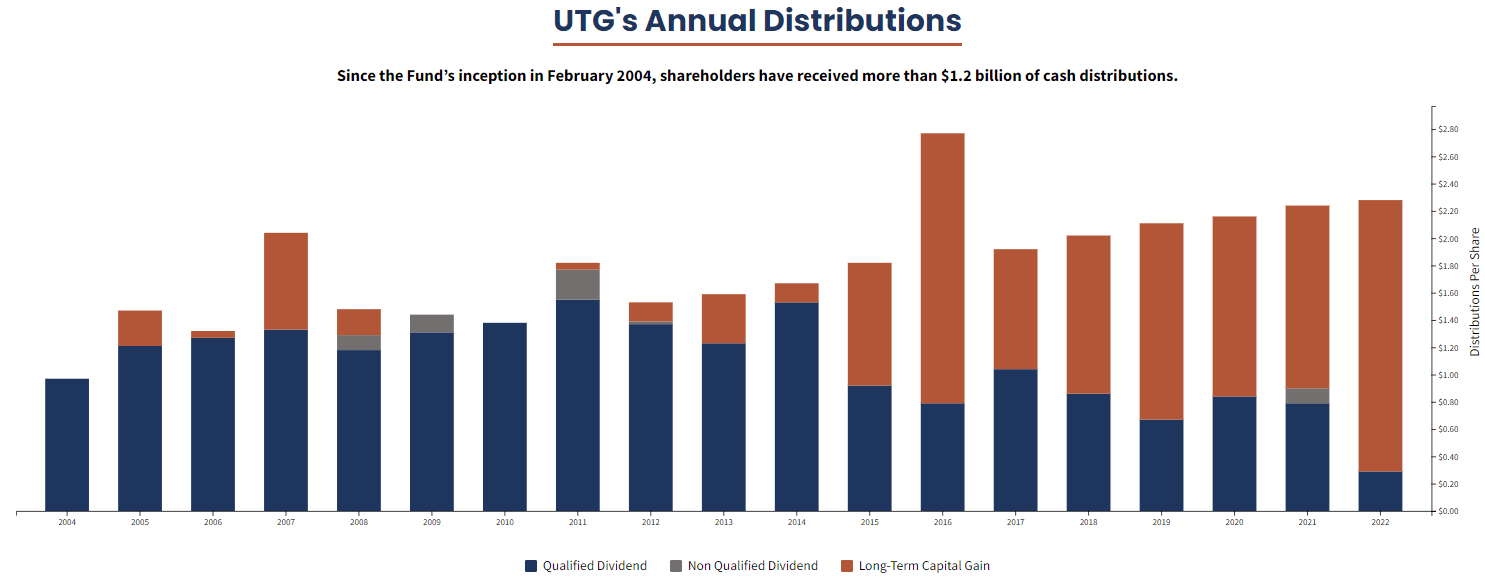
This isn't a new trend, and they break down the tax status of the distributions in a handy chart over the years - the tax classification isn't always exact to the coverage but provides a fairly good guide over time.
UTG Distribution Tax Classifications (Reaves)
UTG's NAV distribution rate is currently 8.25%, and DNP's is slightly higher at 9.26%. Since DNP is trading at a higher premium, the fund's distribution rate on shares comes to 7.59% compared to 8.22% for UTG.
So investors can get a higher distribution rate while the underlying portfolio has to earn even less to sustain it for UTG, that's another win for UTG. Although I suspect neither is close to having to cut their distributions or would be willing to. I believe it would take multiple years of losses before they'd be willing to give up their respective claims to fame.
Conclusion
DNP and UTG are both solid long-term choices in the utility/infrastructure closed-end fund space. However, UTG continues to get the edge over DNP due to its valuation. That's even despite DNP having some of the benefits of having it leveraged at fixed rates; I believe that the valuation difference here compensates for that risk.
The discount/premium has shown us that it can play a significant role in the outcome for investors. Therefore, buying DNP at a premium of below 10% is generally a good buying opportunity. Ideally, it would be at a discount, but that target doesn't get hit often.
For further details see:
DNP Vs. UTG: 2 Solid Long-Term Infrastructure Income Plays