VTRS - DON: Multi-Factor Mid-Cap ETFs Look Better
2024-01-03 07:00:00 ET
Summary
- WisdomTree U.S. MidCap Dividend Fund ETF holds over 300 stocks weighted based on paid dividends, which favors larger companies among mid-caps.
- It is well-diversified across holdings but quite heavy in financials.
- The DON ETF is cheaper than the S&P 400 mid-cap index regarding valuation, and close to it in quality and performance since inception.
- DON doesn’t look really attractive relative to peers: It has lagged multi-factors ETFs since 2015.
This article series aims at evaluating ETFs (exchange-traded funds) regarding past performance and portfolio metrics. Reviews with updated data are posted when necessary.
DON strategy and portfolio
WisdomTree U.S. MidCap Dividend Fund ETF (DON) started investing operations on 06/16/2006 and tracks the WisdomTree U.S. MidCap Dividend Index. It has a portfolio of 336 holdings, a dividend yield of 2.78% and an expense ratio of 0.38%. Distributions are paid monthly.
As described in the prospectus by WisdomTree , the underlying index selects companies in the top 75% of the market capitalization of the WisdomTree U.S. Dividend Index after the 300 largest companies have been removed. They are rebalanced annually based on total dividends paid (not yields, which means the index is tilted to larger companies).
The fund invests exclusively in U.S. companies, about 52% mid-caps and 48% small-caps (according to Fidelity classification). The heaviest sectors are financials (24.8% of asset value), industrials (16.5%) and consumer discretionary (11.3%). Other sectors are below 10%. Compared to the SPDR S&P MidCap 400 ETF ( MDY ), DON overweights mostly financials and utilities. It underweights massively technology and healthcare, and to a lesser extent industrials and consumer discretionary.
Sector breakdown (chart: author, data: WisdomTree, SSGA)
The portfolio is well-diversified. The top 10 holdings represent only 9% of assets and the largest position weighs 1%, so risks related to individual companies is very low.
| Ticker |
| Name |
| Weight% |
| EPS growth %ttm |
| P/E ttm |
| P/E fwd |
| Yield % |
| Franklin Resources, Inc. |
| 1.00% |
| -31.90 |
| 17.30 |
| 12.63 |
| 4.16 |
| W.P. Carey, Inc. |
| 0.94% |
| 44.69 |
| 17.82 |
| 20.61 |
| 5.31 |
| Conagra Brands, Inc. |
| 0.94% |
| 88.78 |
| 12.73 |
| 10.71 |
| 4.88 |
| Viatris, Inc. |
| 0.92% |
| 128.60 |
| 7.18 |
| 3.66 |
| 4.43 |
| Packaging Corporation of America |
| 0.91% |
| -20.84 |
| 18.74 |
| 19.43 |
| 3.07 |
| Corebridge Financial, Inc. |
| 0.88% |
| -84.29 |
| 7.52 |
| 5.26 |
| 4.25 |
| International Paper Co. |
| 0.88% |
| -58.91 |
| 16.72 |
| 17.20 |
| 5.12 |
| Snap-on, Inc. |
| 0.86% |
| 11.53 |
| 15.69 |
| 15.52 |
| 2.58 |
| Evergy, Inc. |
| 0.85% |
| -14.69 |
| 17.65 |
| 14.50 |
| 4.92 |
| The Carlyle Group, Inc. |
| 0.84% |
| -88.01 |
| 70.91 |
| 12.84 |
| 3.44 |
Ratios from Portfolio123.
Performance
Since 7/1/2006, DON has underperformed the benchmark S&P MidCap 400 by 14% (see next table). The difference in annualized return is not really significant: only 20 bps. The risk measured in drawdown is slightly higher.
| since 7/1/2006 |
| Total Return |
| Annual Return |
| Drawdown |
| Sharpe ratio |
| Volatility |
| DON |
| 336.20% |
| 8.78% |
| -61.94% |
| 0.48 |
| 18.83% |
| MDY |
| 350.17% |
| 8.98% |
| -55.33% |
| 0.5 |
| 18.69% |
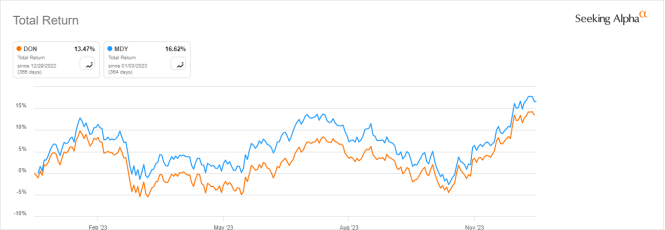
In 2023, DON has underperformed the benchmark by about 3%.
DON vs. MDY, last 12 months (Seeking Alpha)
Dividends have been quarterly until 2012, then monthly. In 10 years, the annual sum of distributions has increased by 93% from $0.57 to $1.10 per share. The 10-year dividend growth rate beats by a wide margin the cumulative inflation, which has been about 32% in the same time (based on the Consumer Price Index).
DON distribution history (Seeking Alpha)
In previous articles, I have shown how three factors may help cut the risk in a dividend portfolio: Return on Assets , Piotroski F-score , and Altman Z-score .
The next table compares DON since 7/1/2006 with a subset of the S&P 500: stocks with an above-average dividend yield, an above-average ROA, a good Altman Z-score, a good Piotroski F-score and a sustainable payout ratio. The subset is rebalanced annually to make it comparable to a passive index.
| Total Return |
| Annual Return |
| Drawdown |
| Sharpe ratio |
| Volatility |
| DON |
| 336.20% |
| 8.78% |
| -61.94% |
| 0.48 |
| 18.83% |
| Reference subset |
| 536.32% |
| 11.15% |
| -43.59% |
| 0.69 |
| 15.56% |
P ast performance is not a guarantee of future returns. Data Source: Portfolio123.
The dividend quality subset outperforms DON by 2.4% in annualized return and shows a lower risk measured in drawdown and volatility. However, the fund's performance is real and this subset is simulated. My core portfolio holds 14 stocks selected in this subset (more info at the end of this post).
Fundamentals
DON is slightly cheaper than MDY regarding valuation ratios, as reported in the next table.
| DON |
| MDY |
| Price/Earnings TTM |
| 12.14 |
| 14.63 |
| Price/Book |
| 1.85 |
| 2.15 |
| Price/Sales |
| 1.18 |
| 1.21 |
| Price/Cash Flow |
| 7.86 |
| 9.8 |
I have scanned holdings with the quality metrics described in the previous paragraph. I consider that risky stocks are companies with at least 2 red flags among: bad Piotroski score, negative ROA, unsustainable payout ratio, bad or dubious Altman Z-score, excluding financials and real estate where these metrics are less relevant. With these assumptions, 36 stocks out of 336 are risky and they weigh about 12.4% of asset value. This is acceptable, but not very good (especially with the heaviest sector, financials, excluded of this count).
Based on my calculation, DON is a bit superior to the mid-cap benchmark regarding the aggregate return on assets, as reported in the next table. The Piotroski F-score and Altman Z-score are not significantly different. Based on these metrics, the portfolio is close to the mid-cap benchmark regarding quality.
| DON |
| MDY |
| Altman Z-score |
| 2.91 |
| 3.09 |
| Piotroski F-score |
| 5.55 |
| 5.63 |
| ROA % TTM |
| 6.33 |
| 5.07 |
Competitors
The next table compares characteristics of DON and four mid-cap ETFs with a tilt to value or dividends.
- Vanguard Mid-Cap Value ETF ( VOE )
- John Hancock Multifactor Mid Cap ETF ( JHMM )
- First Trust Mid Cap Core AlphaDEX Fund ( FNX )
- ProShares S&P MidCap 400 Div Aristocrats ETF ( REGL ).
| DON |
| VOE |
| JHMM |
| FNX |
| REGL |
| Inception |
| 6/16/2006 |
| 8/17/2006 |
| 9/28/2015 |
| 5/8/2007 |
| 2/3/2015 |
| Expense Ratio |
| 0.38% |
| 0.07% |
| 0.42% |
| 0.60% |
| 0.40% |
| AUM |
| $3.47B |
| $26.95B |
| $3.59B |
| $1.12B |
| $1.56B |
| Avg Daily Volume |
| $8.06M |
| $59.65M |
| $14.56M |
| $3.34M |
| $6.05M |
| 4-Year Avg Yield |
| 2.65% |
| 2.24% |
| 1.02% |
| 1.16% |
| 2.43% |
| 5-Y Dividend Growth (annualized) |
| 6.42% |
| 4.71% |
| 8.34% |
| 14.70% |
| 10.31% |
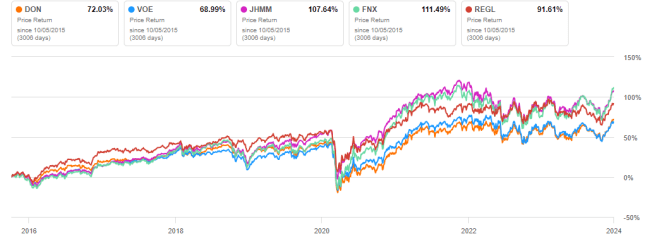
The next chart compares total returns starting on 10/5/2016 to match all inception dates. DON is second to last. The multi-factor funds JHMM and FNX are leading.
DON vs competitors since 10/5/2015 (Seeking Alpha)
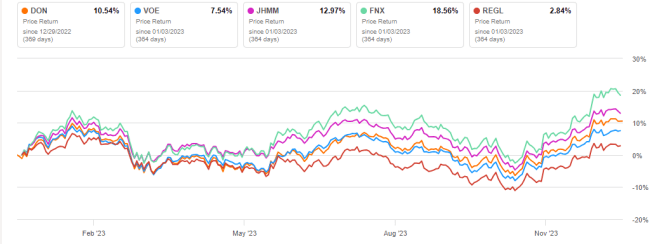
DON was in the middle of the pack in 2023, still behind the multi-factor funds:
DON vs competitors, trailing 12 months (Seeking Alpha)
Takeaway
WisdomTree U.S. MidCap Dividend Fund ETF holds over 300 stocks weighted based on paid dividends, which favors larger companies in the mid-cap universe. It is well-diversified across holdings, but quite heavy in financials (almost 25% of assets). DON is cheaper than the benchmark S&P 400 mid-cap index regarding valuation, and close to it in quality and performance since inception. Compared to other rules-based mid-cap funds, DON doesn't look really attractive: it has lagged multi-factors ETFs JHMM and FNX by a significant margin.
For further details see:
DON: Multi-Factor Mid-Cap ETFs Look Better