TSLA - Donville Kent Asset Management October 2023 Insights
2023-11-15 05:30:00 ET
Summary
- Donville Kent Asset Management Inc. is a highly specialized asset management firm that manages investments on behalf of individual investors as well as select institutions.
- DKAM discusses market cycles and the impact of human emotions on stock prices.
- We highlight the current cycle, with small caps being at historically cheap valuations compared to large caps.
- We also discuss potential outperformance of small caps in recessions and provides an example of an undervalued stock, Reitmans.
Cycles on Cycles
A year ago, we wrote When History Rhymes 1 , where we focused on the “What” for the stock market. It has been one of our most popular newsletters because the small cap opportunity, the “What”, was made clear and shown with useful examples. The concept that history doesn’t repeat itself but it rhymes is rooted in the notion that basic human nature doesn’t change. Time and circumstances change but the causes and responses are all bound by human emotion. With this in mind, this letter will add to the previous conversations and try to tackle the questions of “Why” and “When”.
In this newsletter, we will go over the phenomenon of market cycles, the current cycle, the impact on stock valuations, and inflation implications. The table of current PE multiples for small caps should be of particular interest, especially when combined with the data on how small caps perform in recessions. We’ll make a few stock-specific comments, most notably with an interesting development in the Reitmans’ investment scenario.
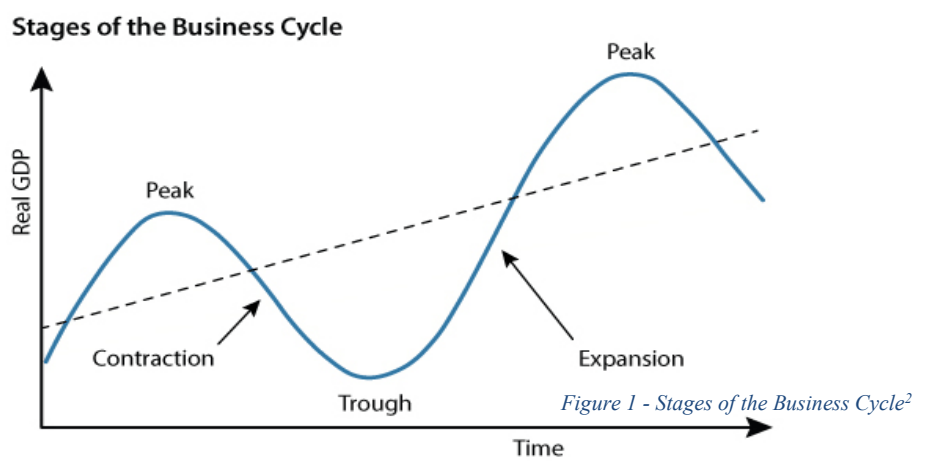
Cycles
For the economy as a whole, there is a long-term natural growth rate as the population expands and productivity improves. There are however fluctuations around this long-term trend. There are expansions and contractions (also known as recessions). Cycles are not as obvious as the generic chart below but the idea of a continuous cycle of rise, peak, dip, trough has been a recurring pattern since we’ve been able to track human output.
Figure 1 - Stages of the Business Cycle 2
The natural question is why do markets have these fluctuations? A textbook will include answers like changes in demand, supply, debt, etc. These answers are true, but they are also the accumulation of the daily choices made by humans. Human emotions are volatile. The long-term trend of a company’s revenue and earnings could be consistently growing but the stock price will most likely fluctuate much more than the fundamentals, because the price is a function of human emotion.
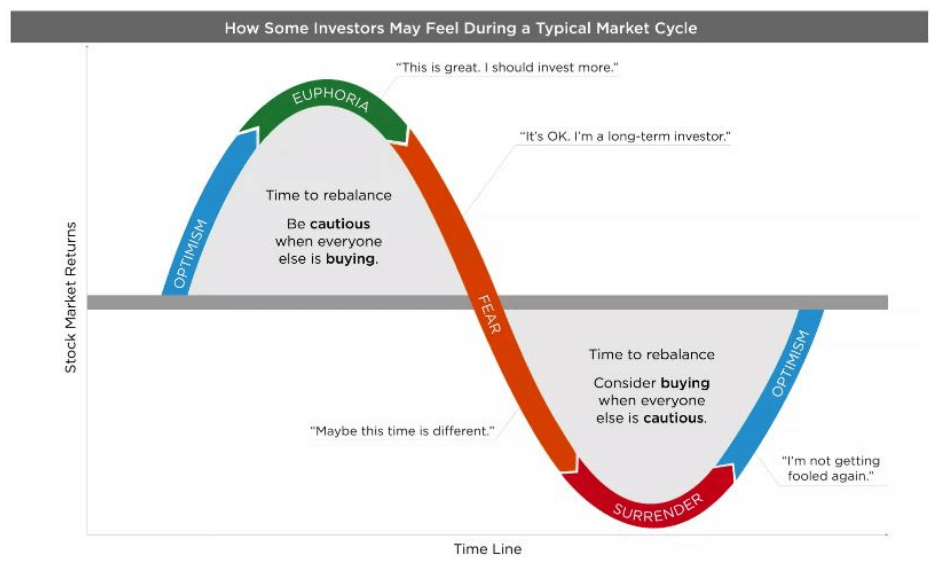
A cycle is in essence a study of emotions. As you can see from the chart below, the peak, contraction, trough, and expansion are replaced with the emotions that dominate the stock market.
Figure 2 - Business Cycle Emotions
Emotions get tied to stock prices and will usually have a snowball effect. Selling begets selling, and anxiety turns into fear, which turns into panic. The opposite is also true when buying begets buying, and hope turns into optimism, which turns into euphoria. This rollercoaster of emotions impacts stock prices on a day-to-day basis but has little impact on the daily operations of those businesses. Remember, a stock is a piece of ownership in a business. Day-to- day operations of a business do not fluctuate like emotions do. A good CEO isn’t making operational decisions based on his stock price, and employees aren’t producing less or more based on the stock price.
Over the course of years, a good business grows revenues, increases profits, and becomes a more valuable asset. The stock price on the other hand will usually fluctuate considerably around the long-term trend in asset value .
Investors fail to see the underlying trend in fundamentals and focus on the short-term price action. Humans decide on when to buy and sell, so human emotion plays a role in overall stock prices, in the short-term.
When you’re inside of this, it will feel random and chaotic. At the bottom you become emotionally fatigued. Many investors sell everything that’s not working and go to safe assets. In this sense, you’re losing twice. You’ve rode the wave down and now have given up on the rebound. Humans are behaviourally programed to buy high and sell low. To chase returns. To get caught up in the excitement but also become overly depressed and pessimistic. Let’s stay analytical and hopefully we can alleviate some of this stress.
Current Cycle
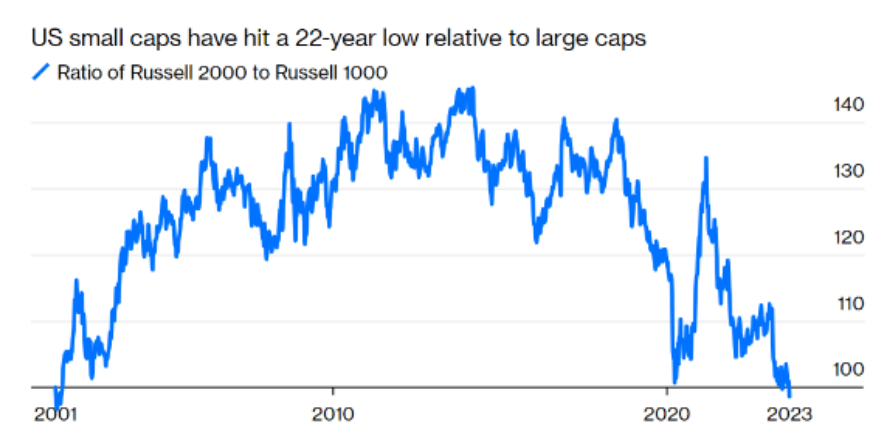
Where are we in the extent of this cycle, or in other words, what is the dominating emotion? For small caps, we are at the cheapest level we could find in recent history, meaning investors have sold small caps down to the cheapest valuations we have seen. Blackrock is the largest money management firm in the world, with over $10 Trillion in assets under management. Yes
Trillion. Blackrock’s CEO, Larry Fink, began his professional career in the early 70’s and at the end of September he just said, “I see more fear than any time in my business career.” We are not trying to scare anyone here. The point is actually quite the opposite. The damage has been done. We’re in a trough and the opportunity is in front of us.
Anyone who points to the “stock market” being near highs, is missing the point of what the “stock market” really is and what the true investor is feeling. The graph below shows a historic concentration in the largest stocks. The “Magnificent Seven” stocks have accounted for essentially all the market gains so far this year. It appears like all the capital has left the small-medium stocks and is historically concentrated in just the largest companies.
Figure 3 - Concentration Risk
Source: Bloomberg, FactSet, BofA US Equity & Quant Strategy
Figure 4 - Small to Large Cap Ratios
The narrative at the moment is that these large businesses are safe havens and can’t lose propositions. We agree that these are great businesses. They didn’t get to their scale and notoriety without doing a lot of things right. The issue from an investment perspective is that future investment returns are a function of fundamental growth and multiple expansion/contraction. Meaning buying something cheap and quickly growing will outperform something in the long- term that is expensive and growing more slowly.
This is the particularly interesting point where we compare large cap growth and valuations against our list of preferred small caps.
Figure 5 - Large Cap Fundamentals and Valuations 3
Current Large Cap Fundamentals & Valuations
| Company |
| 2024E Revenue Growth |
| 2024E Earnings Growth 2024E PE |
| EPS Growth/PE |
| Microsoft ( MSFT ) |
| 12% |
| 12% |
| 30.1 |
| 0.40 |
| Apple ( AAPL ) |
| -3% |
| -1% |
| 26.6 |
| -0.04 |
| 12% |
| 16% |
| 19.7 |
| 0.81 |
| Nvidia ( NVDA ) |
| 49% |
| 58% |
| 24.6 |
| 2.36 |
| Amazon ((amzn) |
| 12% |
| 28% |
| 30.9 |
| 0.91 |
| META (Facebook) |
| 13% |
| 24% |
| 18.0 |
| 1.33 |
| Tesla ( TSLA ) |
| 24% |
| 32% |
| 52.0 |
| 0.62 |
| 5% |
| 5% |
| 24.6 |
| 0.20 |
| Costco ( COST ) |
| 5% |
| 5% |
| 36.2 |
| 0.14 |
| Walmart ( WMT ) |
| 4% |
| 10% |
| 22.5 |
| 0.44 |
| Pepsi ( PEP ) |
| 5% |
| 7% |
| 19.7 |
| 0.36 |
| UnitedHealth ( UNH ) |
| 7% |
| 12% |
| 19.1 |
| 0.63 |
| Eli Lilly ( LLY ) |
| 17% |
| 30% |
| 46.8 |
| 0.64 |
| Exxon ( XOM ) |
| -4% |
| -2% |
| 12.0 |
| -0.17 |
| J&J ( JNJ ) |
| 4% |
| 7% |
| 14.1 |
| 0.50 |
| Average |
| 11% |
| 16% |
| 26.5 |
| 0.61 |
Figure 6 - Small Cap Fundamentals and Valuations 3
Current Small Cap Fundamentals & Valuations
Company |
| 2024E Revenue Growth |
| 2024E Earnings Growth 2024E PE |
| EPS Growth/PE |
| Reitmans ( RTMAF ) |
| 6% |
| 5% |
| 2.3 |
| 2.17 |
| Sangoma ( SANG ) |
| 7% |
| 12% |
| 3.3 |
| 3.64 |
| RediShred ( RDCPF ) |
| 16% |
| 18% |
| 3.6 |
| 5.00 |
| Propel ( PRL:CA ) |
| 34% |
| 77% |
| 4.1 |
| 18.78 |
| Converge Technology ( CTSDF ) |
| 8% |
| 14% |
| 4.1 |
| 3.41 |
| GoEasy ( EHMEF ) |
| 21% |
| 22% |
| 6.8 |
| 3.24 |
| Zedcor ( CRFQF ) |
| 36% |
| 46% |
| 7.2 |
| 6.39 |
| Nuvei ( NVEI ) |
| 17% |
| 26% |
| 7.5 |
| 3.47 |
| VitalHub ( VHIBF ) |
| 20% |
| 21% |
| 8.7 |
| 2.41 |
| SSC Security ( SECUF ) |
| 12% |
| 38% |
| 9.7 |
| 3.92 |
| Hammond Power ( HMDPF ) |
| 10% |
| 11% |
| 9.8 |
| 1.12 |
| Decisive Dividend ( DEDVF ) |
| 21% |
| 37% |
| 11.1 |
| 3.33 |
| Average |
| 17% |
| 27% |
| 6.5 |
| 4.74 |
We think this is the best way to illustrate the current state of the market. The large cap stocks have lower growth rates both for revenue and earnings but trade at 26.5x earnings 3 . The small caps listed grow the top and bottom line faster and only trade on 6.5x earnings 3 . The furthest column on the right takes earnings growth and divides by the earnings multiple. This equates to how much earnings you’re getting per unit of valuation. For large caps you’re getting 0.61 and for small caps you’re getting 4.74x 3 ! That is almost an 8x difference and the largest spread we have been able to find in the investments we have tracked.
The second massive disconnect, after the valuation gap, is that these small cap companies are reporting record revenue and record earnings. The long-term trend is positive. Their stock prices have not been indicative of the actual underlying performance of the business. All of these small cap companies listed (besides Reitmans – read more below) are on track for record 2023 and projected record 2024 results 1 . Fear has led to the current trough, but these companies continue to perform.
Small Cap and Recessionary Cycles
“Investors may ask themselves if now is the time to skew equity allocations to more liquid large caps. From an emotional perspective this feels like a logical investment strategy. The data on investment returns, however, suggests quite the opposite.” 4.
An article published by Shroders 4 , used historical data and examples to explain why small caps actually outperform in recessions. It makes sense at the moment because there is such a large valuation difference between small and large. Small caps have been hit extremely hard in anticipation of a recession. Now that the damage is done, it makes sense that they could greatly outperform from here.
“… the market tends to sell small companies heading into a recession in favour of more liquid large cap stocks. The selling, however, gets overdone. We’ve all seen footage of a herd of animals turning on a dime to avoid danger, and it’s a similar picture with the rush of capital away from small caps heading into recession.” 4.
“Once we’re in recession, however, and as the market begins to discount recovery, there is an equally forceful rush of capital back into small caps. Investors are now anticipating benefiting from the sensitivity of small cap earnings to the recovery.” 4.
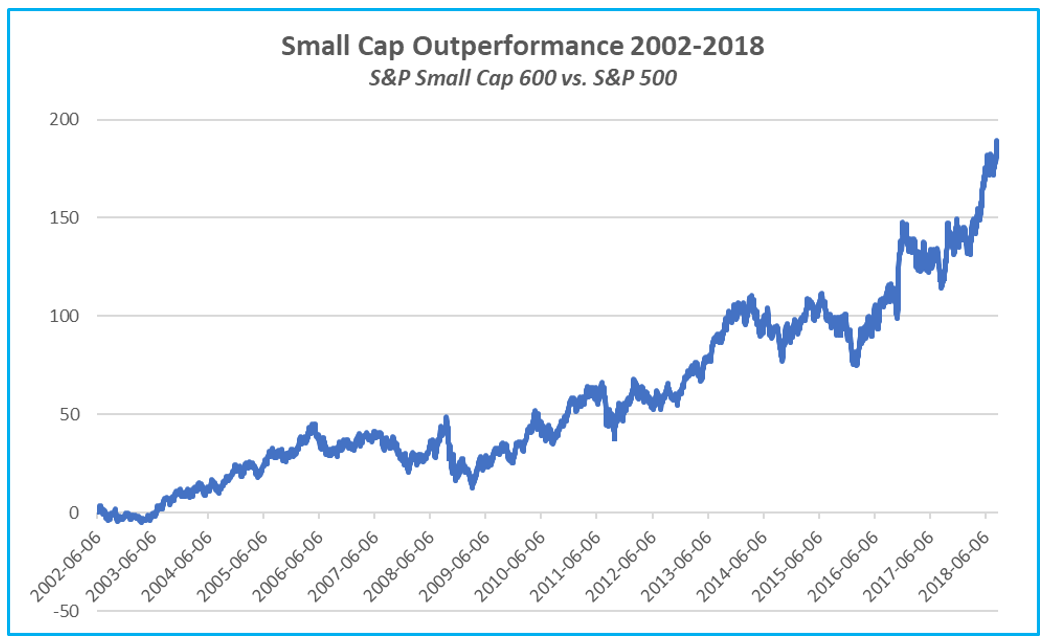
With the spread between large cap and small cap valuations being so vast, we would expect the future outperformance to be on a similar scale. The chart below depicts the small cap outperformance coming out of 2000-2002, the last time there was heightened concentration in the largest cap stocks.
Figure 7 - S&P Small Cap 600 vs S&P 500 5
These cycles have and will continue to persist. The strategy of buying the cheap and discarded stocks may be hard emotionally, but has shown to be the successful strategy over time.
Inflation Cycle
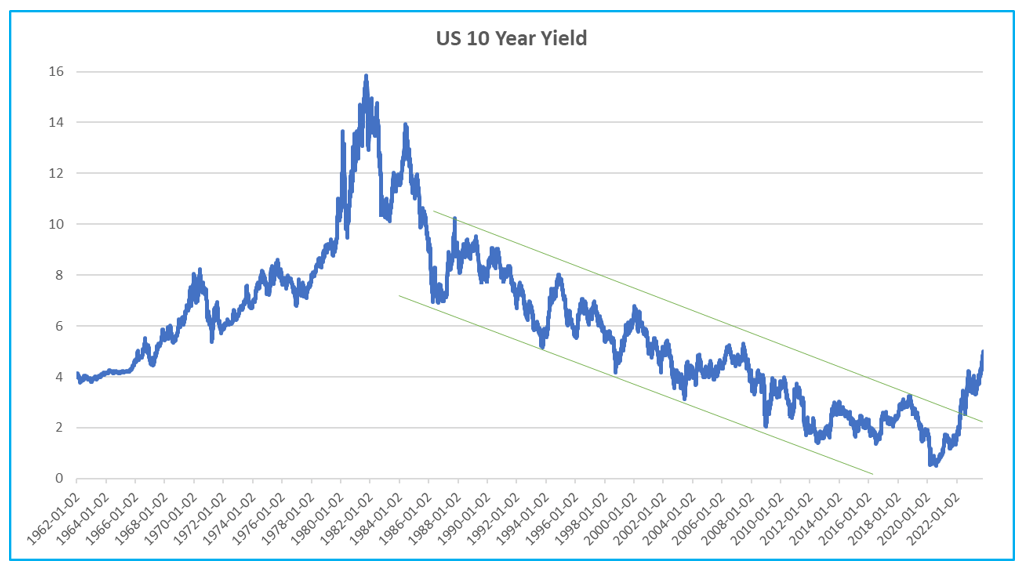
Inflation and therefore interest rates, the tool used to fight inflation, have been more entrenched than we expected. This has negatively impacted the multiples on stocks, most notably on small cap stocks. As inflation has lasted longer than expected, the impact has been an elongated trough in this small cap cycle.
The full impact from rising rates hasn’t been felt through the economy and is probably taking longer than usual because of the high fiscal support, but we would argue it has been more than factored into the prices of stocks.
For those that think rates will stay higher for longer, we would push back with the reasons why rates consistently declined for 40 years before Covid hit – population & technology.
Figure 8 - US 10-Year Yields 5
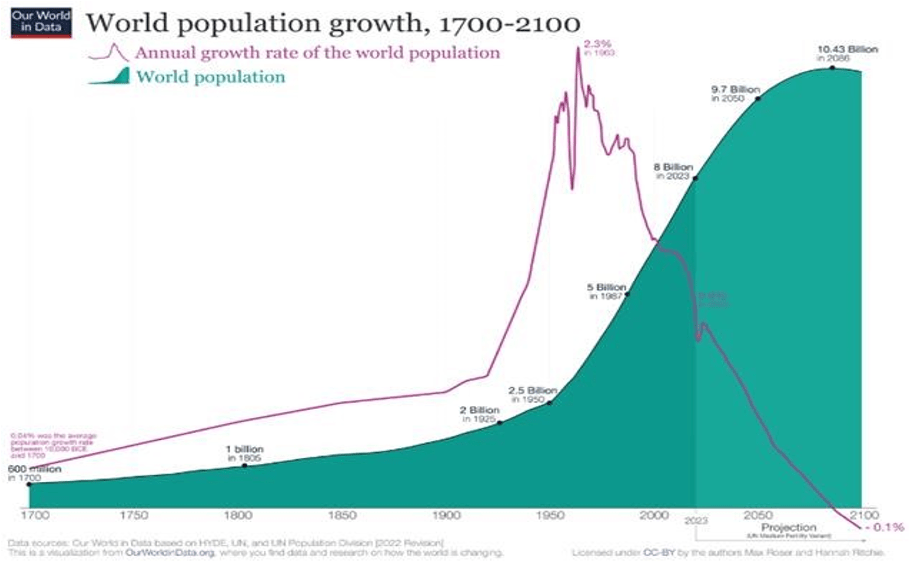
The working age population growth from 2008-2019 was less than 1/3 rd the growth experienced in the 70-90’s. Take a look at the graph below of the world working population growth and compare it to the interest rate graph above. The working age population (15-64), which is the population that spends, that builds, that invests, exploded after WWII. However, based on current birth rates, the growth rate continues to plumet and is expected to go negative.
Figure 9 - World Population Growth
Technology is the second of the two major deflationary forces. We’ve included 4 examples below of massively declining cost curves, but this is the technological phenomenon being felt across the world.
Figure 10 - Lithium Pricing
Figure 11 - Solar Panel Pricing
Figure 12 - Genome Sequencing Pricing
Figure 13 - Computer Memory Pricing
For inflation to be more entrenched than expected, there would have to be a factor of inflation that keeps it high that wasn’t in place for the last 40 years. The undersupply of real estate in Canada definitely doesn’t help, plus geopolitical tensions and impact on energy prices are also inflationary. These are factors to watch, but secular decline in population growth plus continued deflation from technology will be hard forces to fight against.
Reitmans ( RTMAF , RET.A:CA, RET:CA )
We originally wrote about and included our analysis on Reitmans in our January 2023 newsletter 6 . Recently the stock sold off after their reported quarter because of difficult year-over-year comparisons. This is a flawed way of approaching the results. The quarter was actually in line with our model and expectations. The main point to take notice of is that there were $20m of compensation costs expensed in 2023 that was based on performance in 2022.
By simply comparing year-over-year results, you’re not comparing apples to apples. We would suggest following the cash. Operating cashflow in the quarter was $37m and total cash increased $27m. The market cap is only $127m with $100m of cash on the balance sheet.
Considering the recessionary storm clouds, another assumption is that a clothing retailer is a risky investment. Reitmans is a value brand, and they have had resilient revenue because of the value they offer. In 2008-2009, during the worst recession in recent history, sales remained consistent, and profits were stable. If you were to apply how much they made per store in the 2009 recession to their store count now, the stock is trading on 3x earnings. Now they are even more streamlined, have a high percentage on online sales, and a rock-solid balance sheet.
We have updated our valuation tables and added the recent Chico’s women’s clothing takeout by Sycamore Partners that was announced in September. Private equity firm Sycamore Partners is paying $938m, which equates to 11x PE multiple. Reitmans has higher gross profit, operating margins, net margins, plus a better balance sheet.
Figure 14 - Retailer Multiples 3
Figure 15 - Reitmans Valuation 3
Reitmans Valuation Potential
| Valuation Method |
| 2023 PE Multiple Value per Share |
| Average competitor multiple |
| 13.5x $13.84 |
| Closest Canadian Competitor |
| 15.7x $16.09 |
| Chico's takeout multiple |
| 11.1x $11.38 |
| Average Reitmans multiple 2002-2013 |
| 15.0x $15.38 |
| Average |
| $14.17 |
From current prices 7 , this suggests +500% upside and doesn’t take into account the large cash hoard, the completely owned office building and distribution center. The delta between where the stock trades and its intrinsic value is so large that it begs the question if something else is holding it back? To that end, we have sent a letter to the board because we believe the business is being run well operationally (day-to-day) but not at the board level (this letter can be found as an appendix to this newsletter).
Their approach to the capital markets and treatment of minority shareholders is poor and outdated. We believe by consolidating into a single class share structure, thus eliminating the no coattail clause issue, plus uplisting to the TSX and becoming more shareholder friendly will undoubtably help close the gap.
We continue to buy both classes of shares. 8
Reitmans is one of the most straight forward examples of the value that is available in this environment. We expect to be active in many more scenarios like this where companies should be taking advantage of the environment we are in and maybe need a little push to do so.
If you are a Reitmans investor, please feel free to reach out. We would be interested to hear points of disagreement or potential other strategies to unlock value.
Converge Technology ( CTS:CA , CTSDF )
On October 19 th Converge released preliminary Q3 results which surprised to the upside. They lead with the title “Q3-2023 Performance to be Stronger than Expected”. Gross profit will be up ~22% vs 2022 and EBITDA will be up ~29% vs last year. They also included, “Cash generated from operating activities improved significantly in Q3, resulting in positive free cash flow and a reduction in net debt”. The stock is currently up ~20% 7 since the release and we expect the stock to do even better as the true earning ability of this company shines through.
RediShred ( KUT:CA, RDCPF )
RediShred reported a record quarter at the end of August. They then announced two more acquisitions and guided to completing more before year- end. The stock on the other hand declined quite a bit. The stated financials, with forex and a fluctuating paper price, may hide the true profitability, but the company continues to reinvest at high rates of return. The profitability of shredding trucks is much higher than one might expect. We continue to believe in this management as they execute like they say they are going to.
For both CTS & KUT, we focus on cash earnings versus other metrics like free cashflow or EBITDA etc. We believe both companies are investing in growth CAPEX at high rates of return, which is what you want to see. These are two investments that we expect to jump considerably as the cycle turns.
Conclusion
Going through a trough is hard and it is emotionally draining. One way to approach this opportunity would be to try and put your emotions aside. Change the narrative in your head. Approach it analytically and say to yourself “What stocks are cheap?”, “What stocks are poised for a comeback?”, “When the cycle turns where should I be?”
Human emotion is hard to fight against. We have to fight against the buy high and sell low mentality. We’re conditioned to be pessimistic and optimistic at precisely the wrong times. For example, getting scared out and selling during 2008 and missing the large rebound in 2009. Or the Covid crash in March 2020 and missing the massive rally that ensued in the months thereafter.
The notion of repositioning into small caps now is becoming more and more common in our daily discussions with investors. Small caps outperform in recessions and investors from what we’ve seen are grossly over exposed to the very large caps.
There will be opportunities when this cycle turns. We remain focused on owning companies that are growing revenues, growing profits, have solid balance sheets, and especially now, trade at extremely cheap prices. We will leave you with some context, in that our current top 10 investments are all on pace for record revenue and earnings in 2023.
Please take a listen to our most recent podcast and if you like to set-up a call or meeting, please feel free to reach out.
“Most people get interested when everyone else is. The time to be interested is when no one else is. You can’t buy what is popular and do well.” Warren Buffett
Feel free to reach out with questions or comments,
J.P. Donville & Jesse Gamble
| All estimates, projections, and calculations have been generated by DKAM. This does not constitute advice for personal investments but rather a breakdown of how Donville Kent approaches stock analysis. Footnotes1 Article can be found at https://donvillekent.com/wp-content/uploads/2022/11/DKAM-ROE-Reporter-November- 2022-Final-1.pdf 2 Chart sourced from https:// Human cycles: History as science - Nature 3 Per DKAM internal estimates 4 Shroders article can be found at Do small caps or large caps perform better in recessions? caps-perform-better-in-recessions/ 5 Per Bloomberg 6 January 2023 newsletter can be found at https://donvillekent.com/wp-content/uploads/2023/02/DKAM-ROE- Reporter-January-2023-Final-1.pdf 7 As of October 24 th , 2023 8 As of October 24 th , 2023, DKAM Capital Ideas Fund LP owns 1,314,100 of RET.A shares, and 620,600 RET shares. DISCLAIMERReaders are advised that the material herein should be used solely for informational purposes. Donville Kent Asset Management Inc. ((DKAM)) does not purport to tell or suggest which investment securities members or readers should buy or sell for themselves. Readers should always conduct their own research and due diligence and obtain professional advice before making any investment decision. DKAM will not be liable for any loss or damage caused by a reader's reliance on information obtained in any of our newsletters, presentations, special reports, email correspondence, or on our website. Our readers are solely responsible for their own investment decisions. The information contained herein does not constitute a representation by the publisher or a solicitation for the purchase or sale of securities. Our opinions and analyses are based on sources believed to be reliable and are written in good faith, but no representation or warranty, expressed or implied, is made as to their accuracy or completeness. All information contained in our newsletters, presentations or on our website should be independently verified with the companies mentioned. The editor and publisher are not responsible for errors or omissions. Past performance does not guarantee future results. Unit value and investment returns will fluctuate and there is no assurance that a fund can maintain a specific net asset value. The fund is available to investors eligible to invest under a prospectus exemption, such as accredited investors. Prospective investors should rely solely on the Fund's offering documentation, which outlines the risk factors in making a decision to invest. The S&P/TSX Composite Total Return Index, the S&P 500 Total Return Index, and the Russell 2000 Total Return Index ("the indexes") are similar to the DKAM Capital Ideas Fund LP ("the fund") in that all include publicly traded North American equities of various market capitalizations across several industries, and reflect both movements in the stock prices as well as reinvestment of dividend income. However, there are several differences between the fund and the indexes, as the fund can invest both long and short, can utilize leverage, can take concentrated positions in single equities, and may invest in companies that have smaller market capitalizations than those that are included in the indexes. In addition, the indexes do not include any fees or expenses whereas the fund data presented is net of all fees and expenses. The source of the indexes' data is Bloomberg. DKAM receives no compensation of any kind from any companies that are mentioned in our newsletters or on our website. Any opinions expressed are subject to change without notice. The DKAM Capital Ideas Fund, employees, writers, and other related parties may hold positions in the securities that are discussed in our newsletters, presentations or on our website. |
Appendix
Editor's Note: The summary bullets for this article were chosen by Seeking Alpha editors.
For further details see:
Donville Kent Asset Management October 2023 Insights