EWMC - Early February 2023 Chart Storm (Technical Analysis)
Summary
- Equities made a bottom in October 2022, which has held up so far, and it seems the stock market is at the cusp of a breakout into an uptrend.
- Corporate bonds, VIX, and transports are all supportive of a broad-based foundation for a possible uptrend.
- Leading economic data is forecasting a slowdown.
- Don’t fight the Fed remains in force. If the Fed is almost done increasing interest rates, then don’t fight the market.
In this article, let us review economic data, the bond market, commodities, U.S. Dollar Index (DXY), stock market charts, market sentiment, and other charts to determine if we are at the cusp of a new bull market or a bull trap for the S&P 500 Index (SP500). While this analysis is considered technical analysis, in my opinion, it is reviewing 360 degrees of investment landscape.
Economic Data
The economic data indicates likelihood of a recession is increasing. The chart below by The Conference Board illustrates the growth rate of leading economic indicator or LEI. The growth rate is bouncing between positive and negative, which has signaled a slowdown in the past.
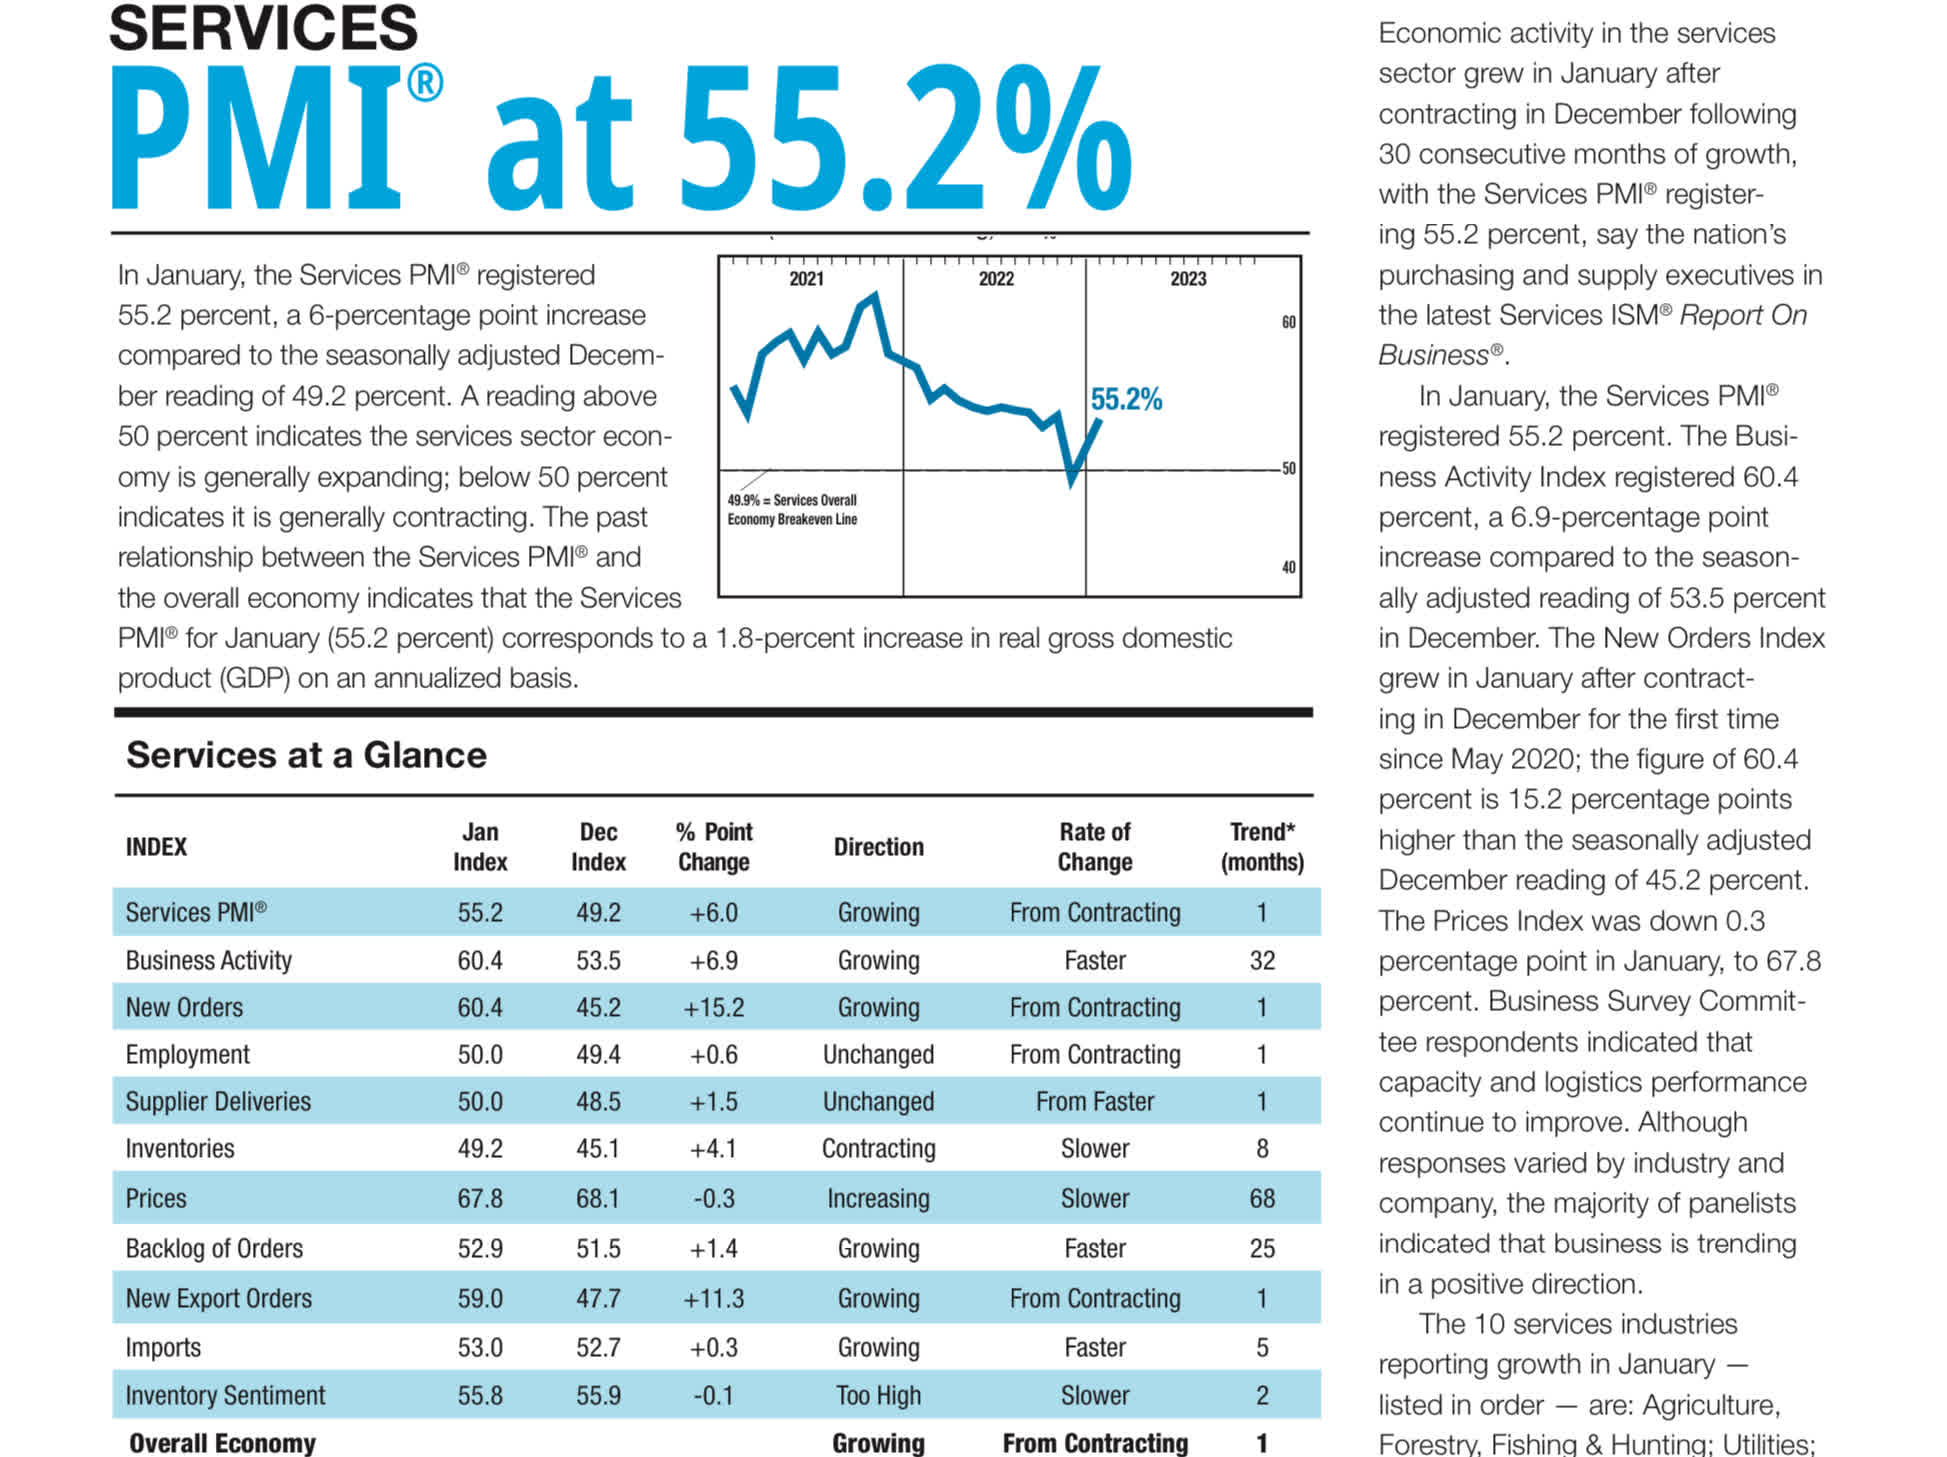
PMI for services has bounced back above 50 after going negative for a month.
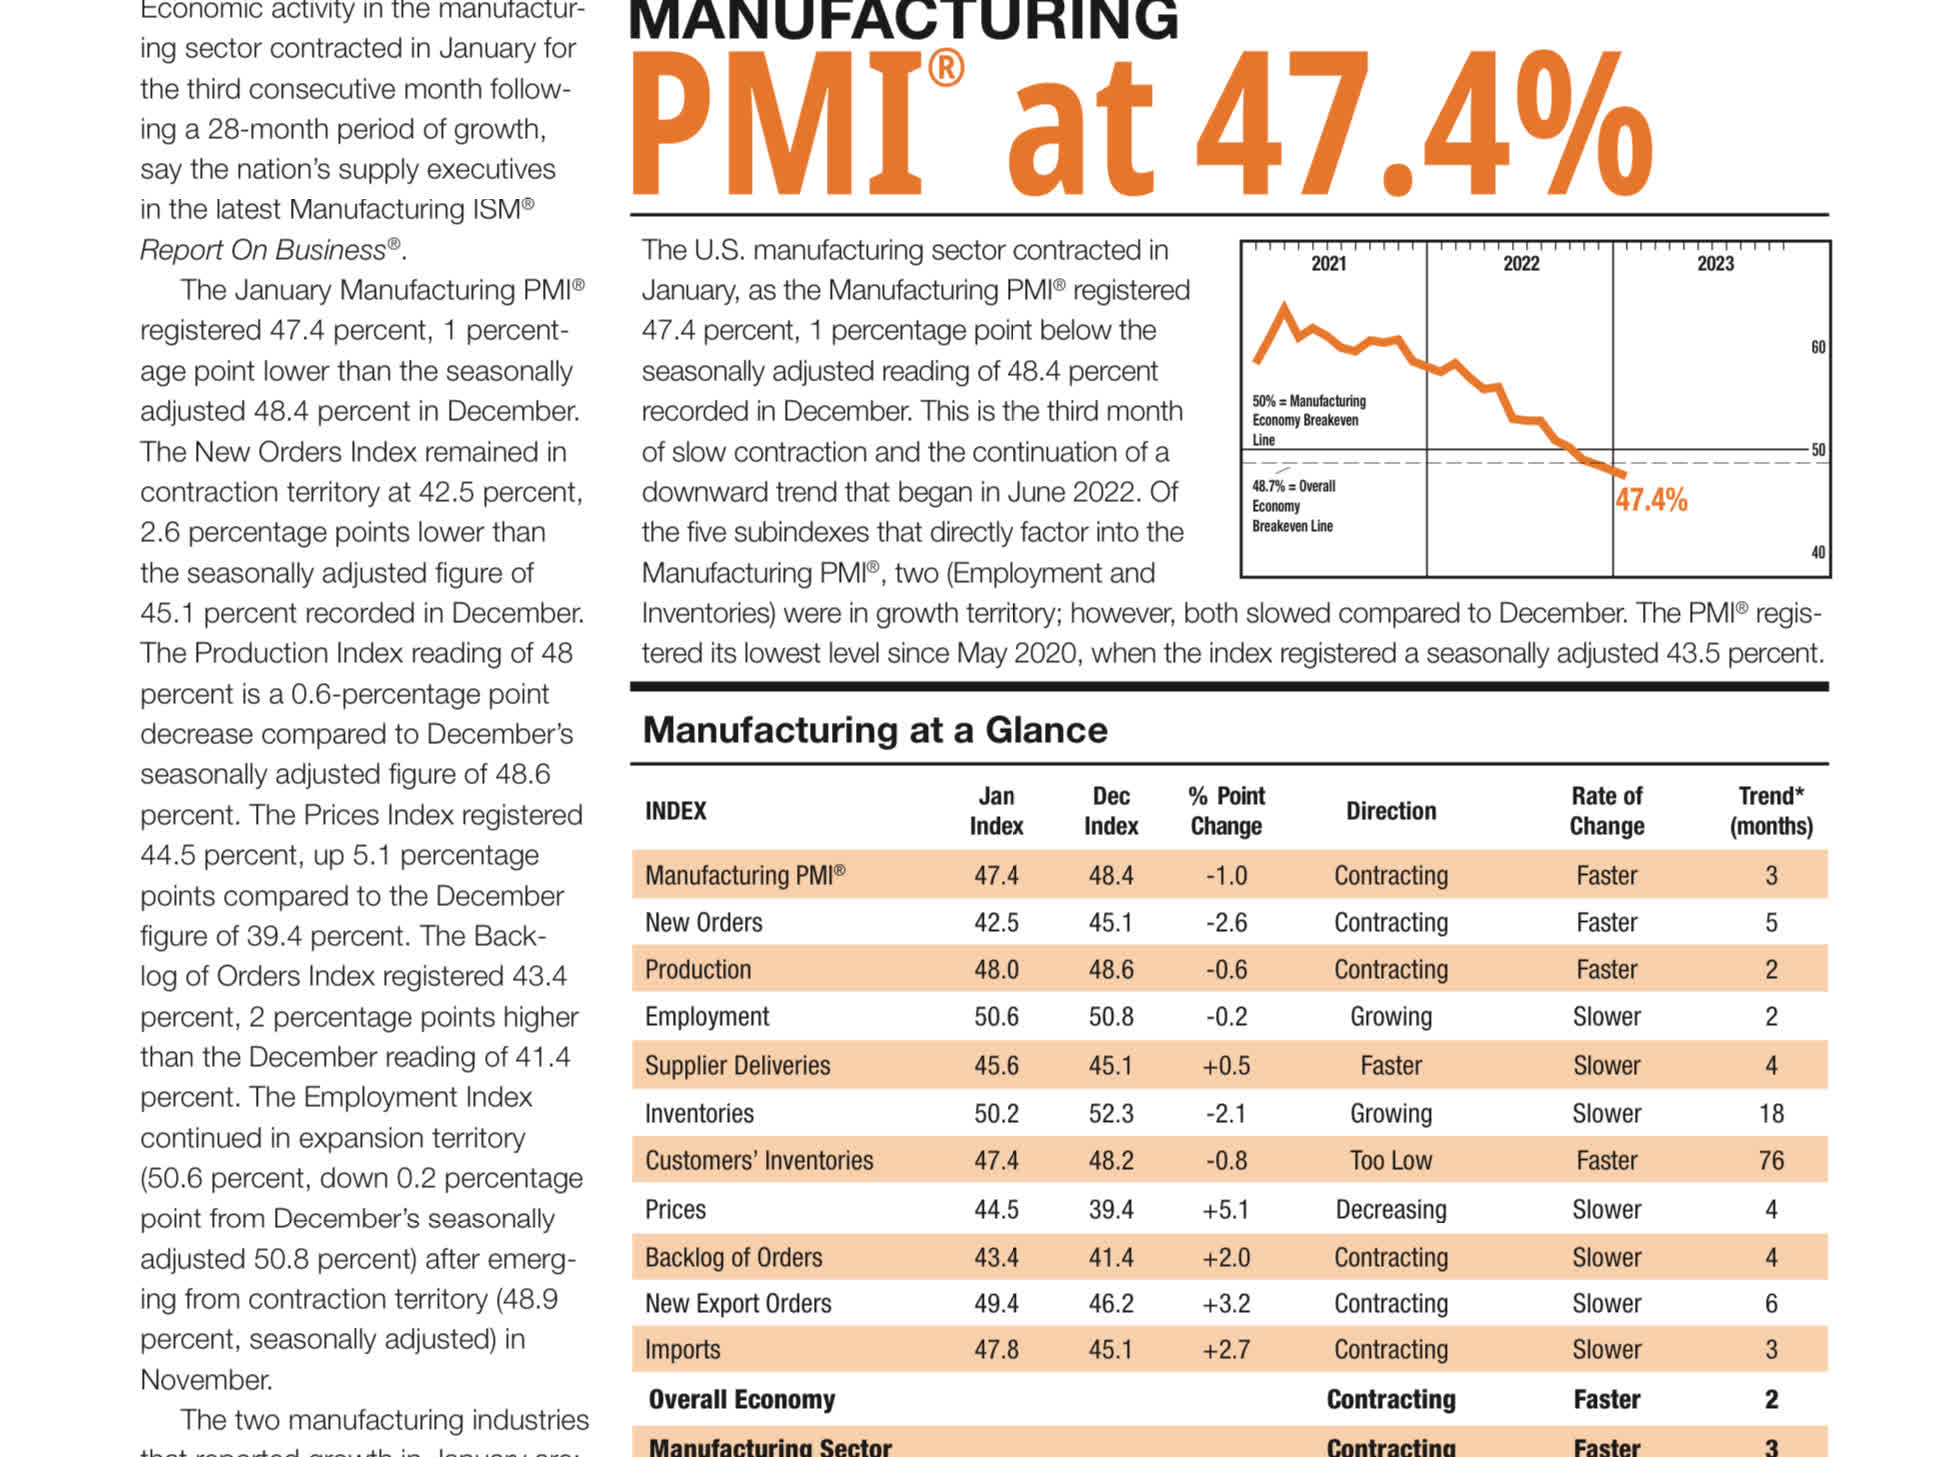
However, the manufacturing PMI has been below 50 for multiple months.
Unemployment
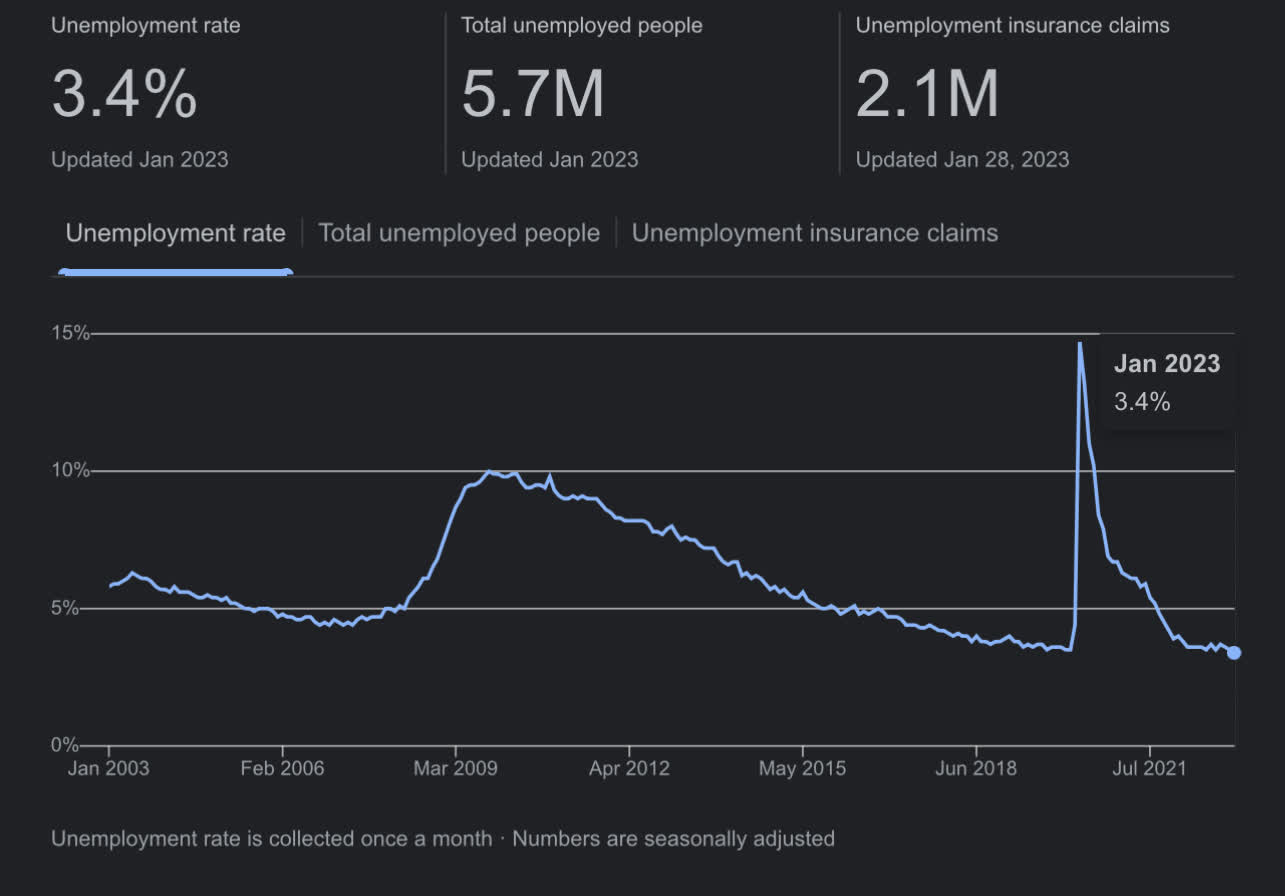
U.S. economy is continuing to grow employment. The unemployment rate is at a near 70 year low of 3.4%.
Delinquency Rates
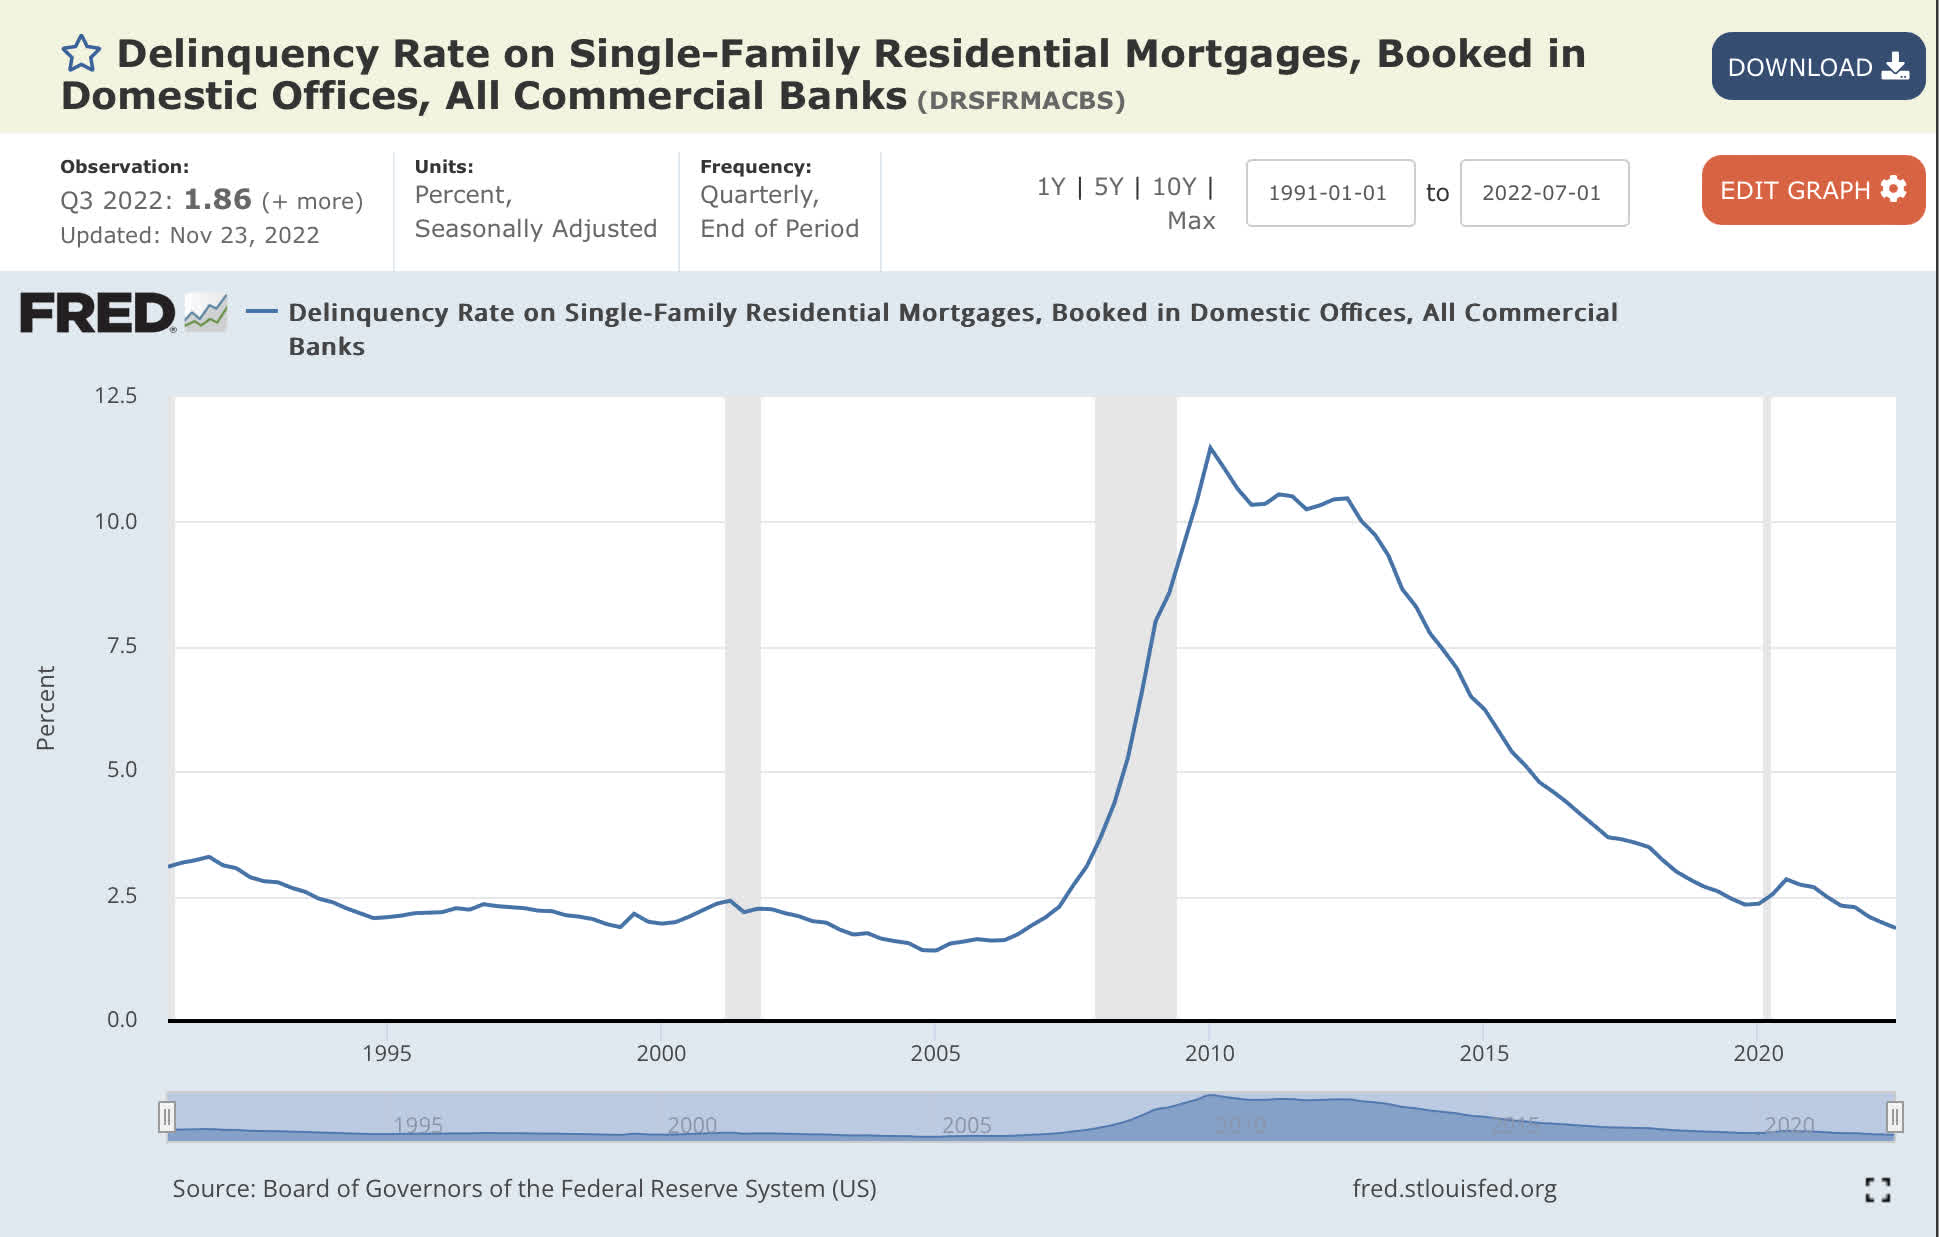
The delinquency rates for mortgages has unexpectedly trended lower through 2022. A check of the latest available delinquency rates until October 2022 shows decline of 1% compared to October 2021. This could be due to robust employment rates.
The delinquency rates for credit cards has ticked higher, but it is far below levels that would be concerning.
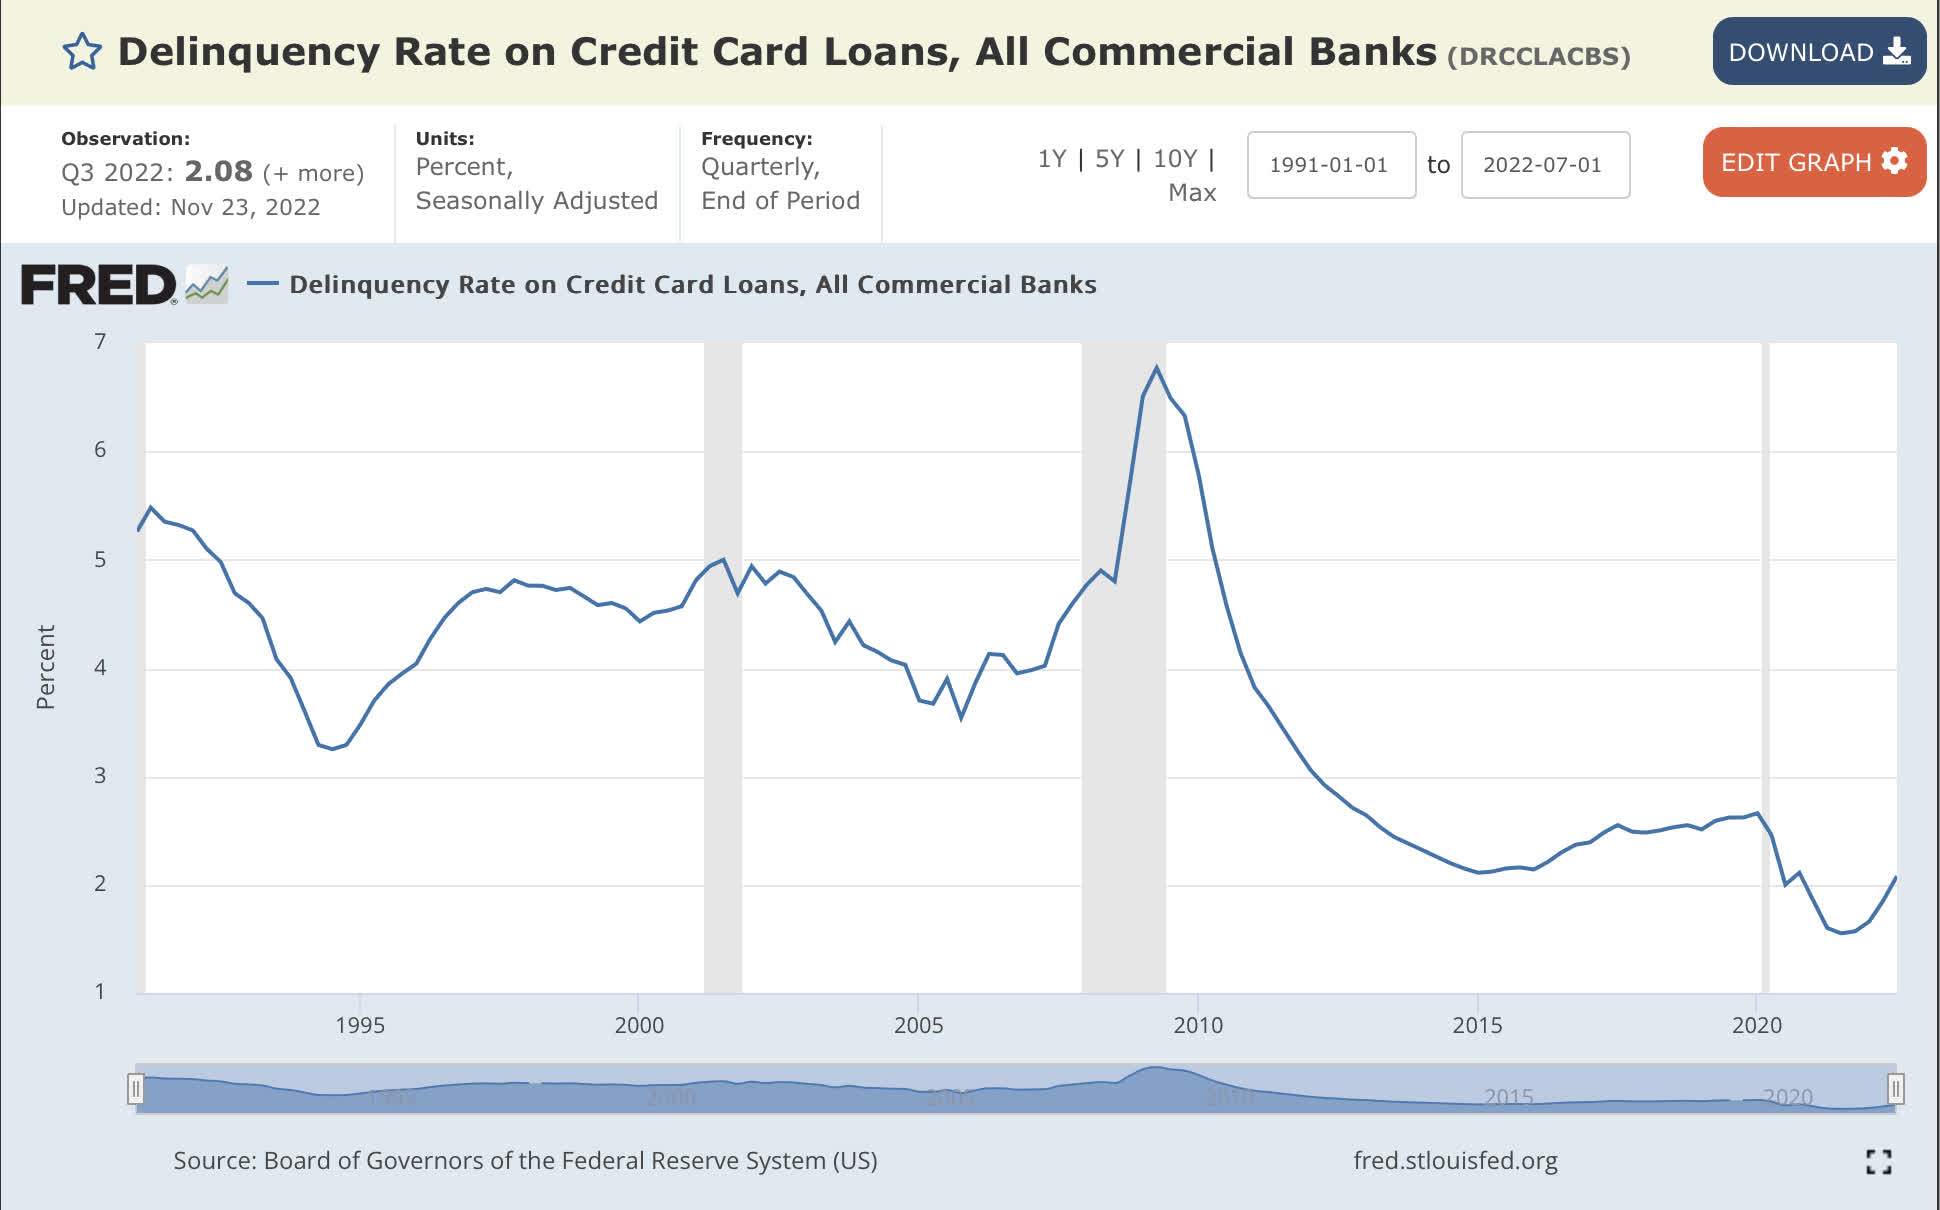
The delinquency rates for business loans is at the lower end of the range for delinquency rates over the past few decades.
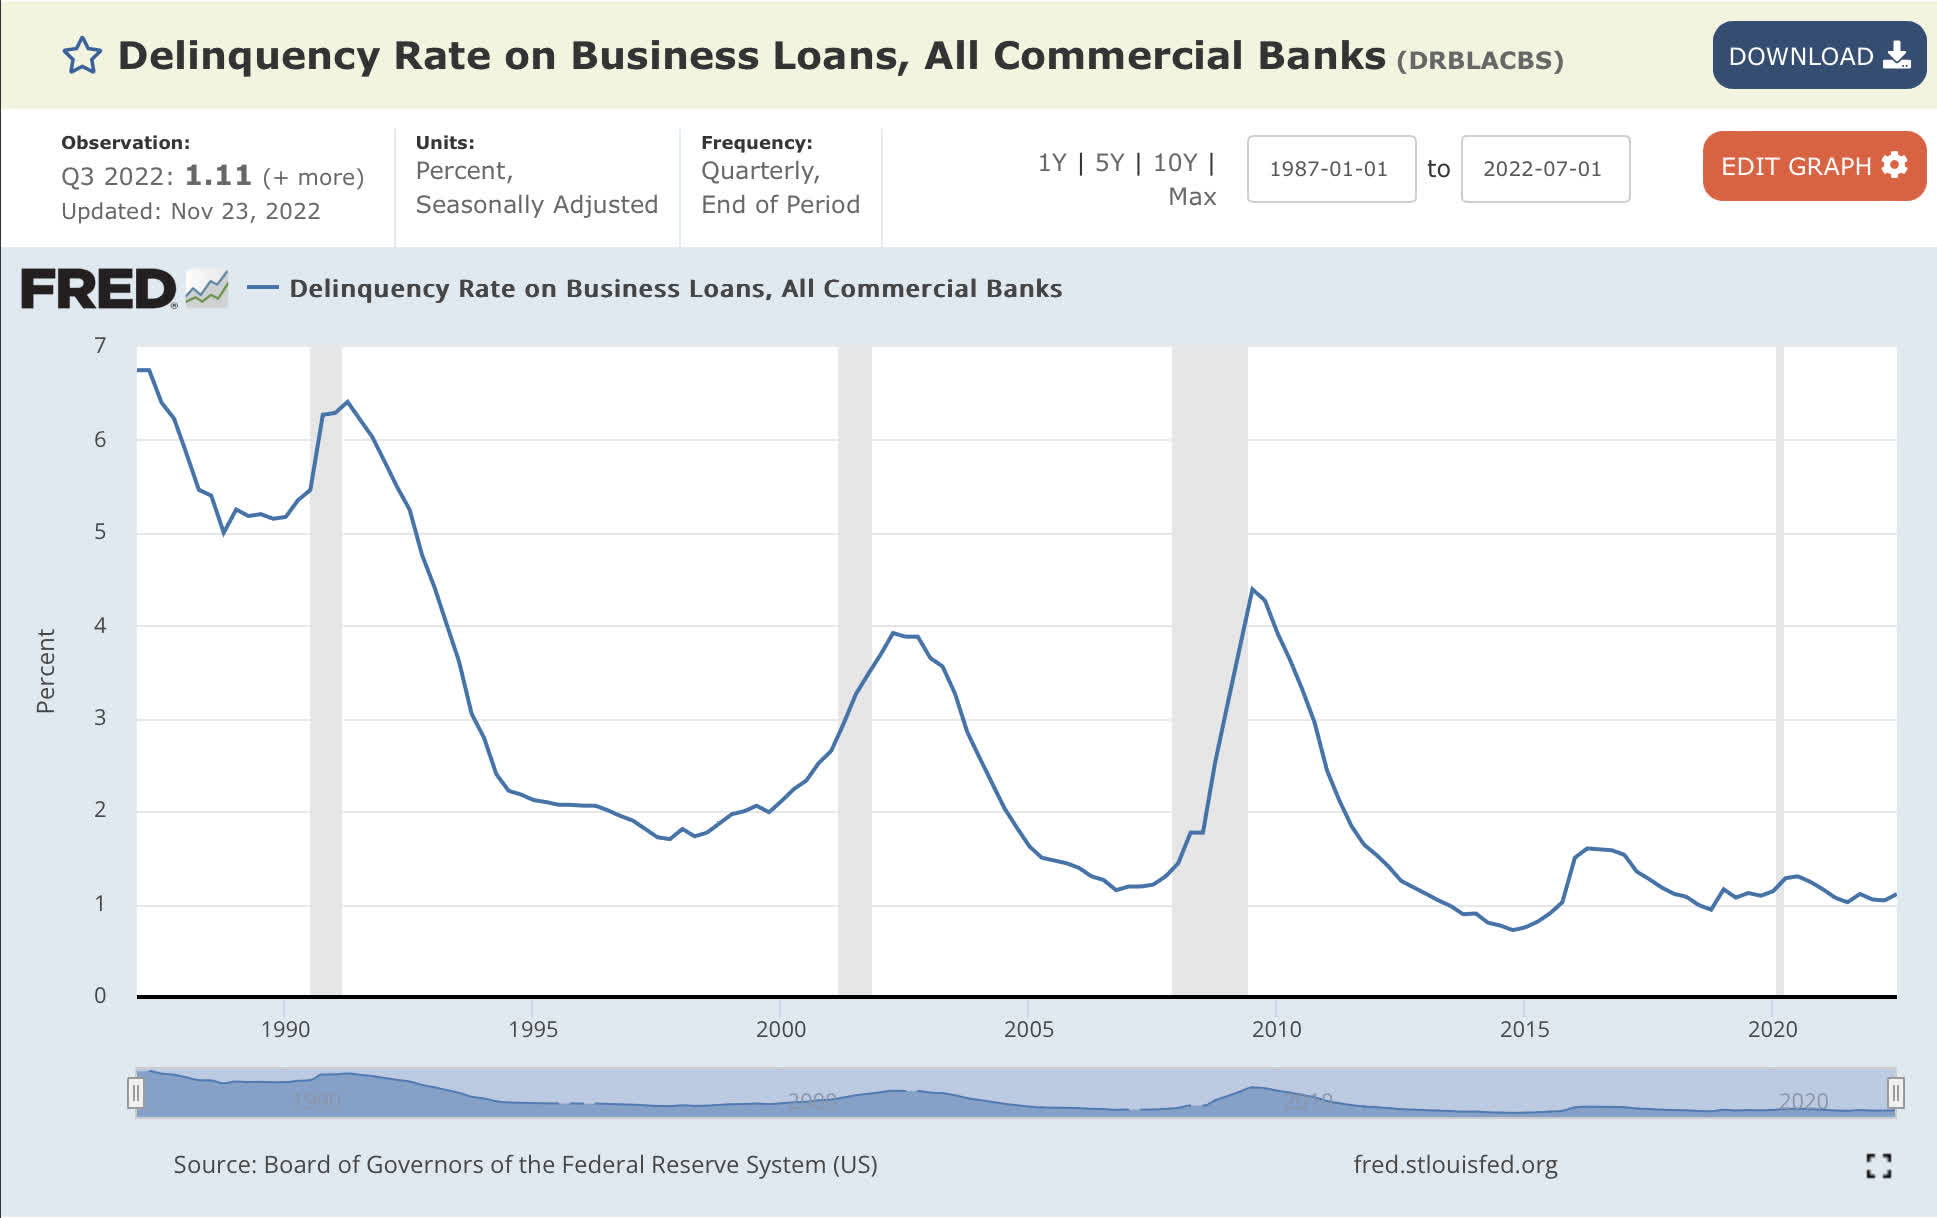
Disposable Personal Income has dropped dramatically. This is the first sign that services consumption is going to be lower in the coming months.
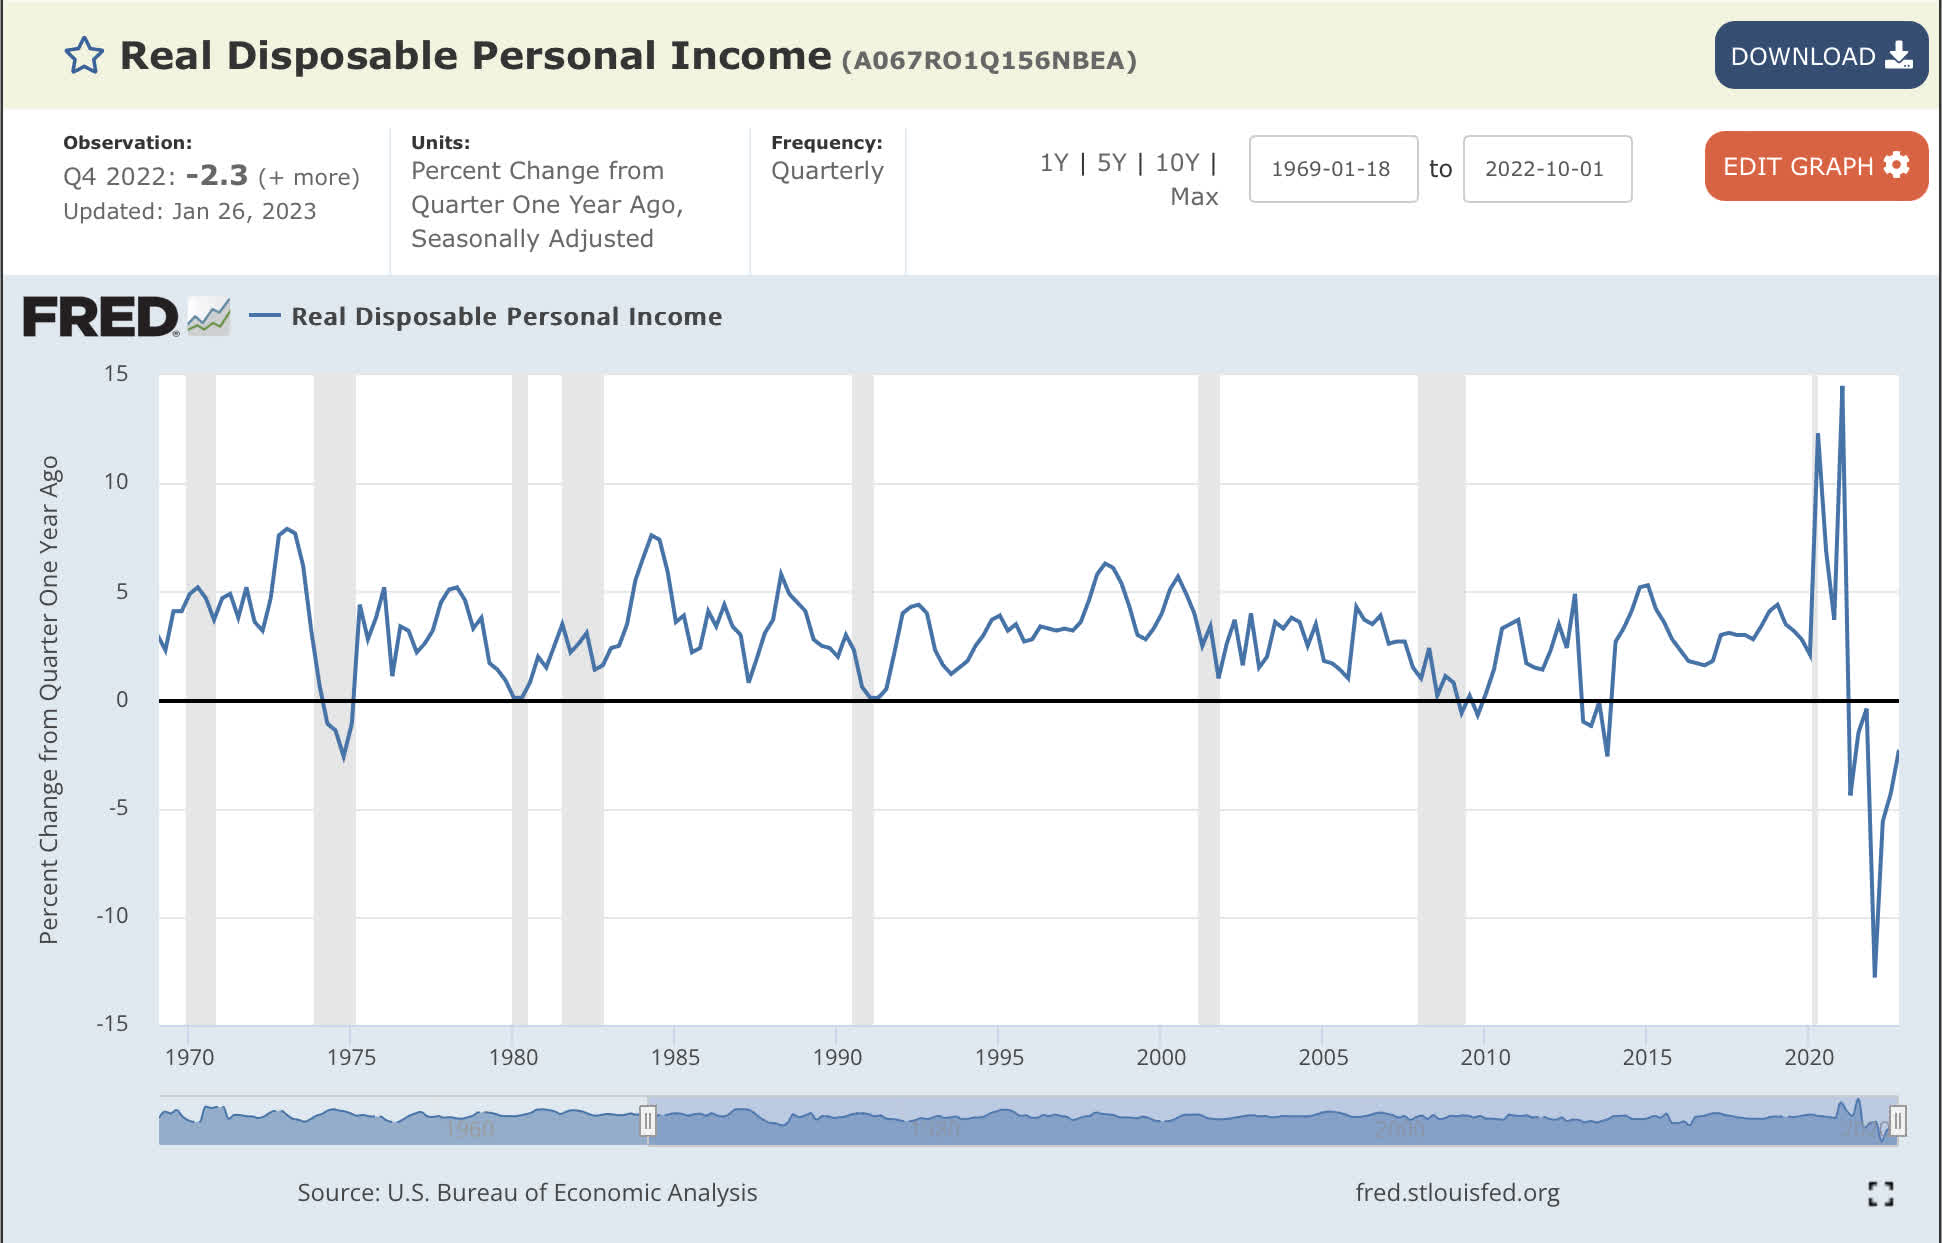
Bond Market
The bond market is always important, as it affects corporate earnings and valuation. This is due to the fact that investments of any kind are based off the risk-free rate from government securities like the U.S. treasuries.
The 10 year treasury bond is around 3.5% year ago, the 10 year treasury was at 1.8%. Stock valuation and investor expectations might have to adjust with the change in risk-free rate.
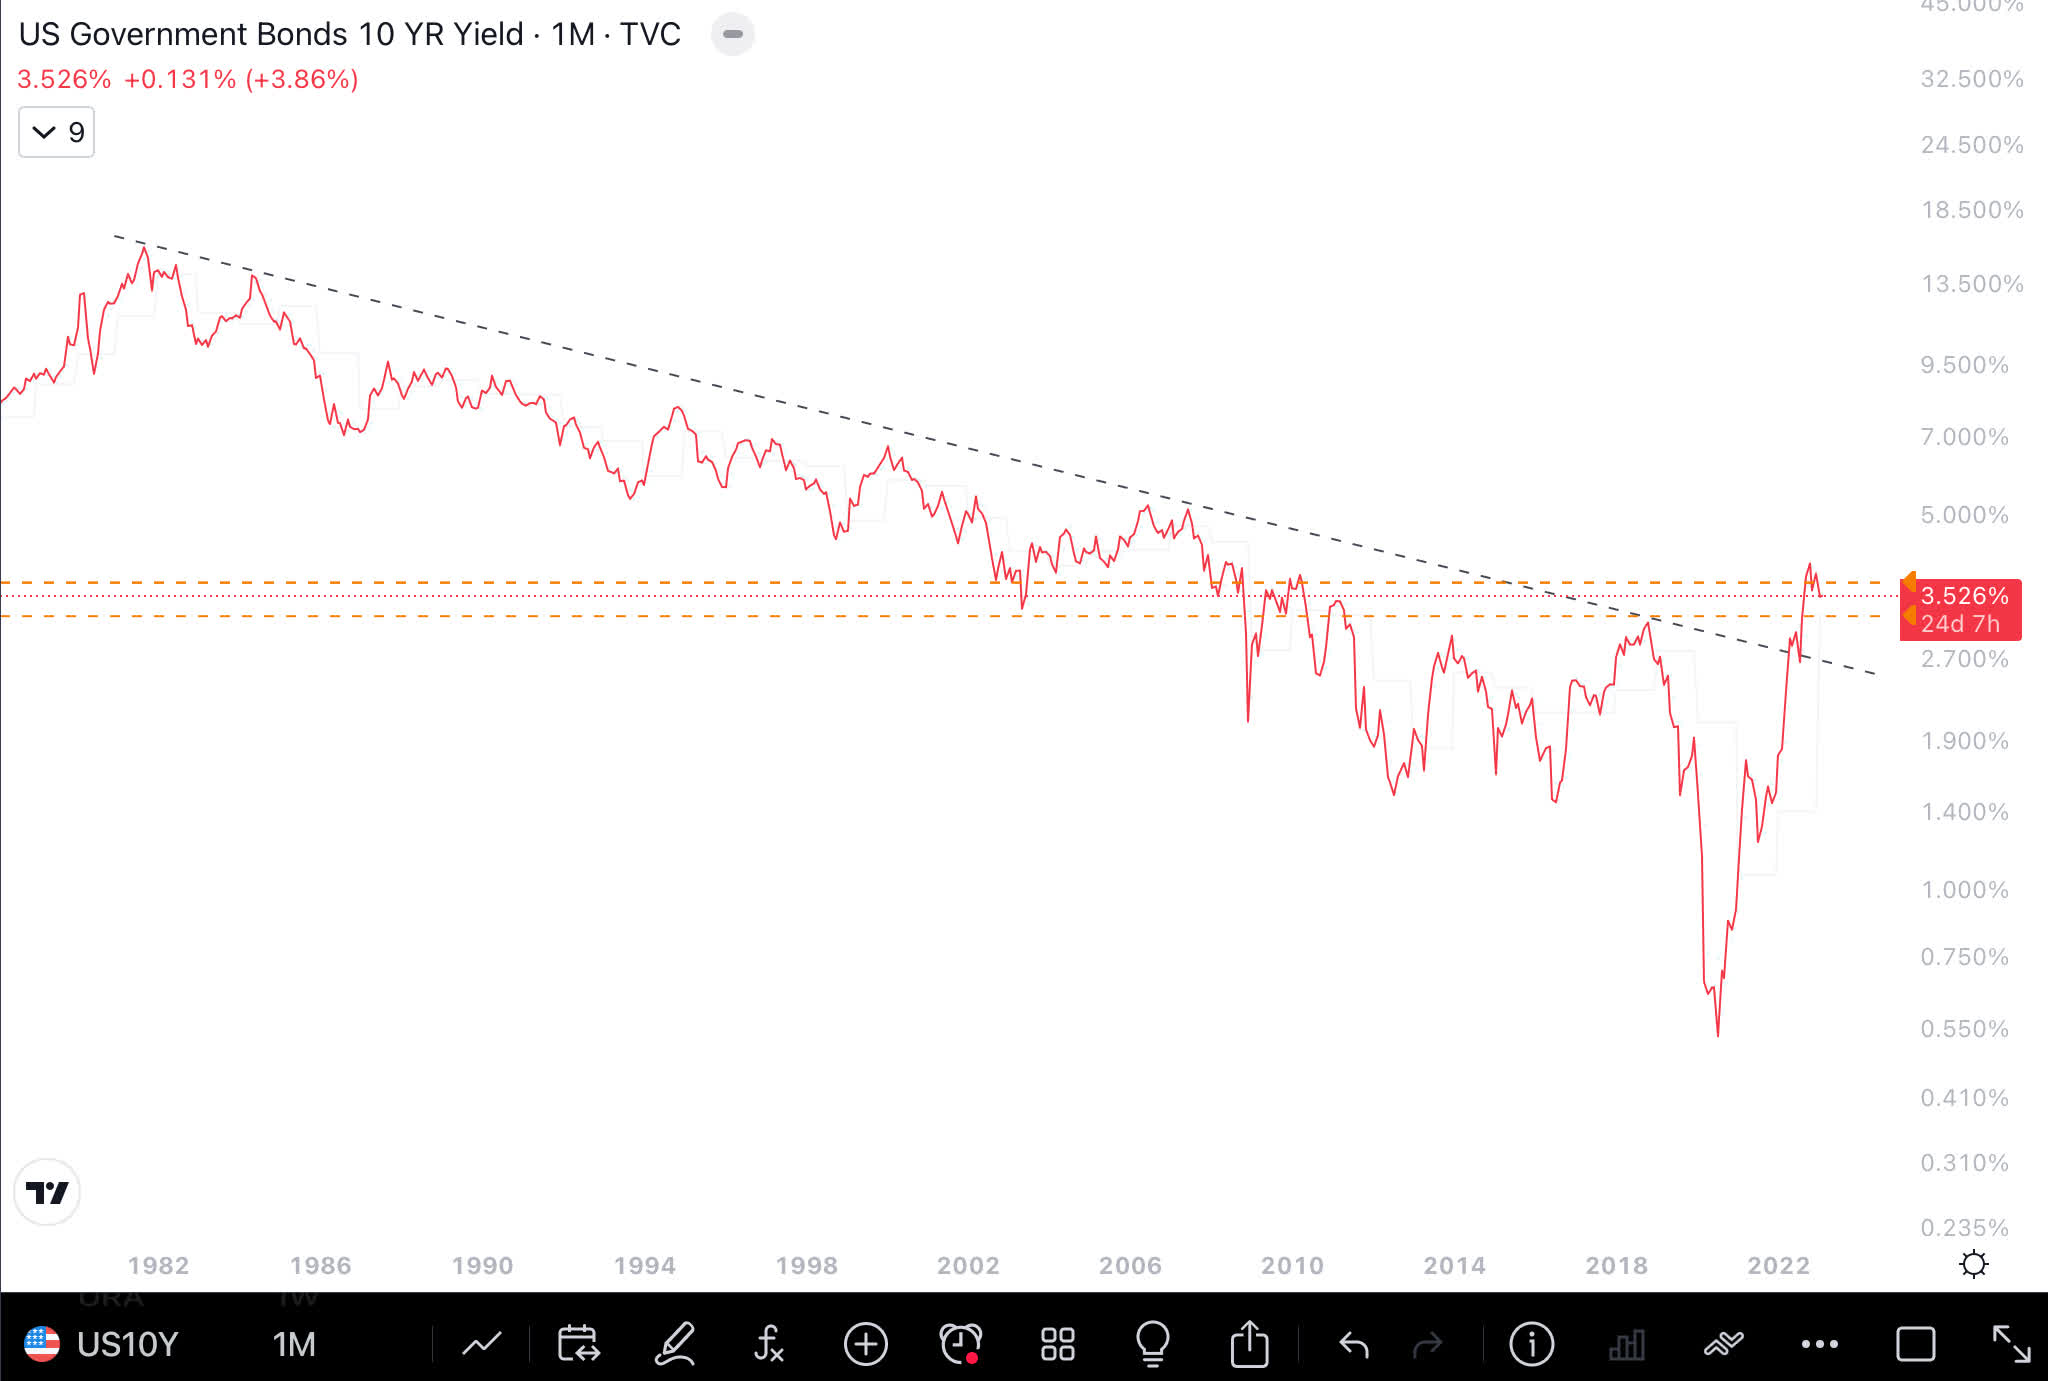
The 2 year is still in an uptrend unless it closes below 3.5%. A year ago, the 10 year treasury was below 1%.
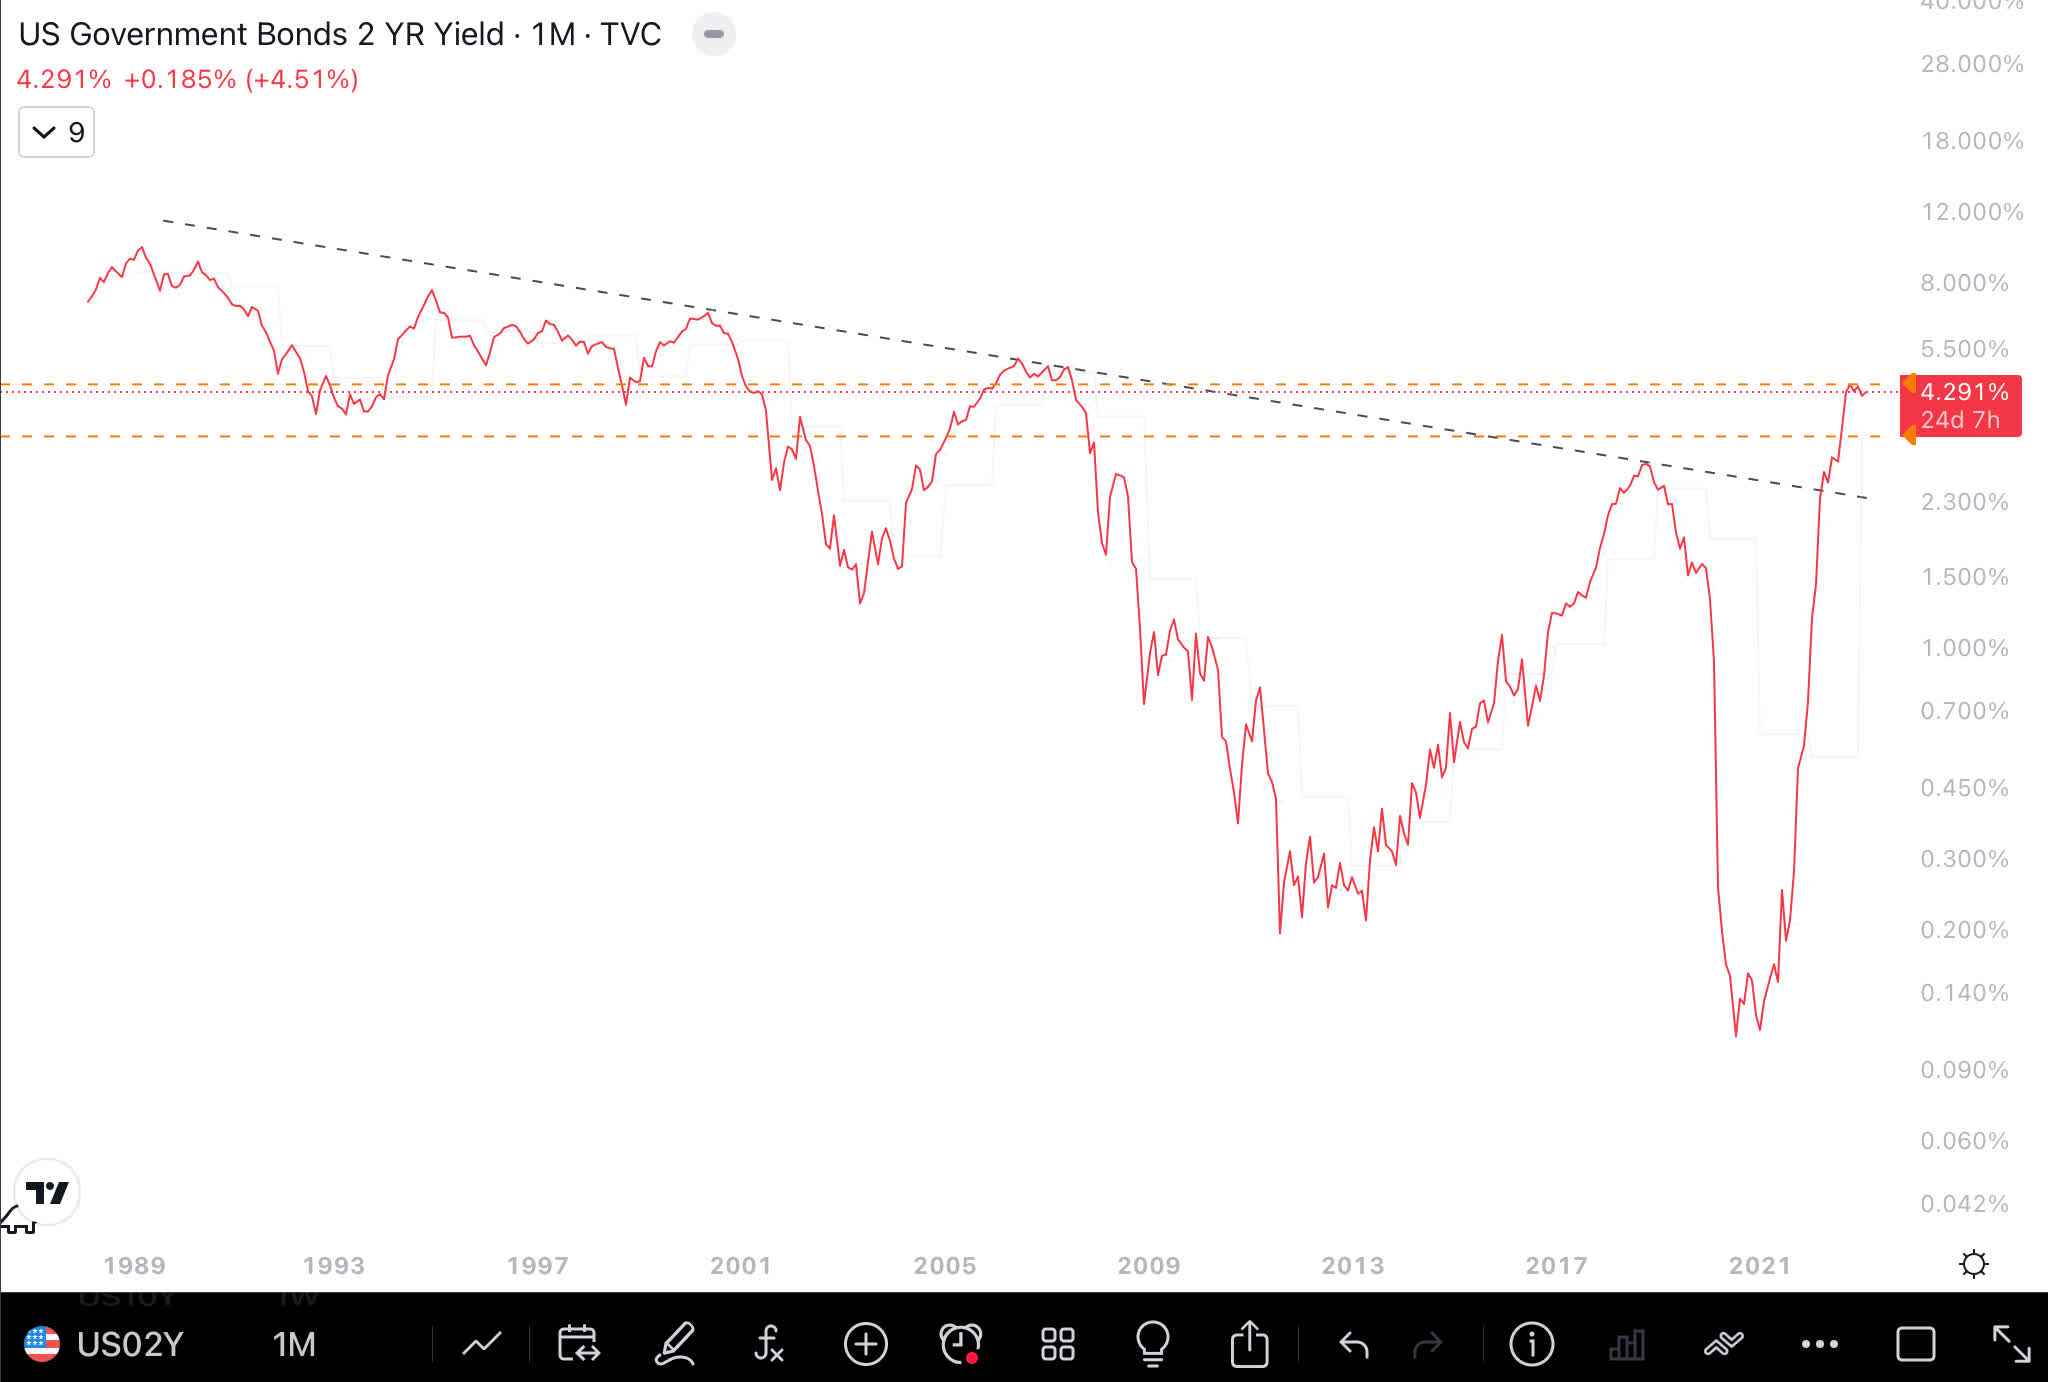
Inversion
The 10 year minus 3 month is deeply negative, which is another reason to expect an economic slowdown if not a recession.
10 year minus 3 month Treasuries (St Louis Federal Reserve )
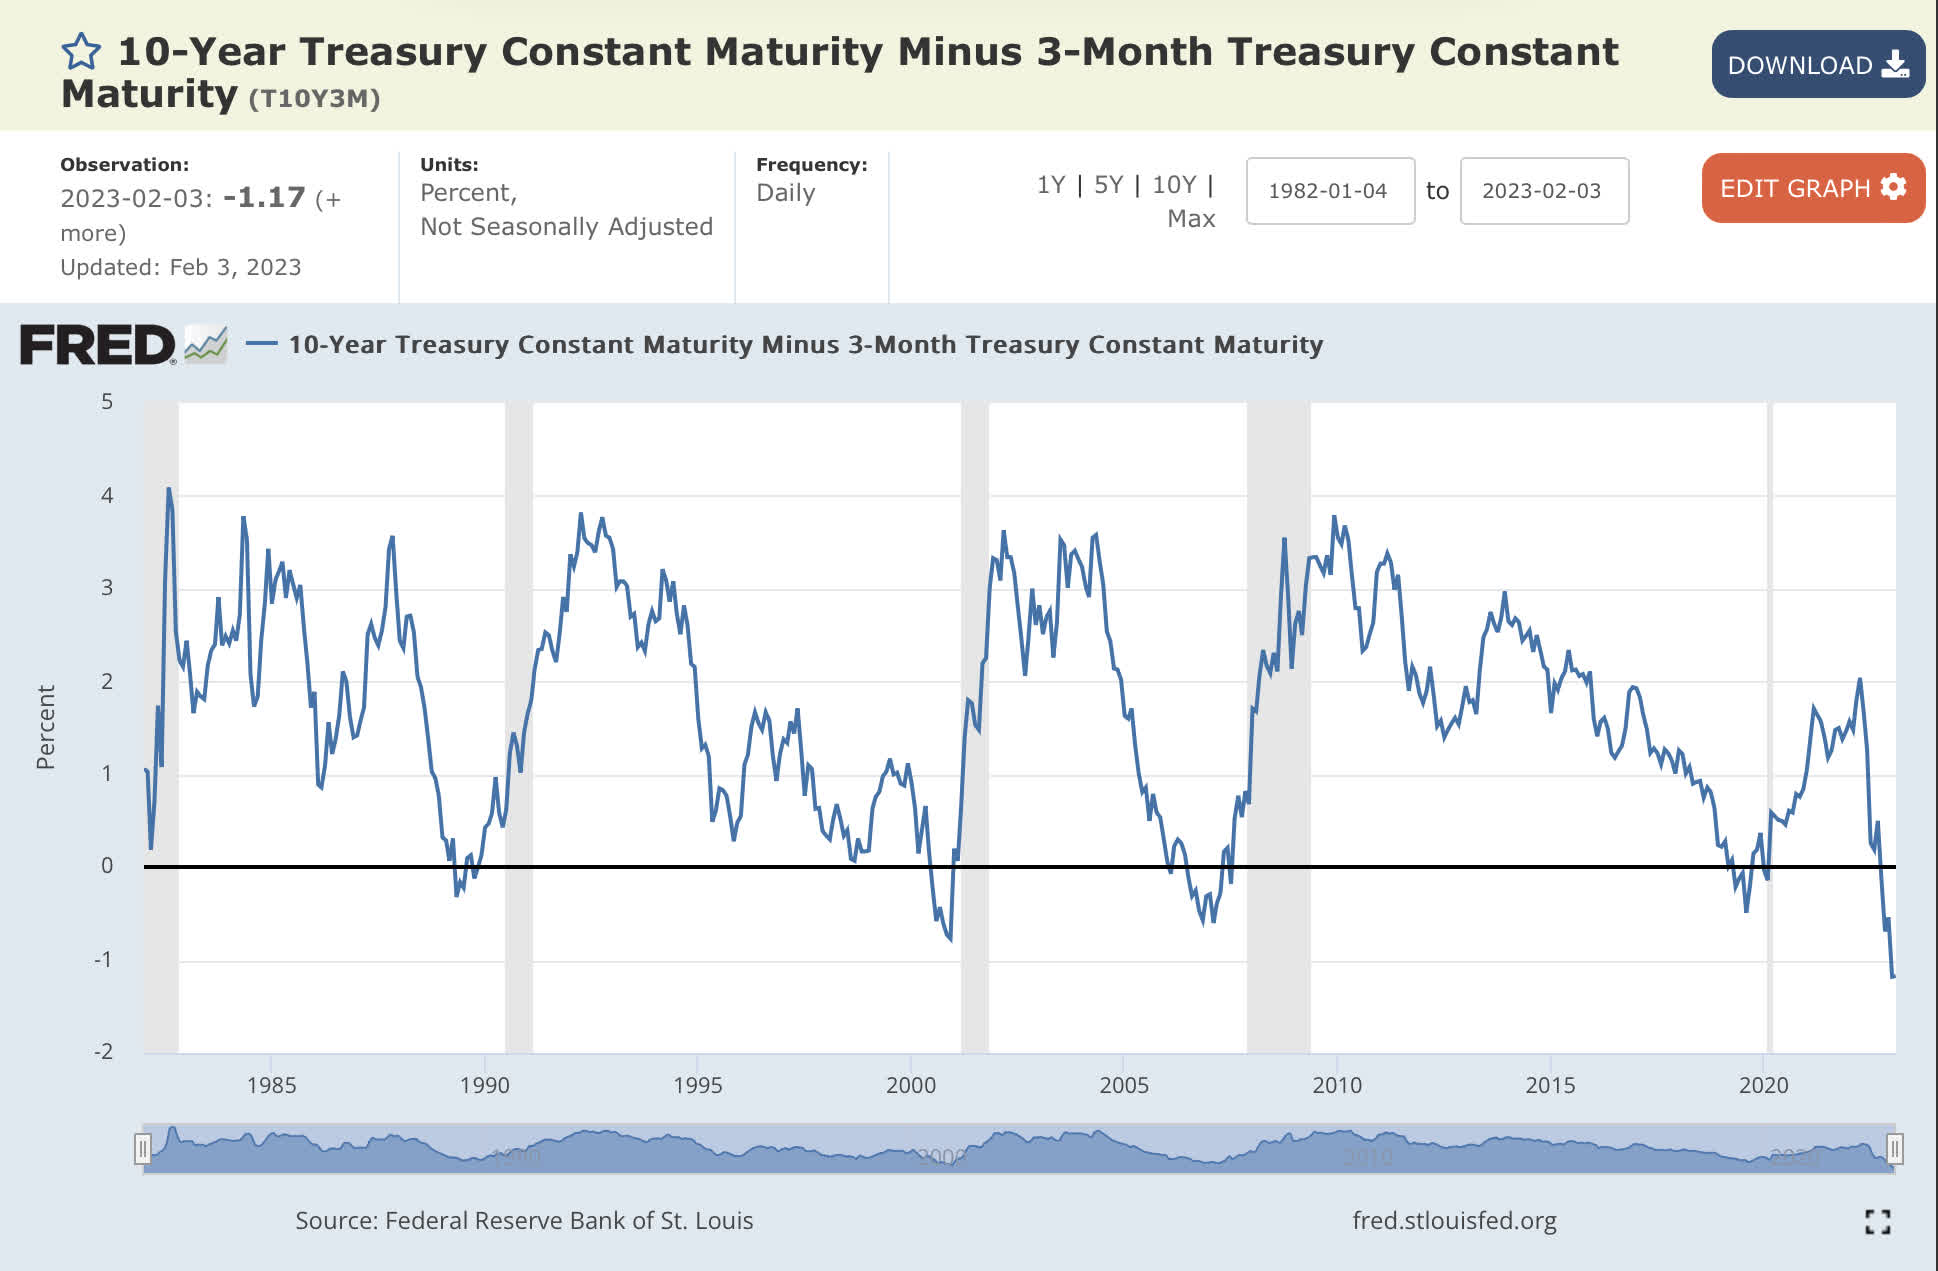
The 10 year minus 2 year is deeply negative, another reason to expect an economic slowdown if not a recession.
10 year minus 2 year Treasury Inversion (St Louis Federal Reserve )
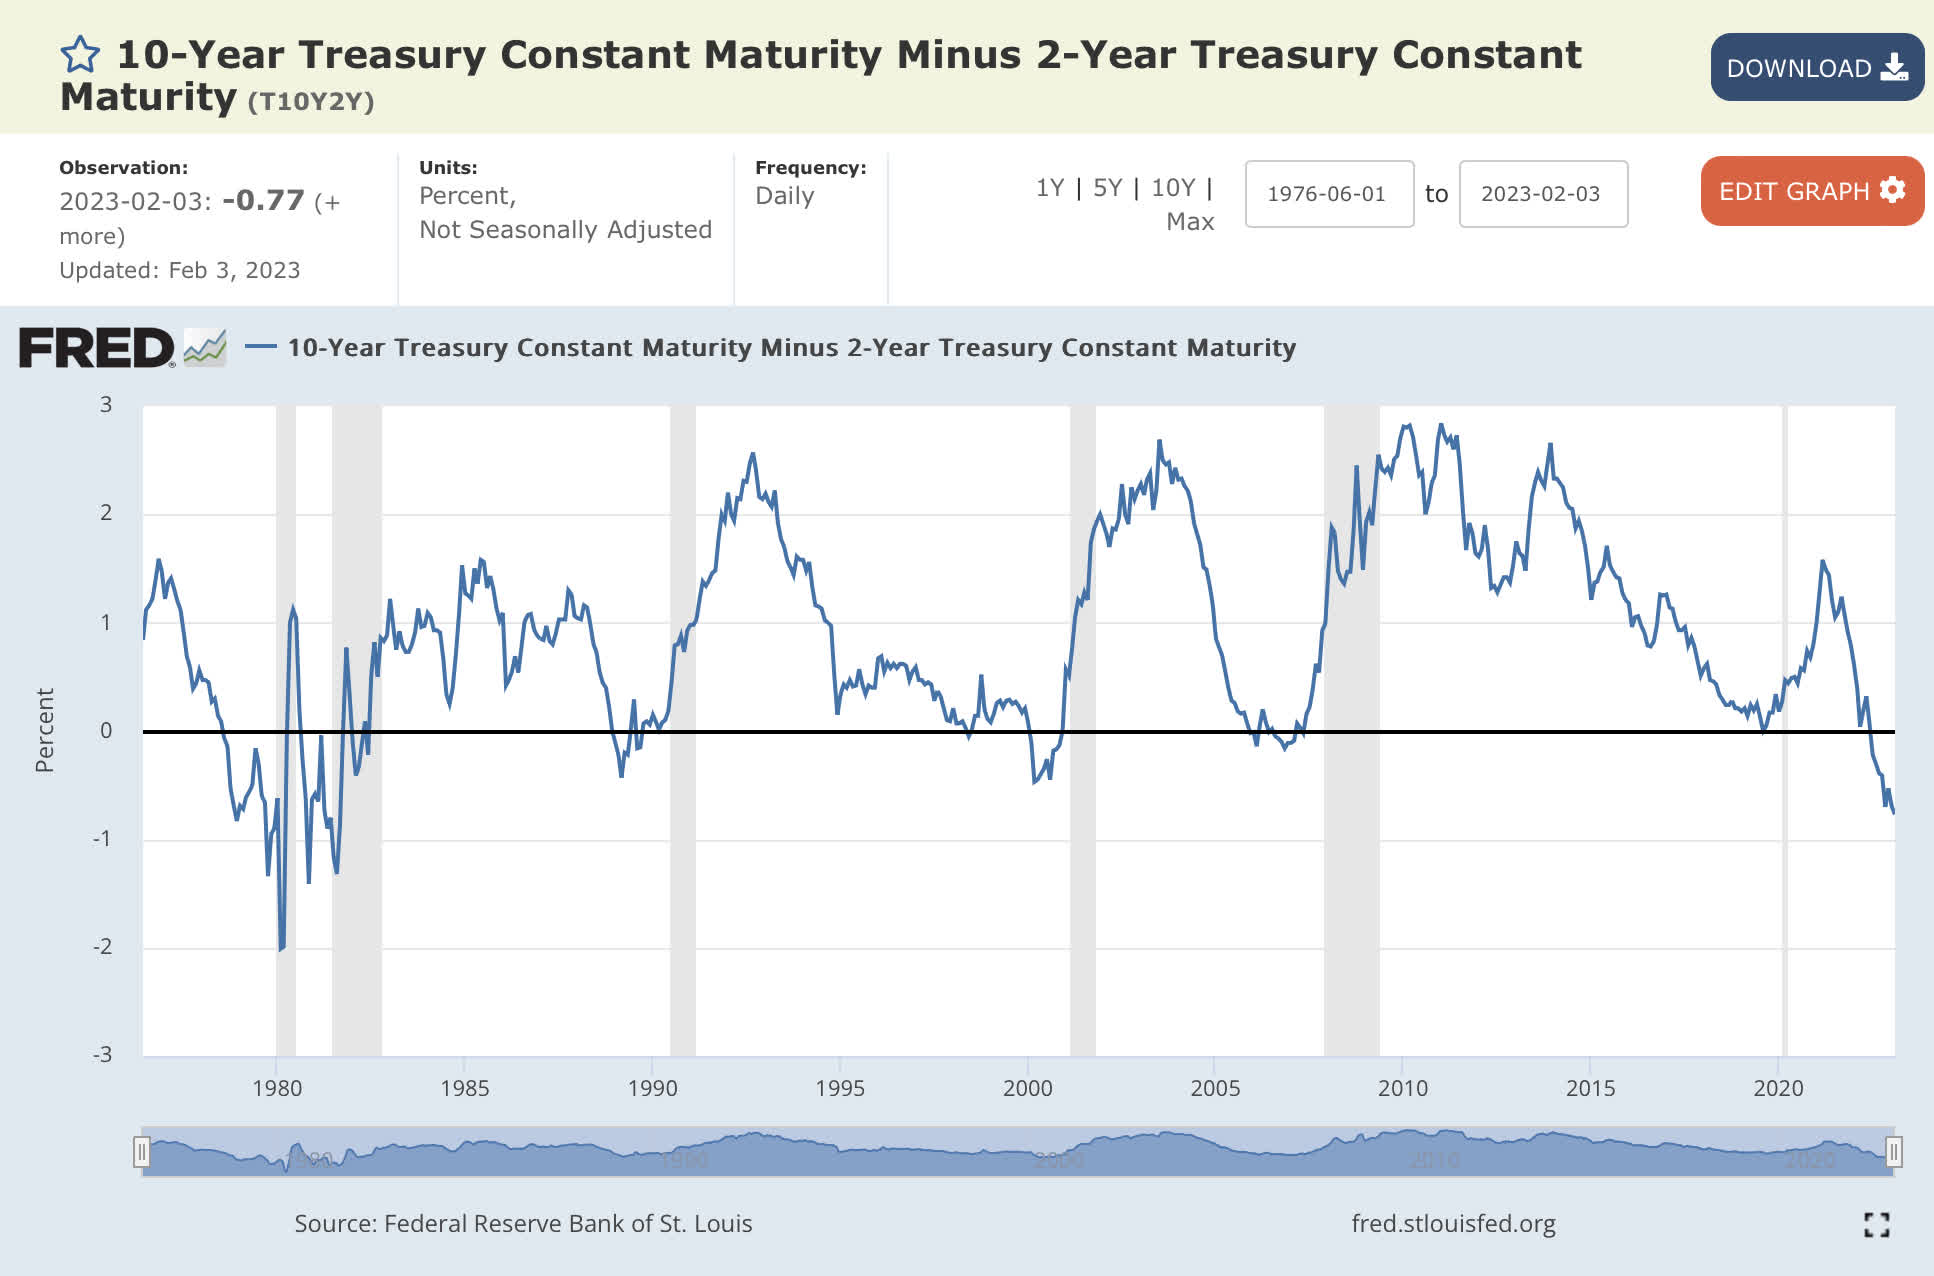
Money Supply
The money supply, as measured by M2, has gone negative due to quantitative tightening.
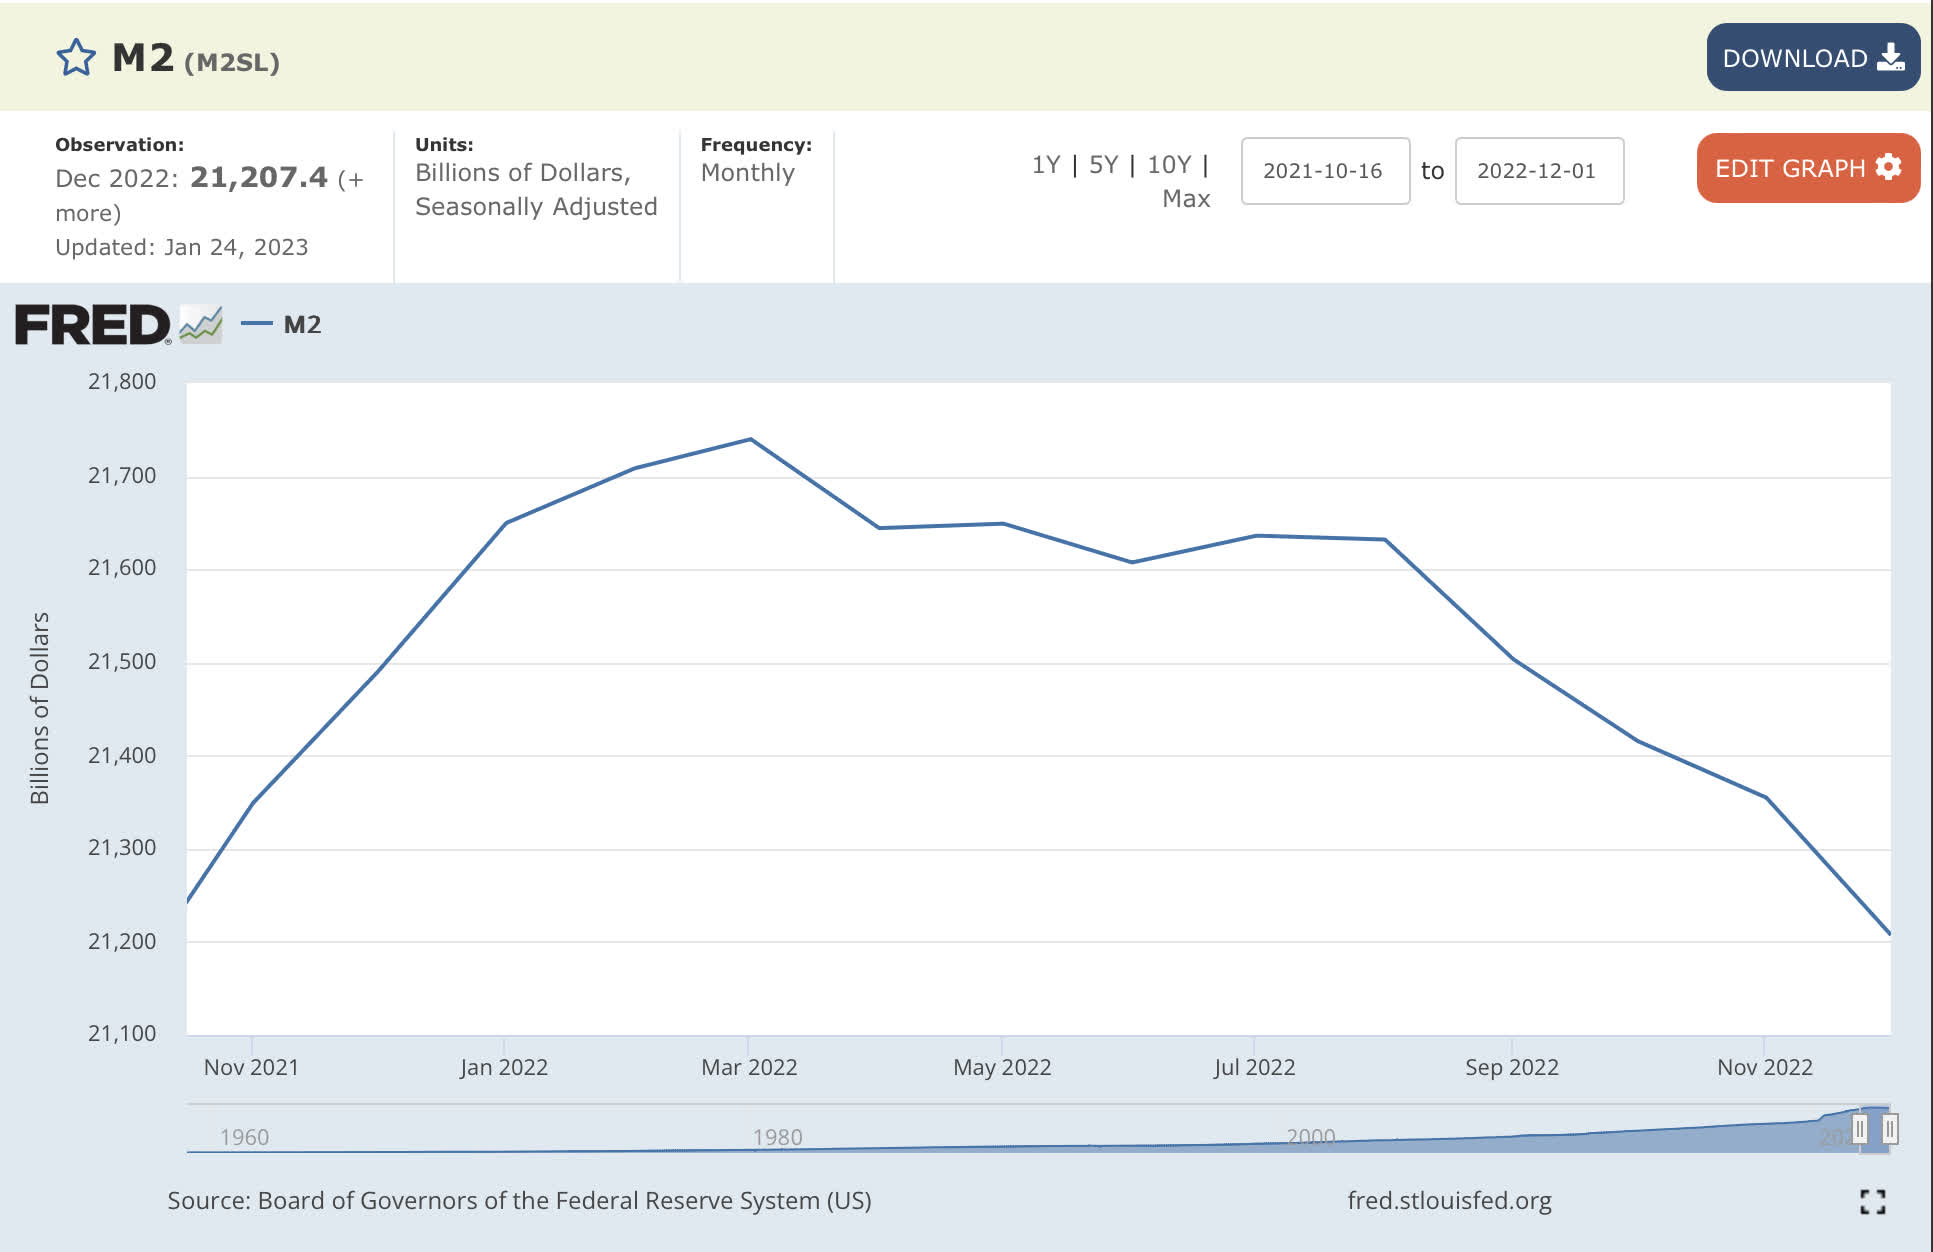
Corporate Bond
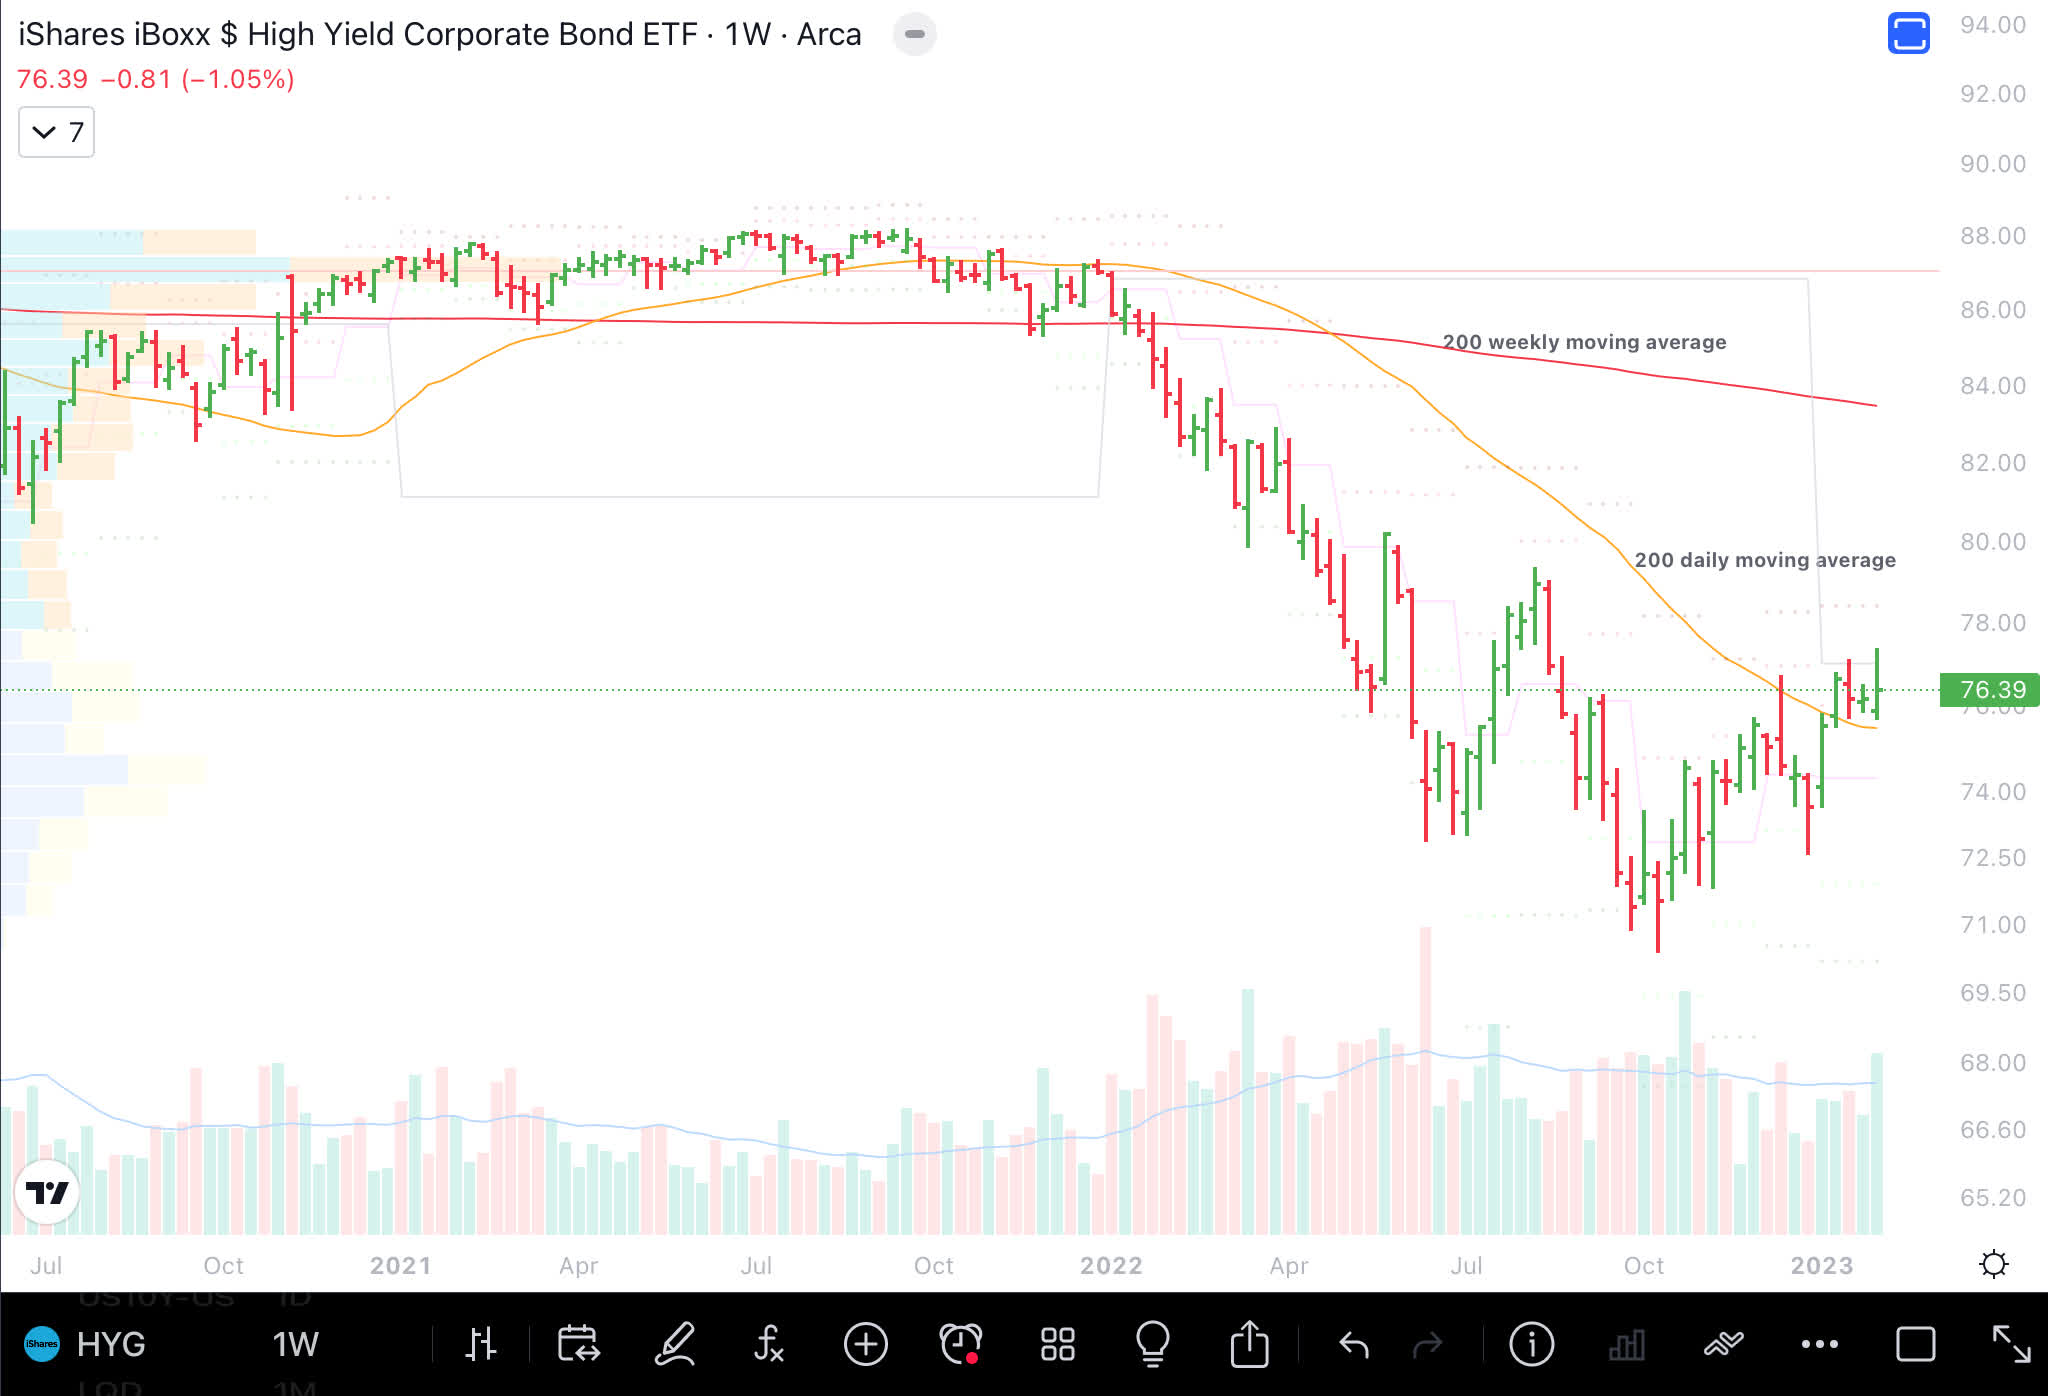
High Yield Corporate ( HYG ) has bounced from lows of October 2022, which means risk-taking might be coming back.
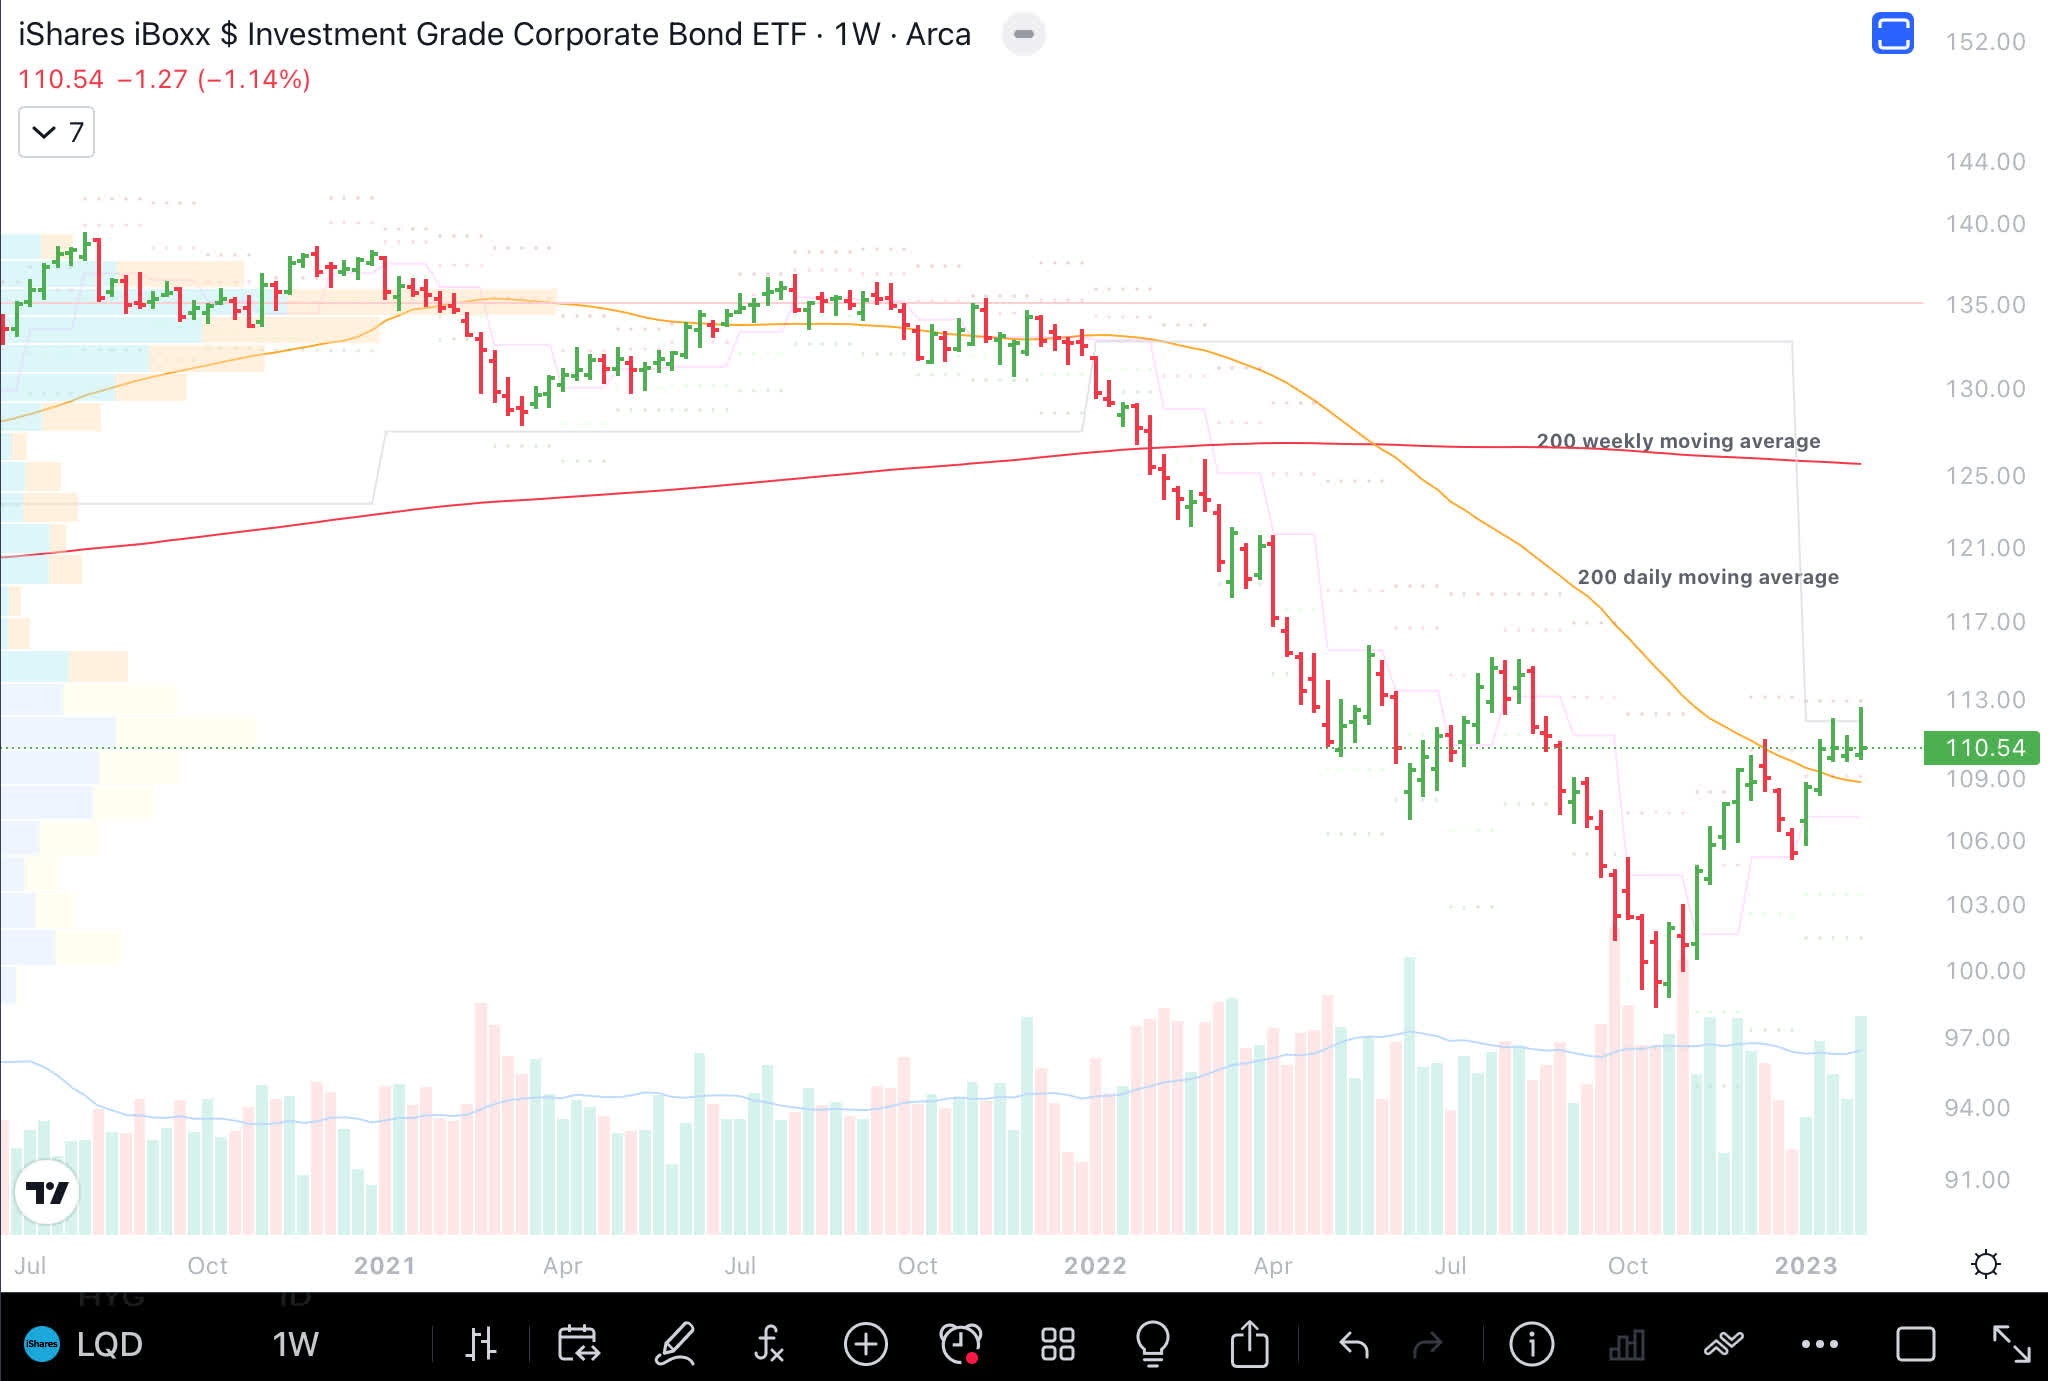
Investment Grade Corporate has also bounced from October 2022 lows; however, we need to see consistently higher levels in the coming months.
High Yield Index
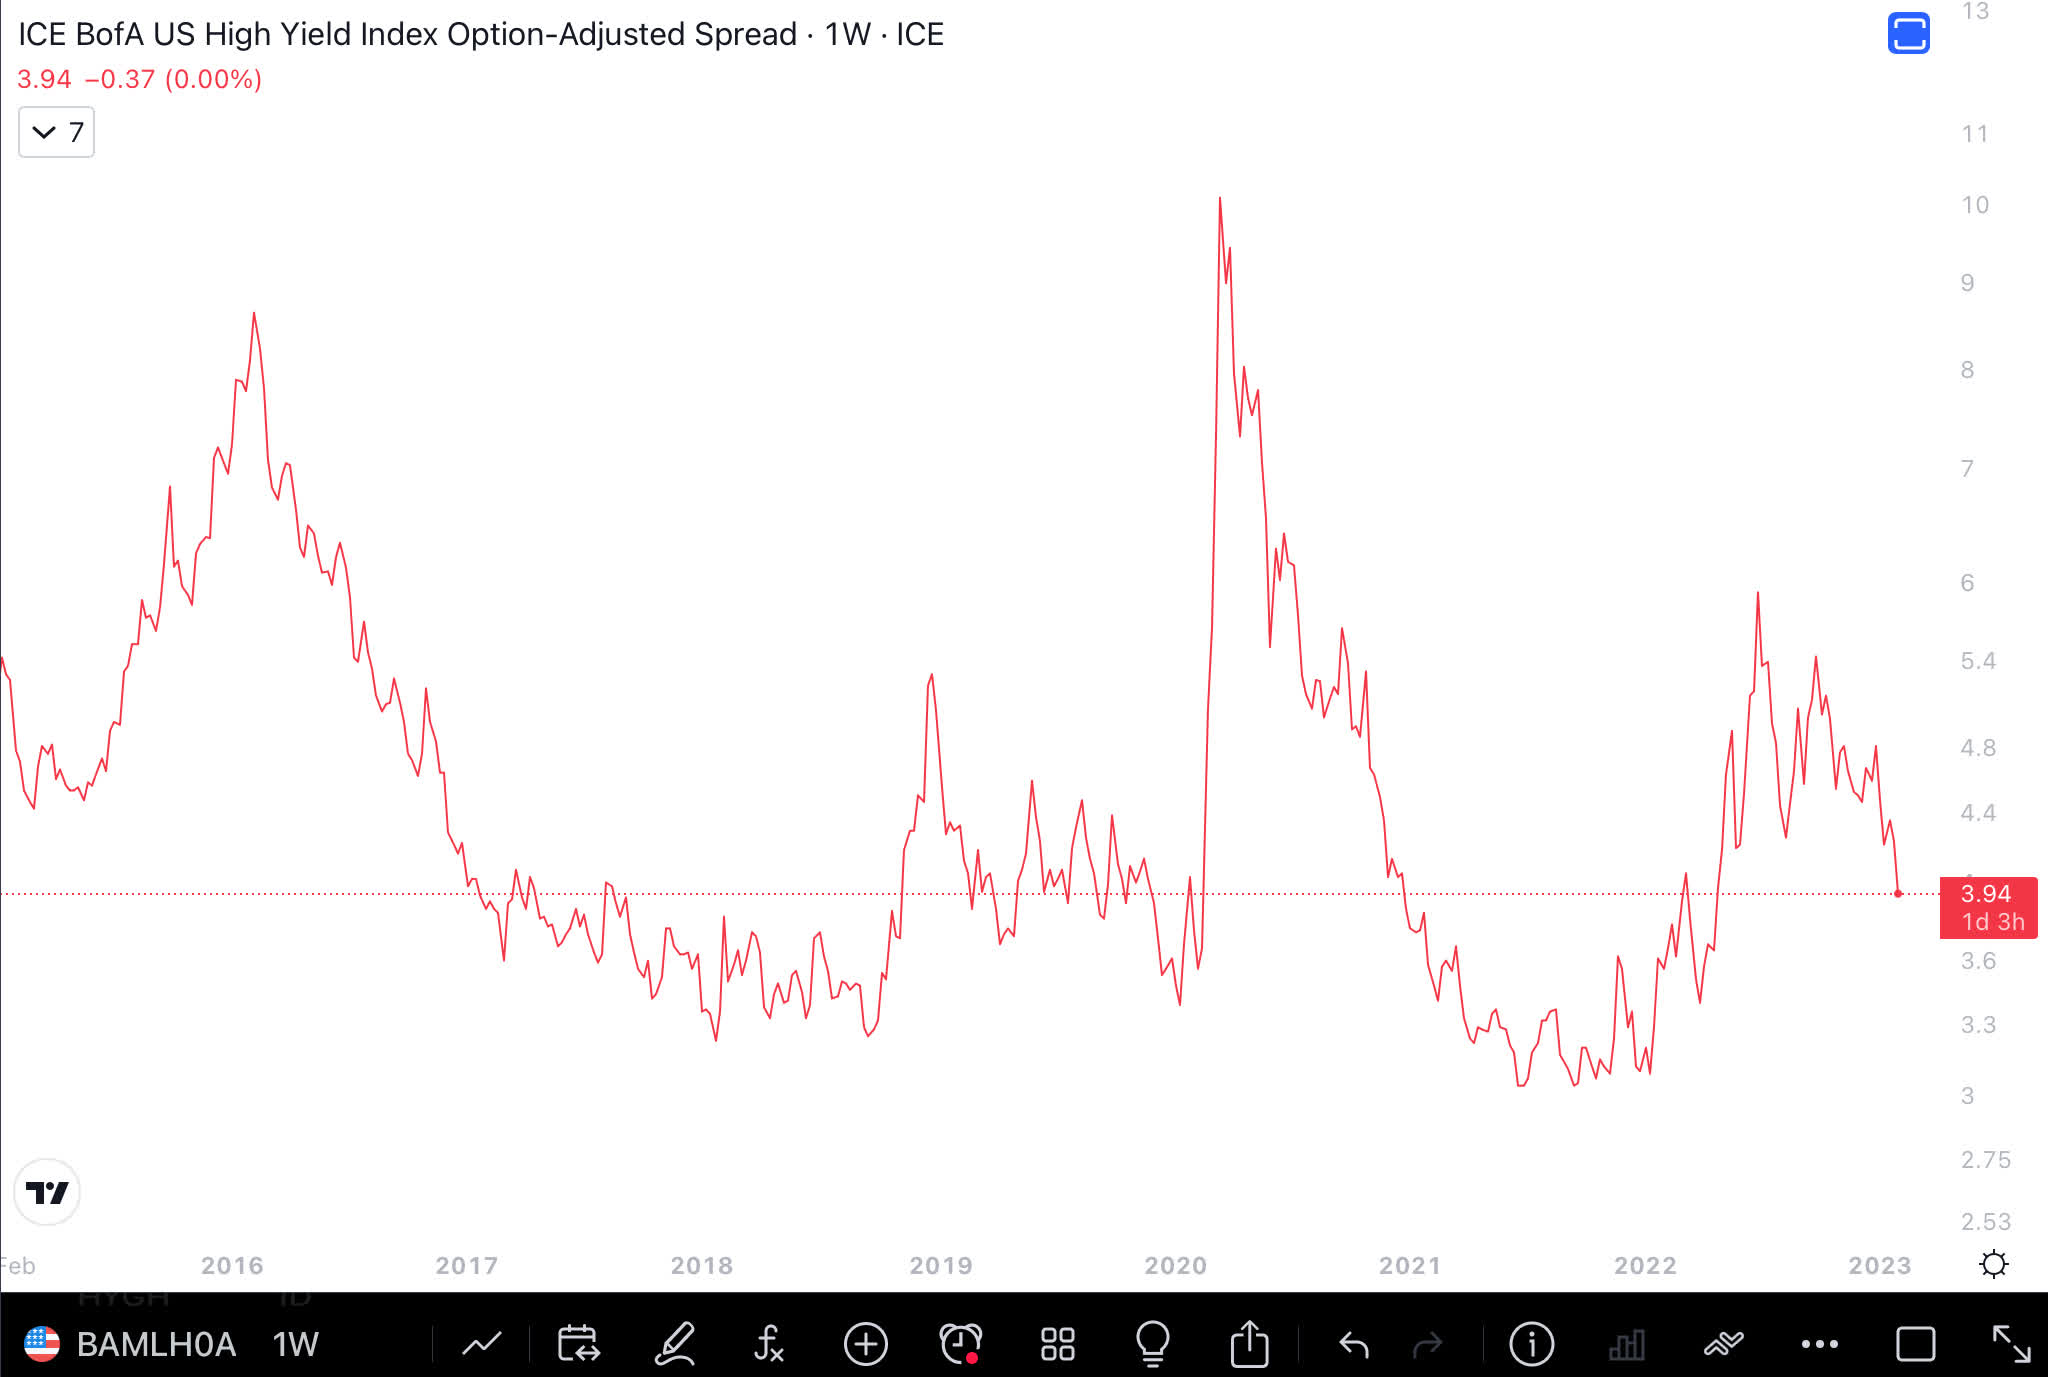
U.S. High Yield Index (Option Adjusted) Spread has been falling steadily and is making lower highs and lower lows, which is positive for stocks.
Treasuries and Corporate Bonds Ratio
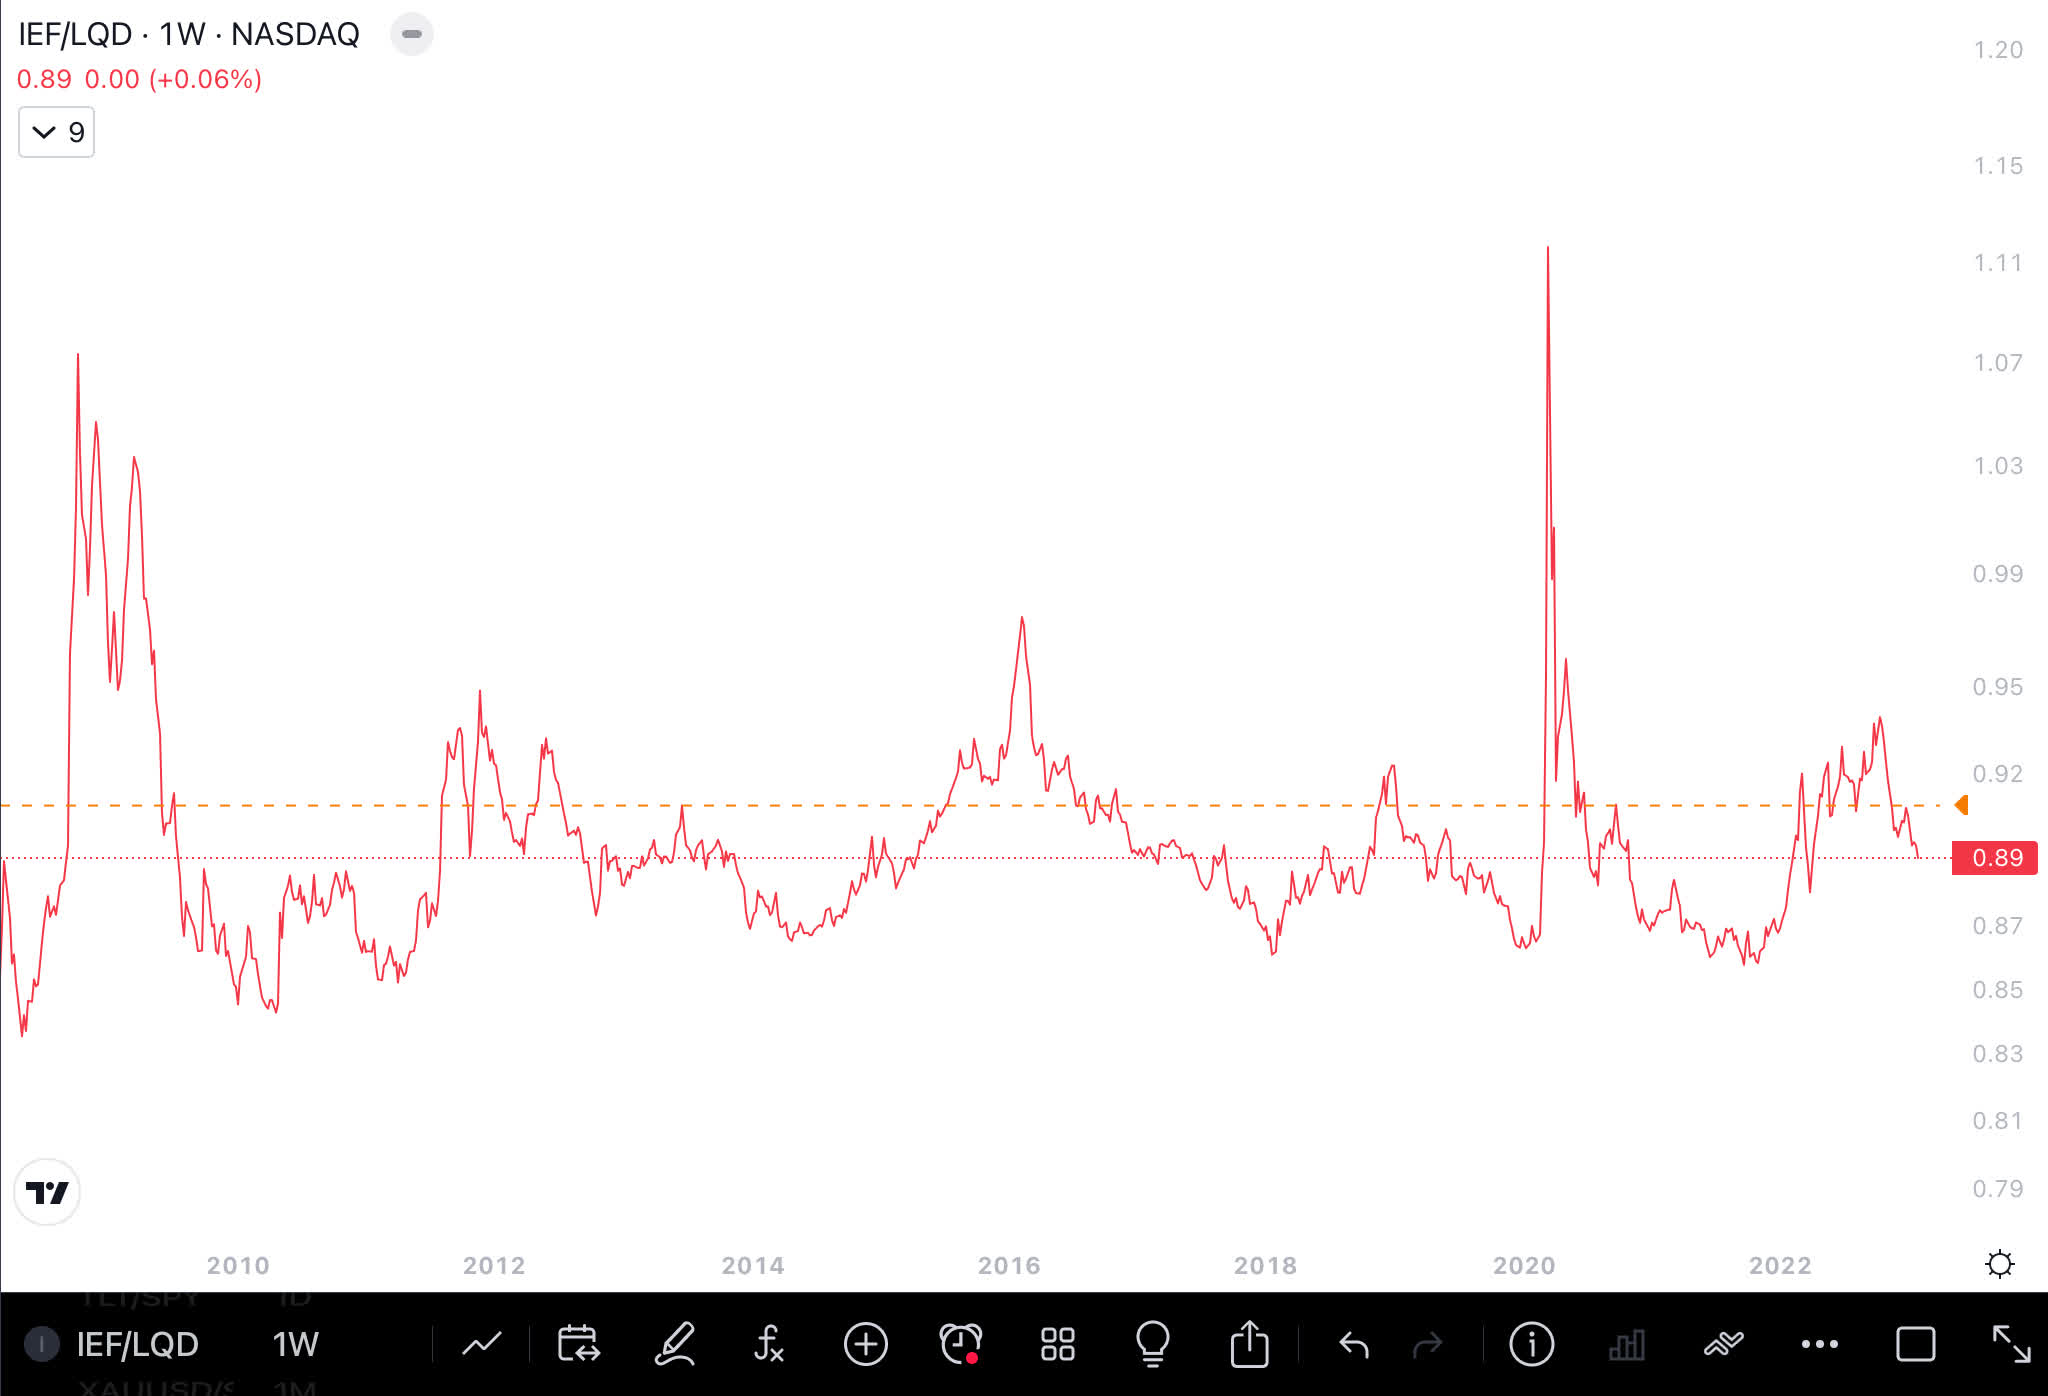
The ratio of treasuries ( IEF ) to investment grade corporate bonds ( LQD ) helps determine risk-on or risk-off environment, as is determined collectively by bond investors. Below is the chart of IEF/LQD, which shows it is moving towards a supportive environment for stock investors.
Commodities
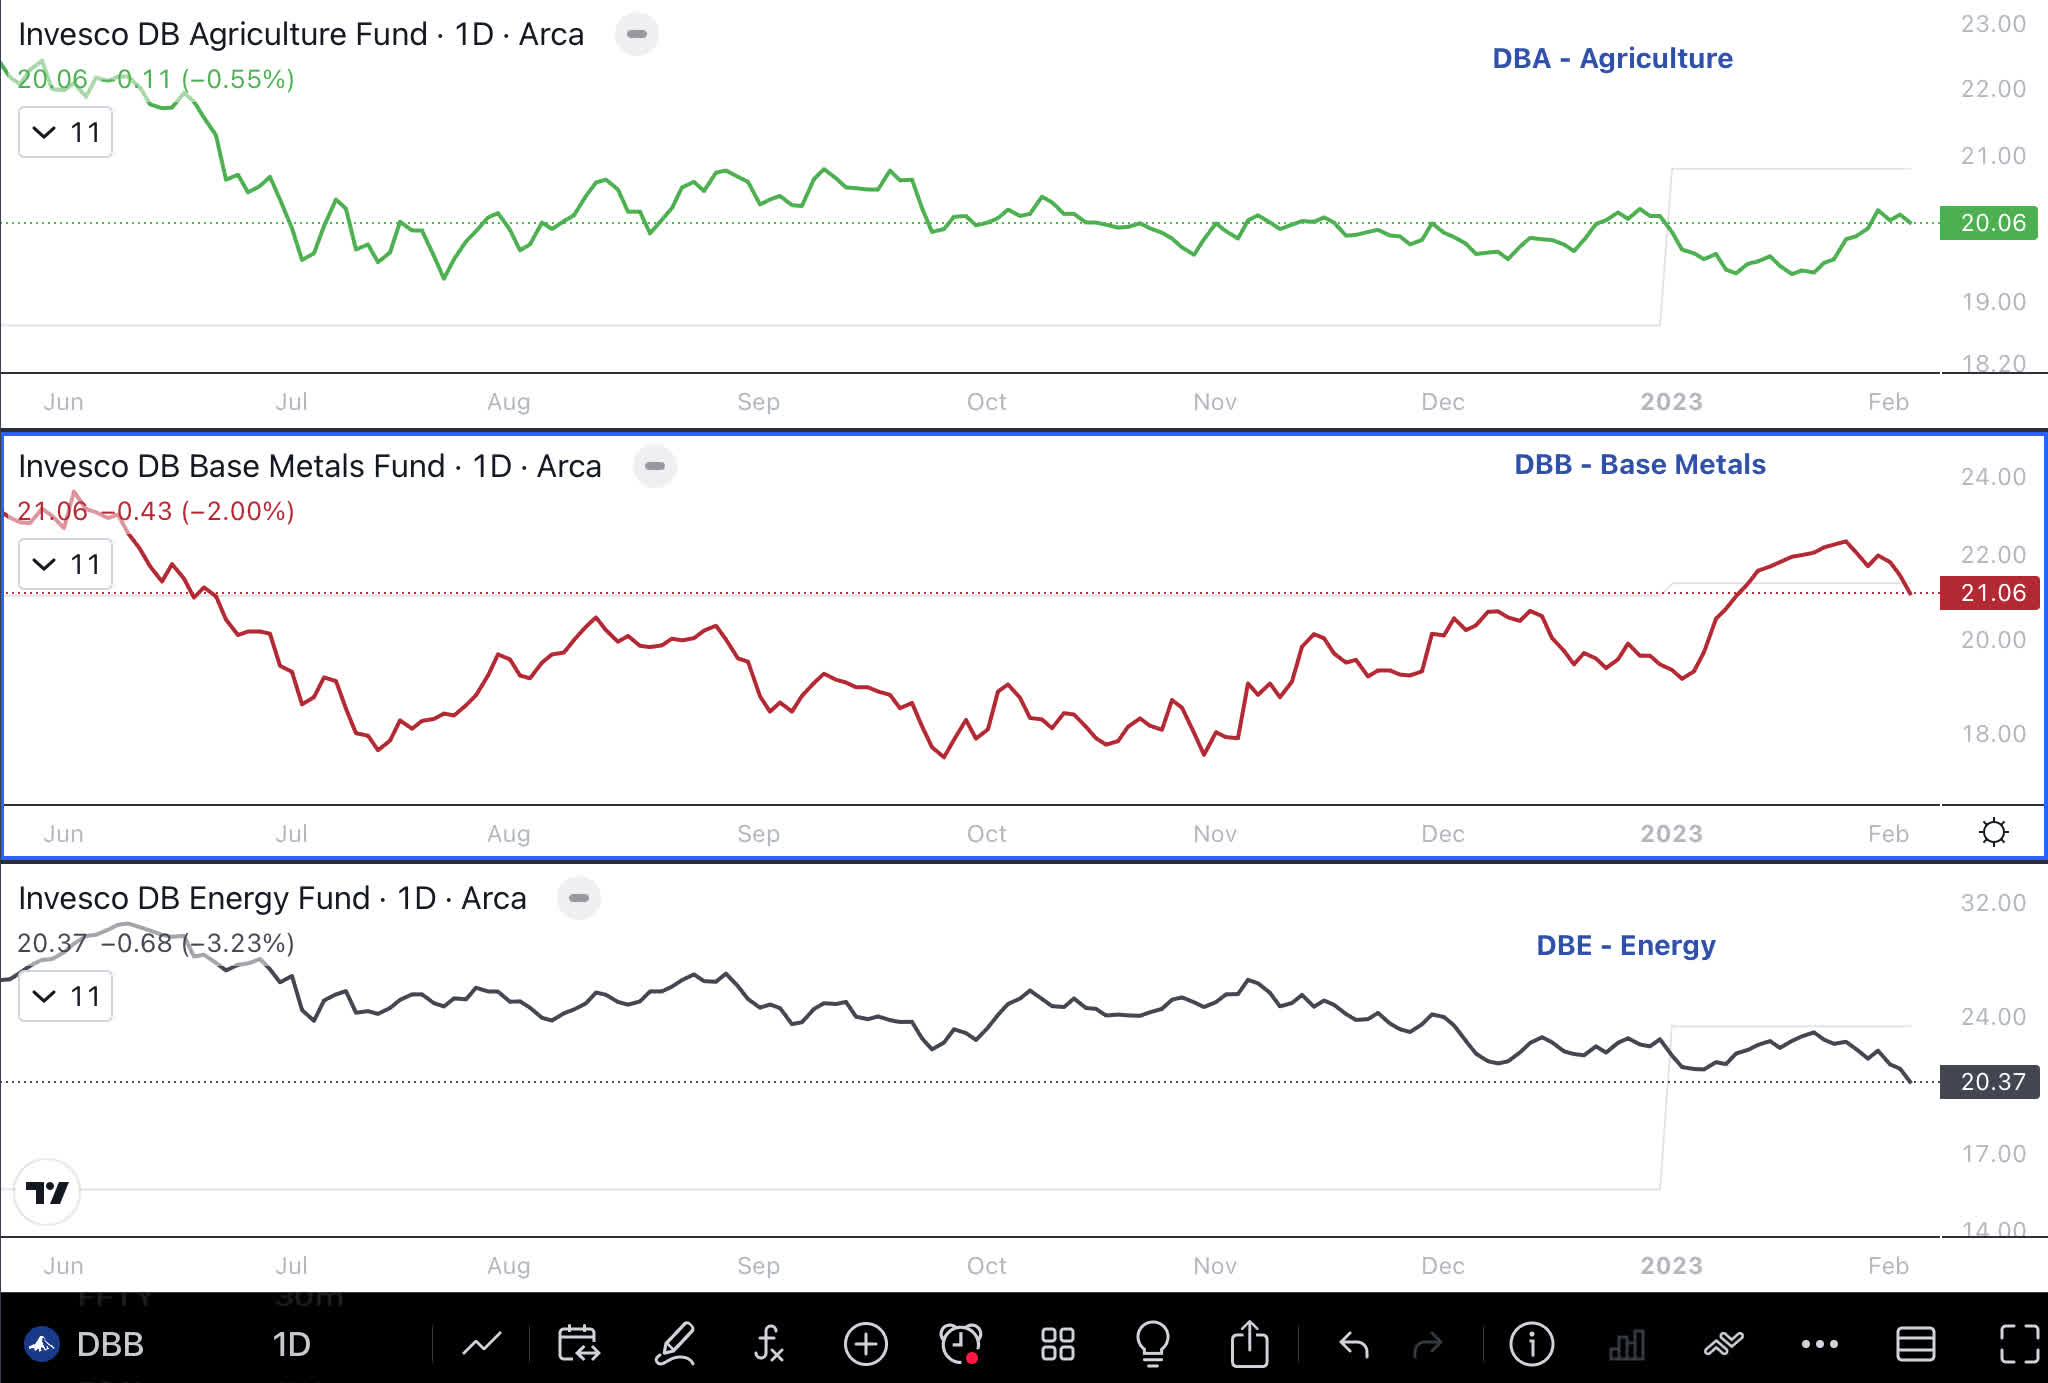
DBA and DBC which track agriculture and energy commodities are trending lower. DBB which tracks base metals has moved higher possibly due to China reopening after having trended lower. Based on these charts, as long as prices do not move measurably higher, they will help to reduce inflation in coming months.
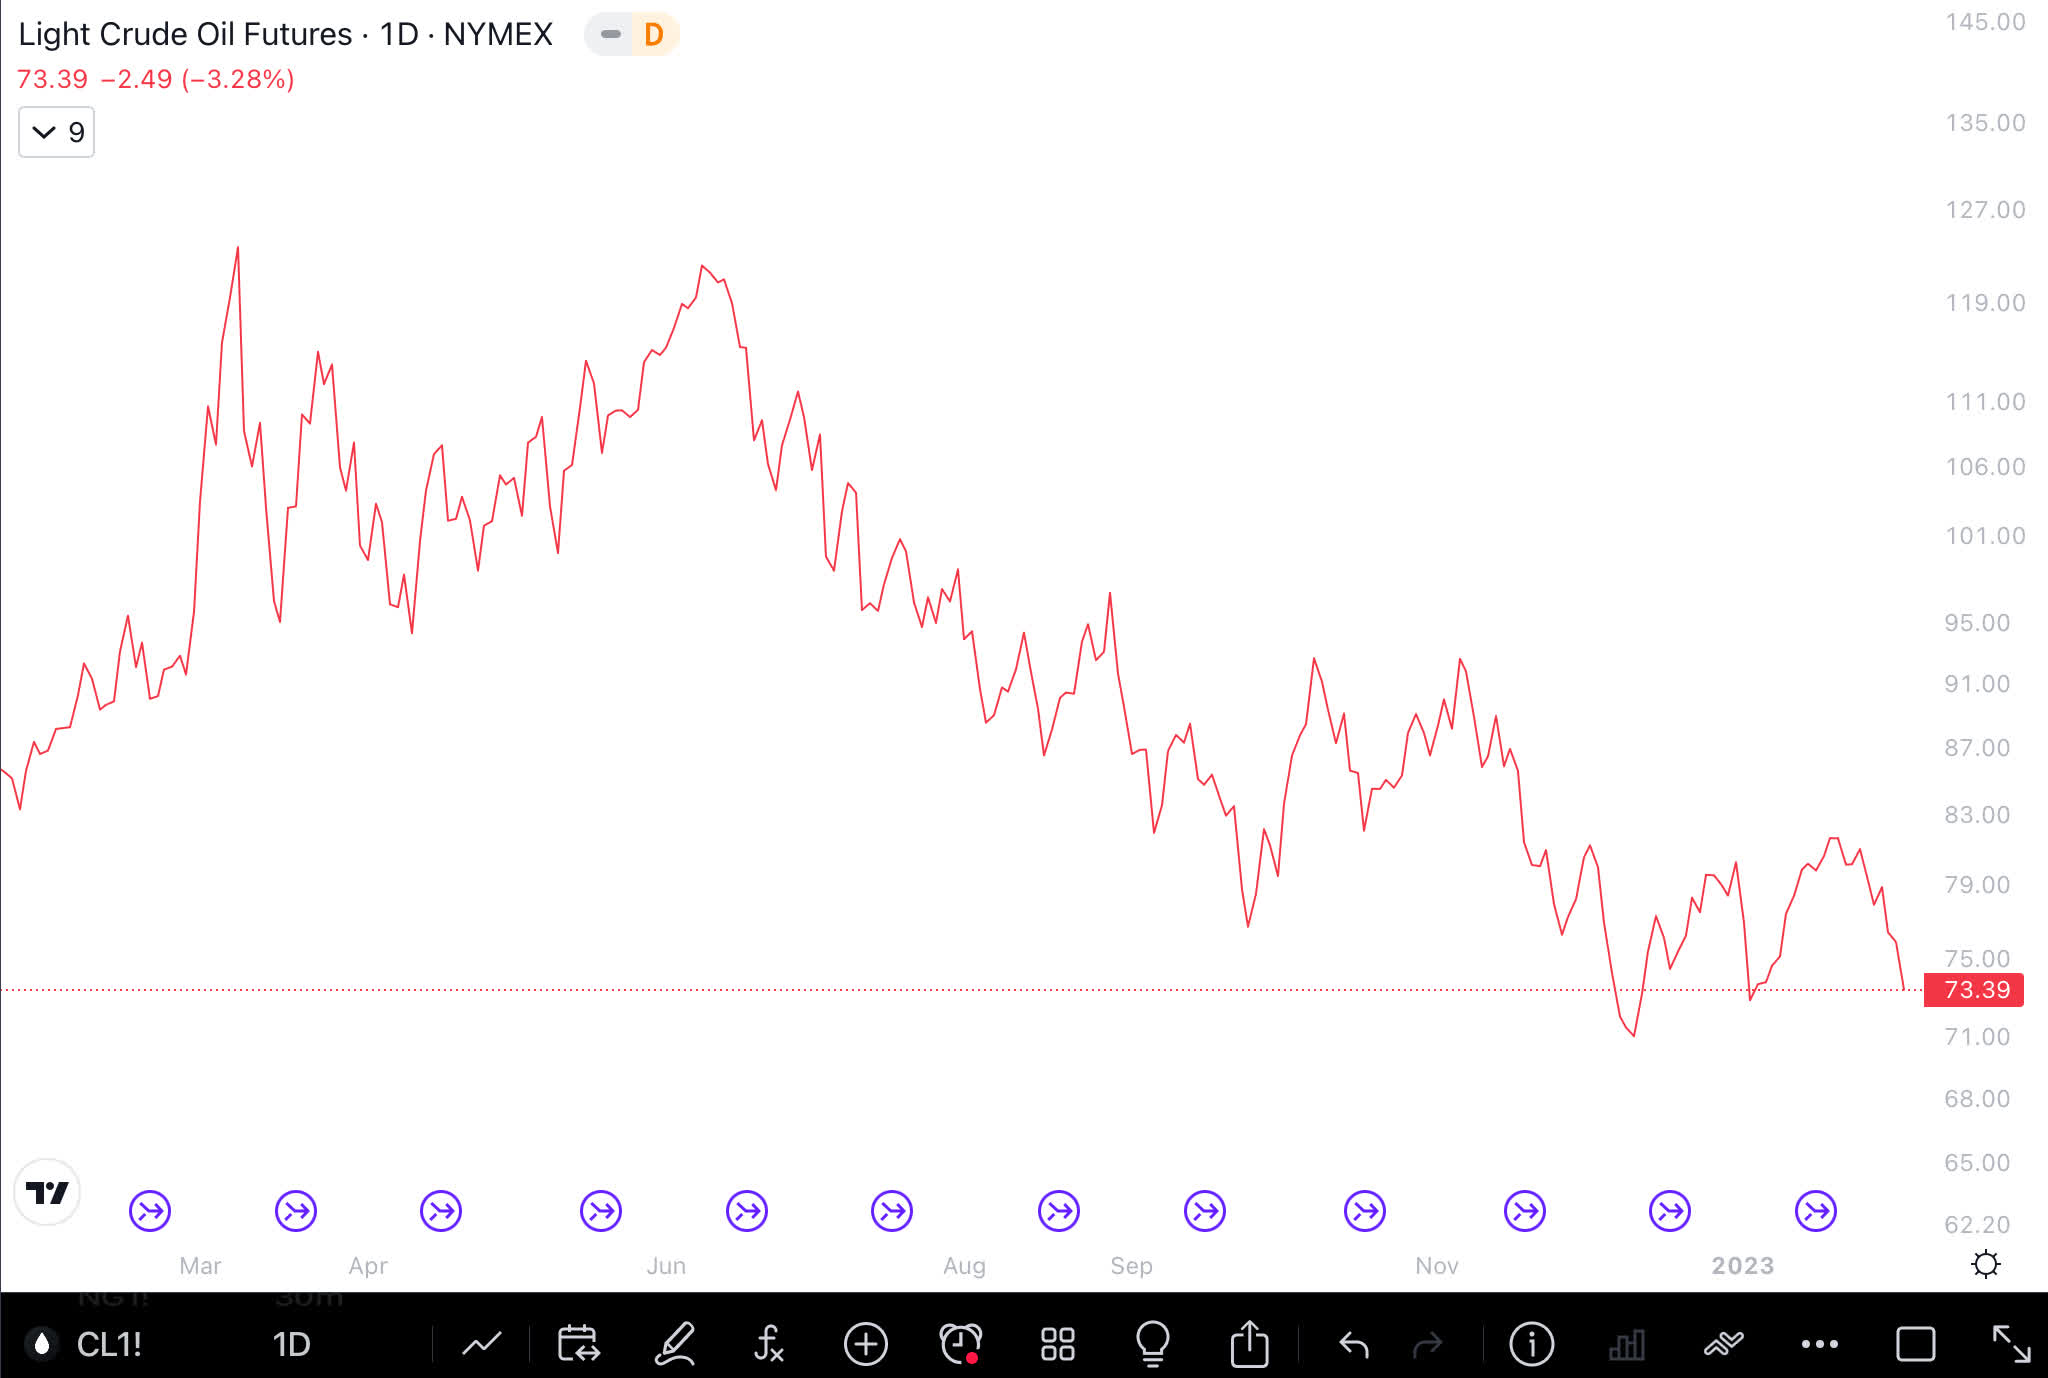
Crude Oil, which is closely followed by the market has gone down and is on the verge of breaking down. While it reduces inflation and is a boost to the consumer in their ability to spend, it could also indicate a slowing global economy.
U.S. Dollar Index
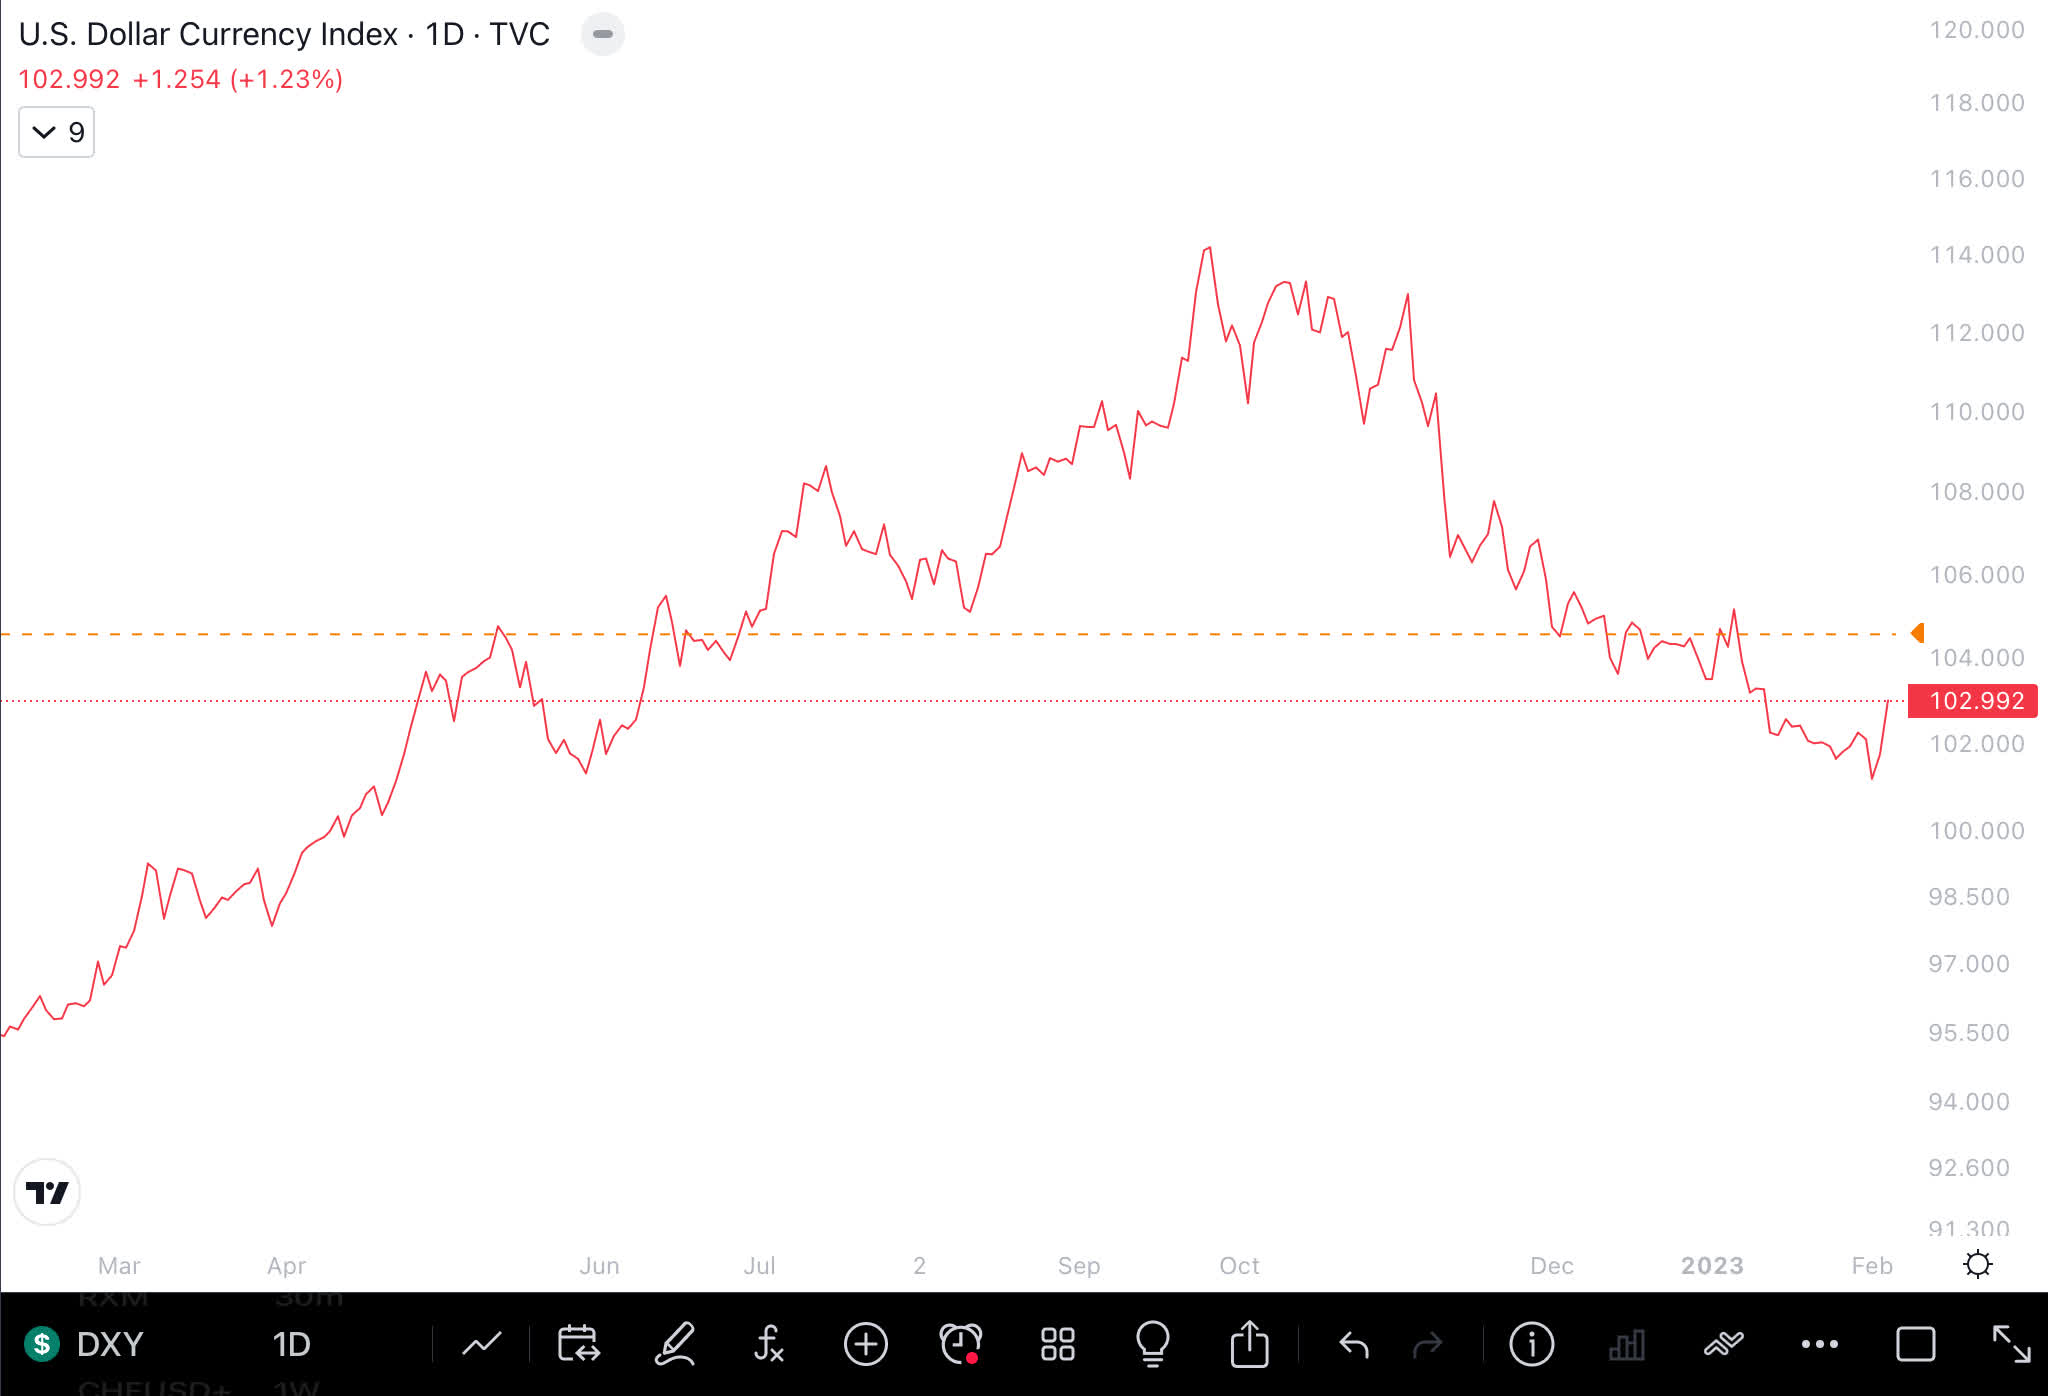
The U.S. Dollar index ( DXY ) has pulled back after topping at 114.8 and has dropped down to 102. The falling dollar index is supportive for stocks and makes U.S. exports more competitive.
Stock Market
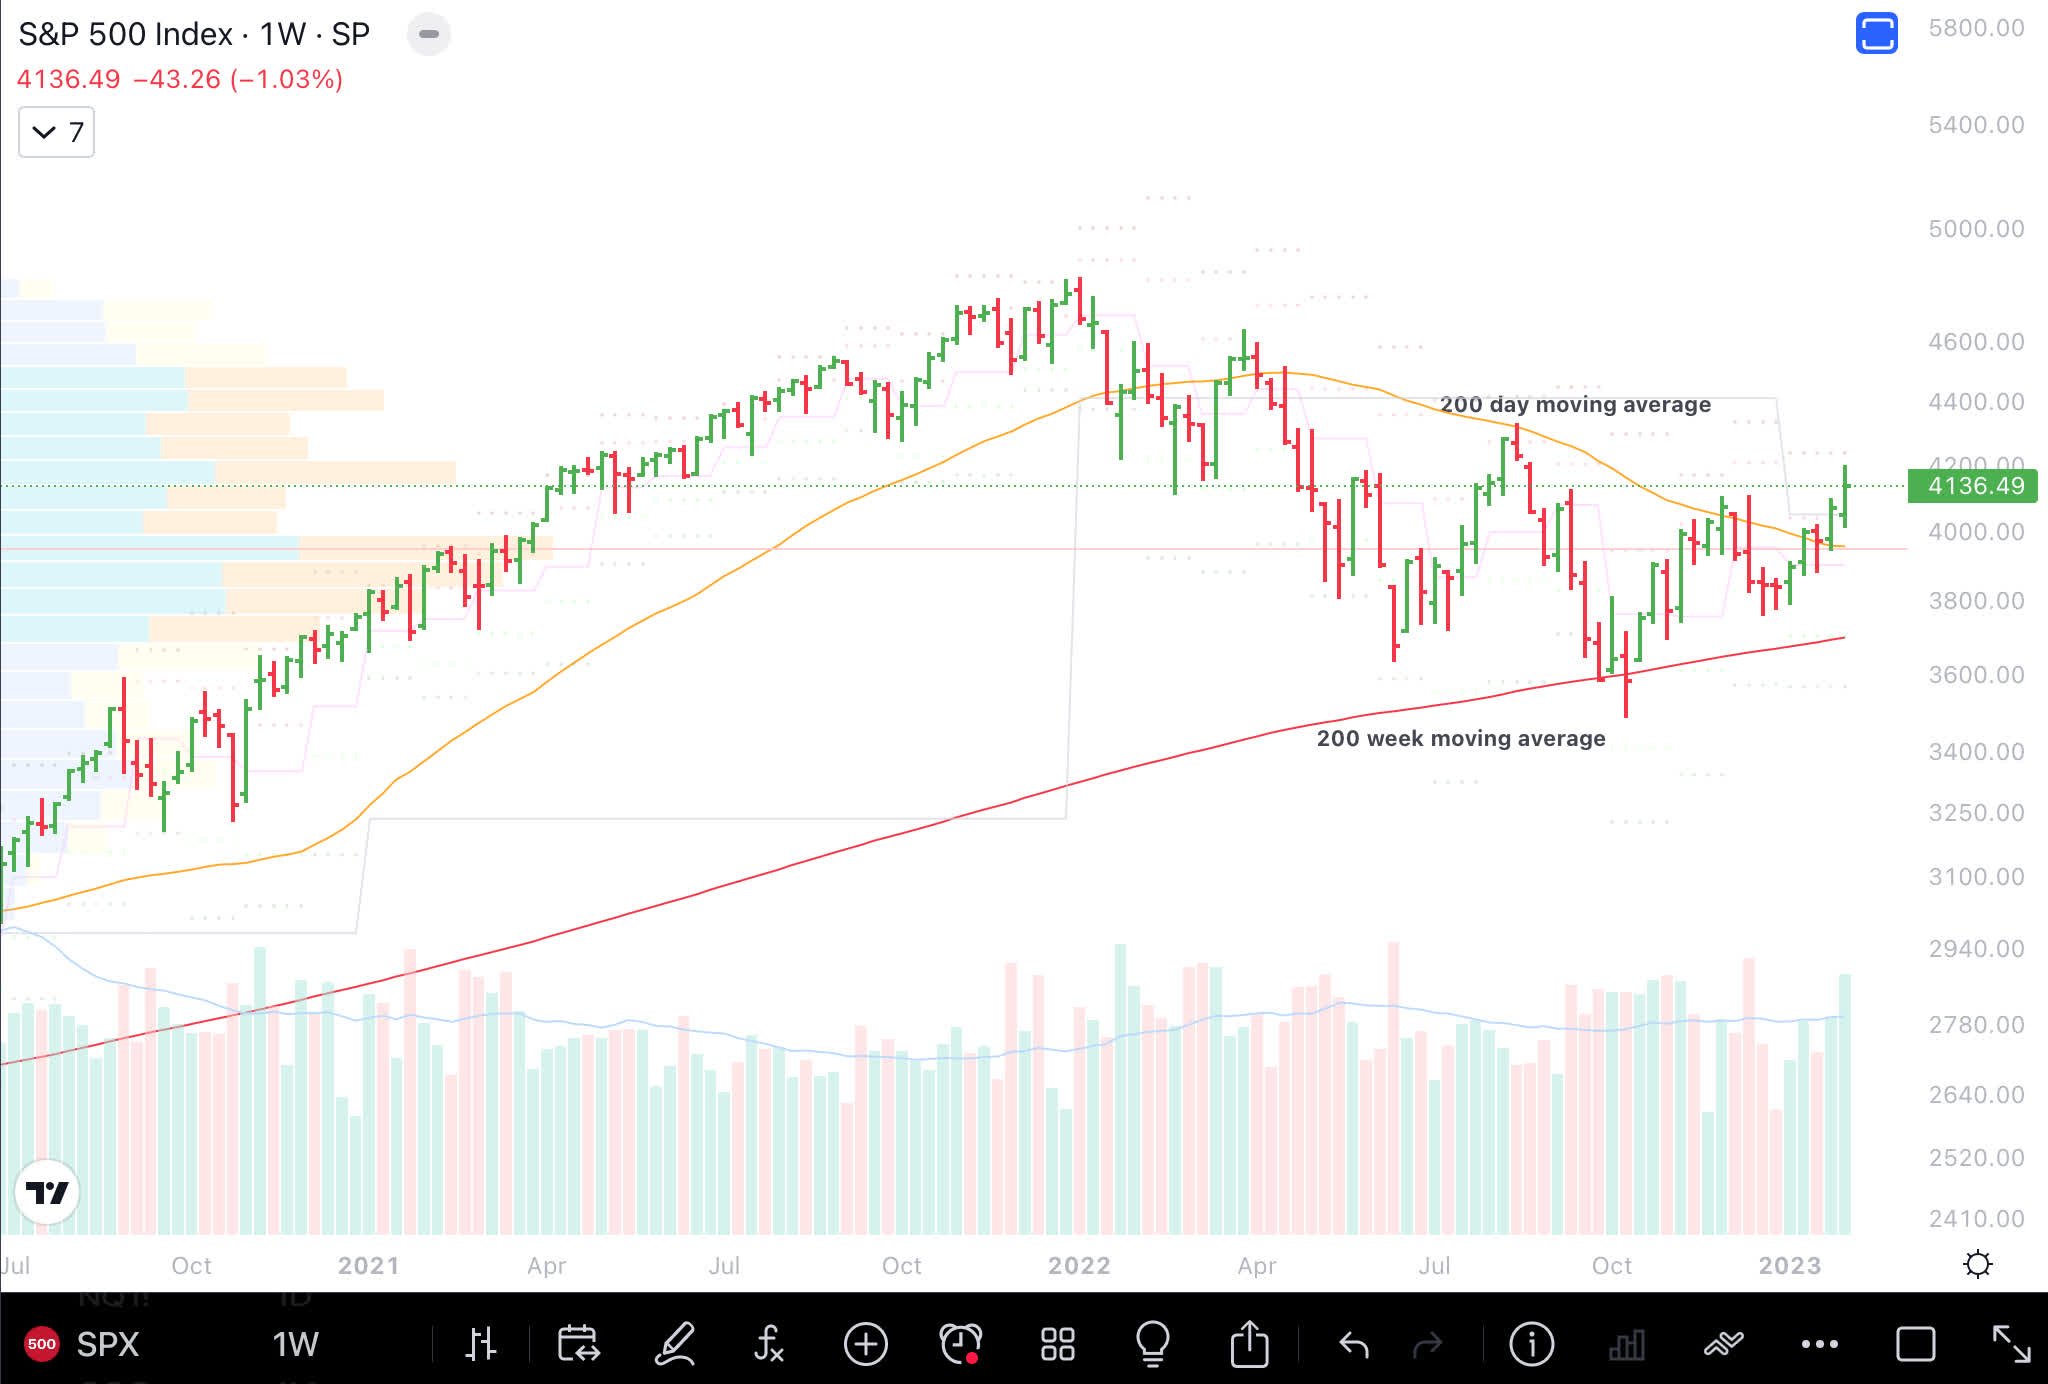
The weekly chart of the S&P 500 continues to trend down, but for the past 6 months it has been going sideways. For the uptrend to resume, the SP500 needs to close and stay above 4050 and close above the cloud. If that were to happen, then it would be the first step toward starting an uptrend. The charts below show prices, the 200 day moving average, and the 200 week moving average besides volume.
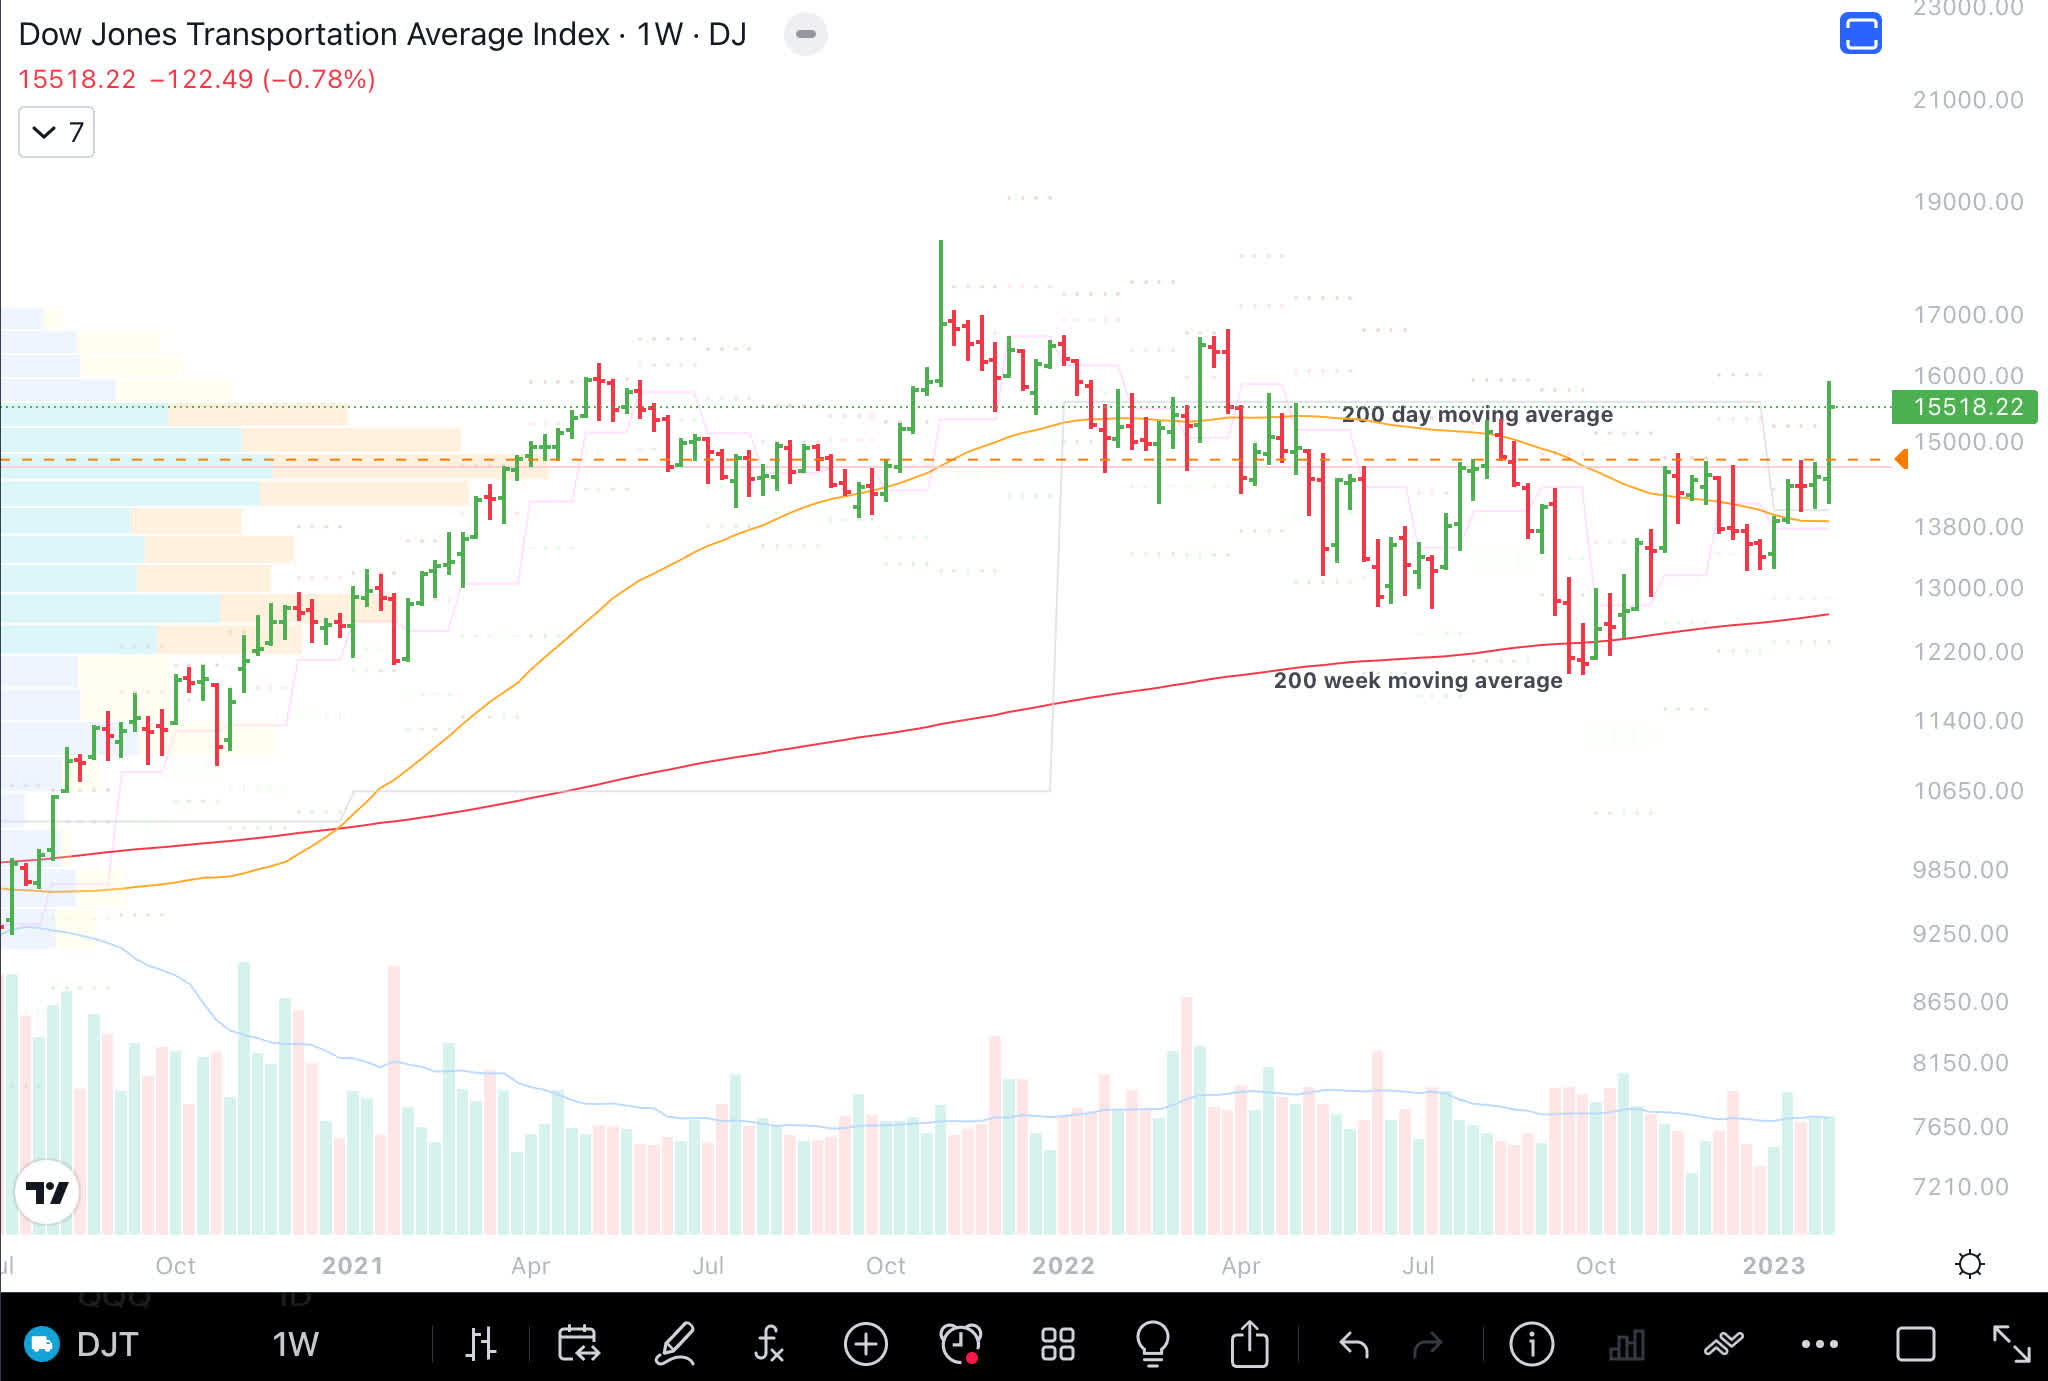
Dow Transportation Average (DJT) has exhibited strength, which is a positive for the stock markets.
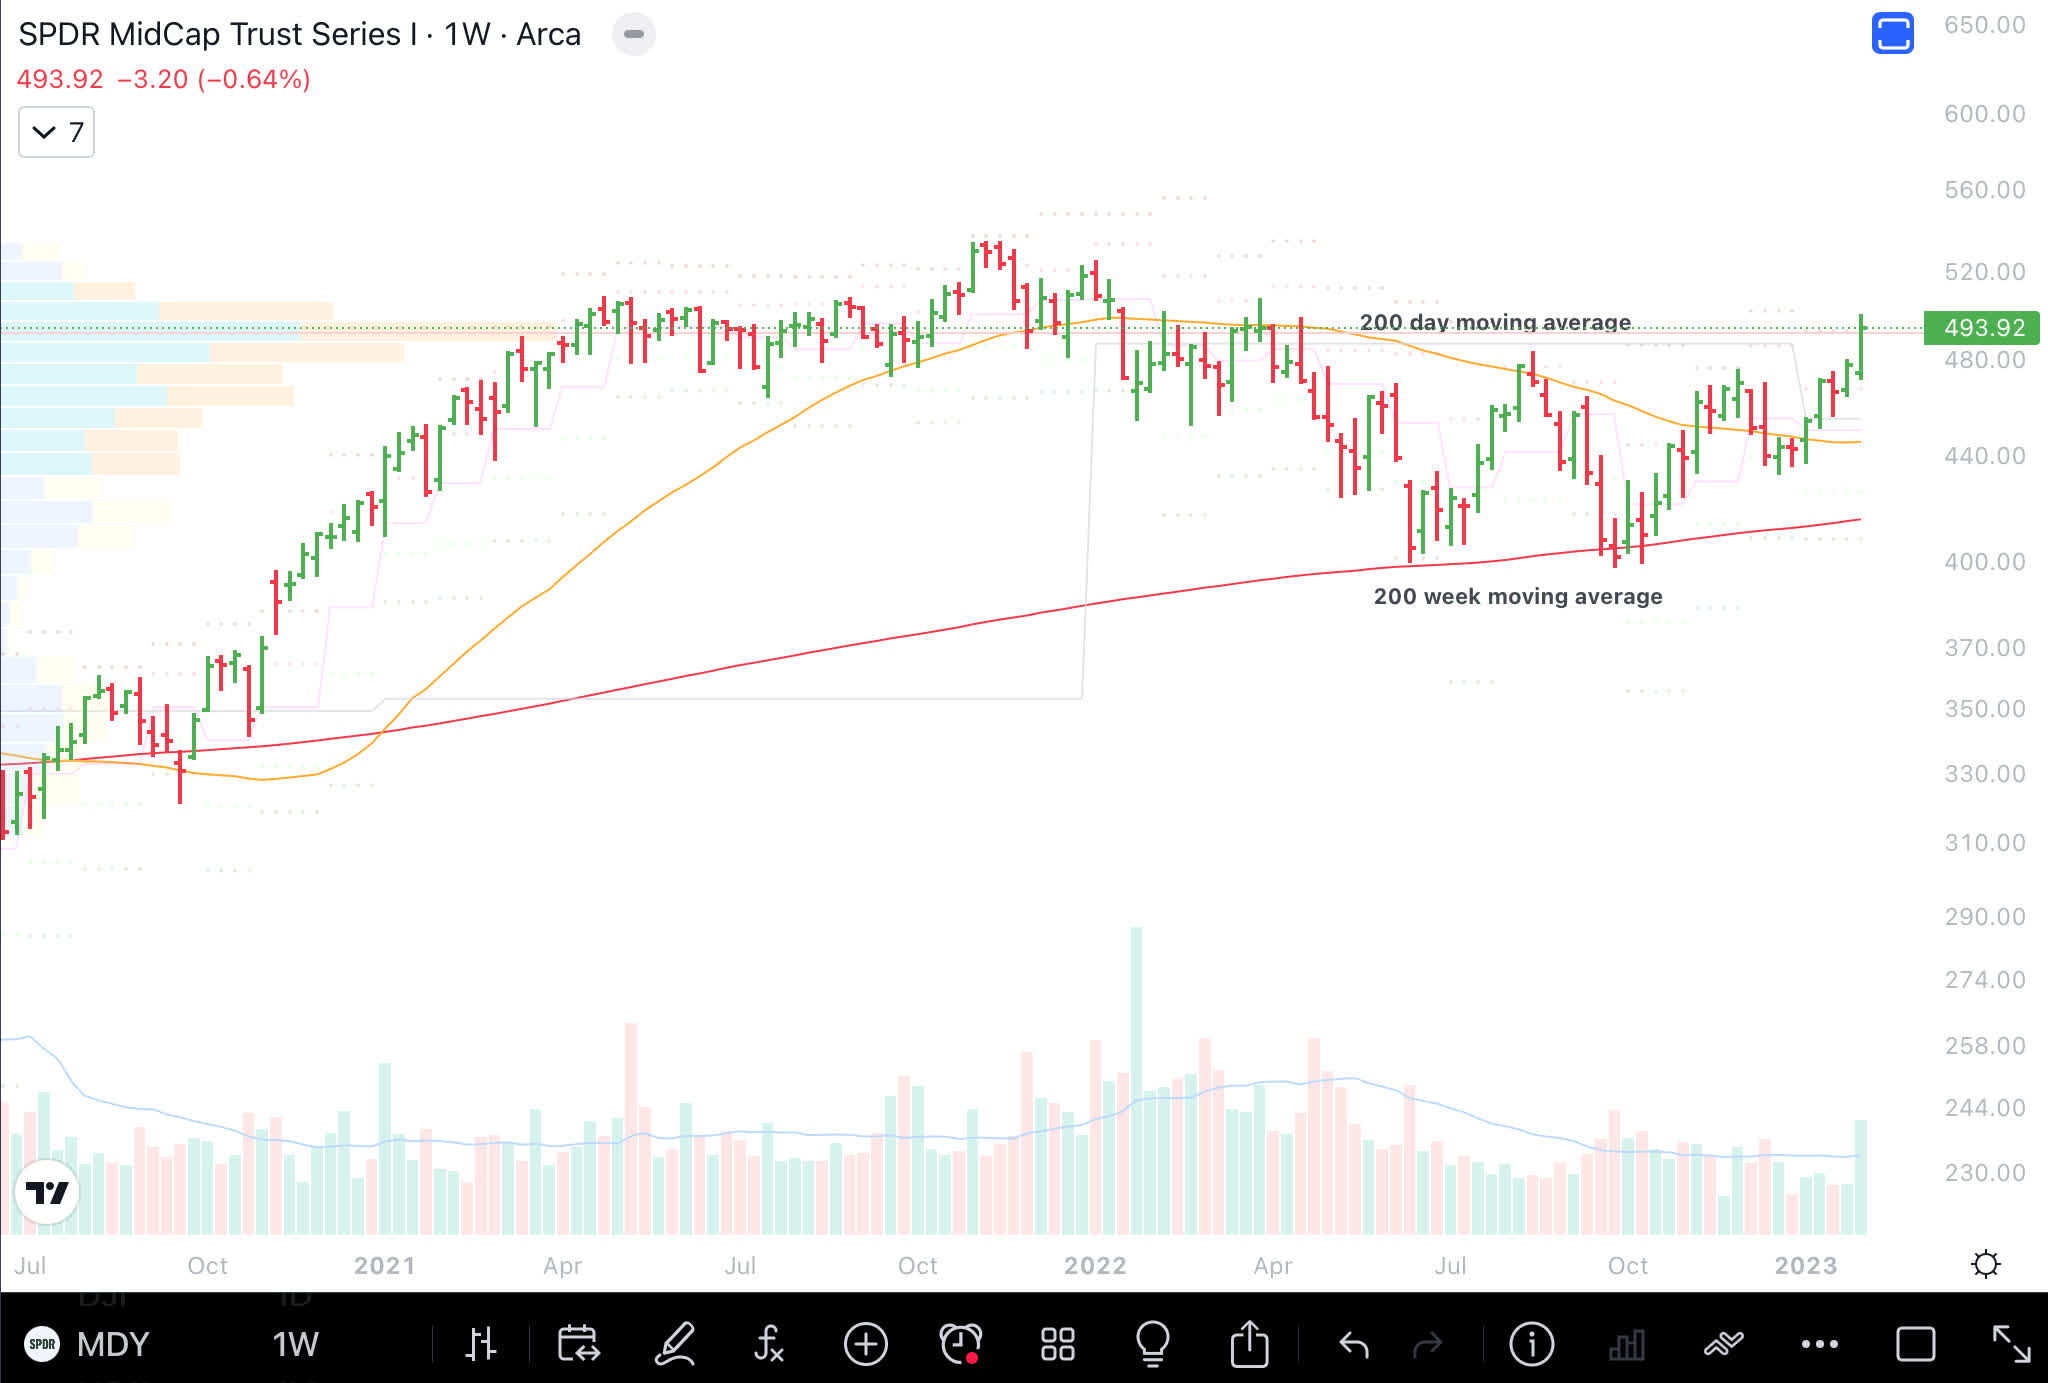
Mid-cap Index (MDY) has been one of the stronger indices.
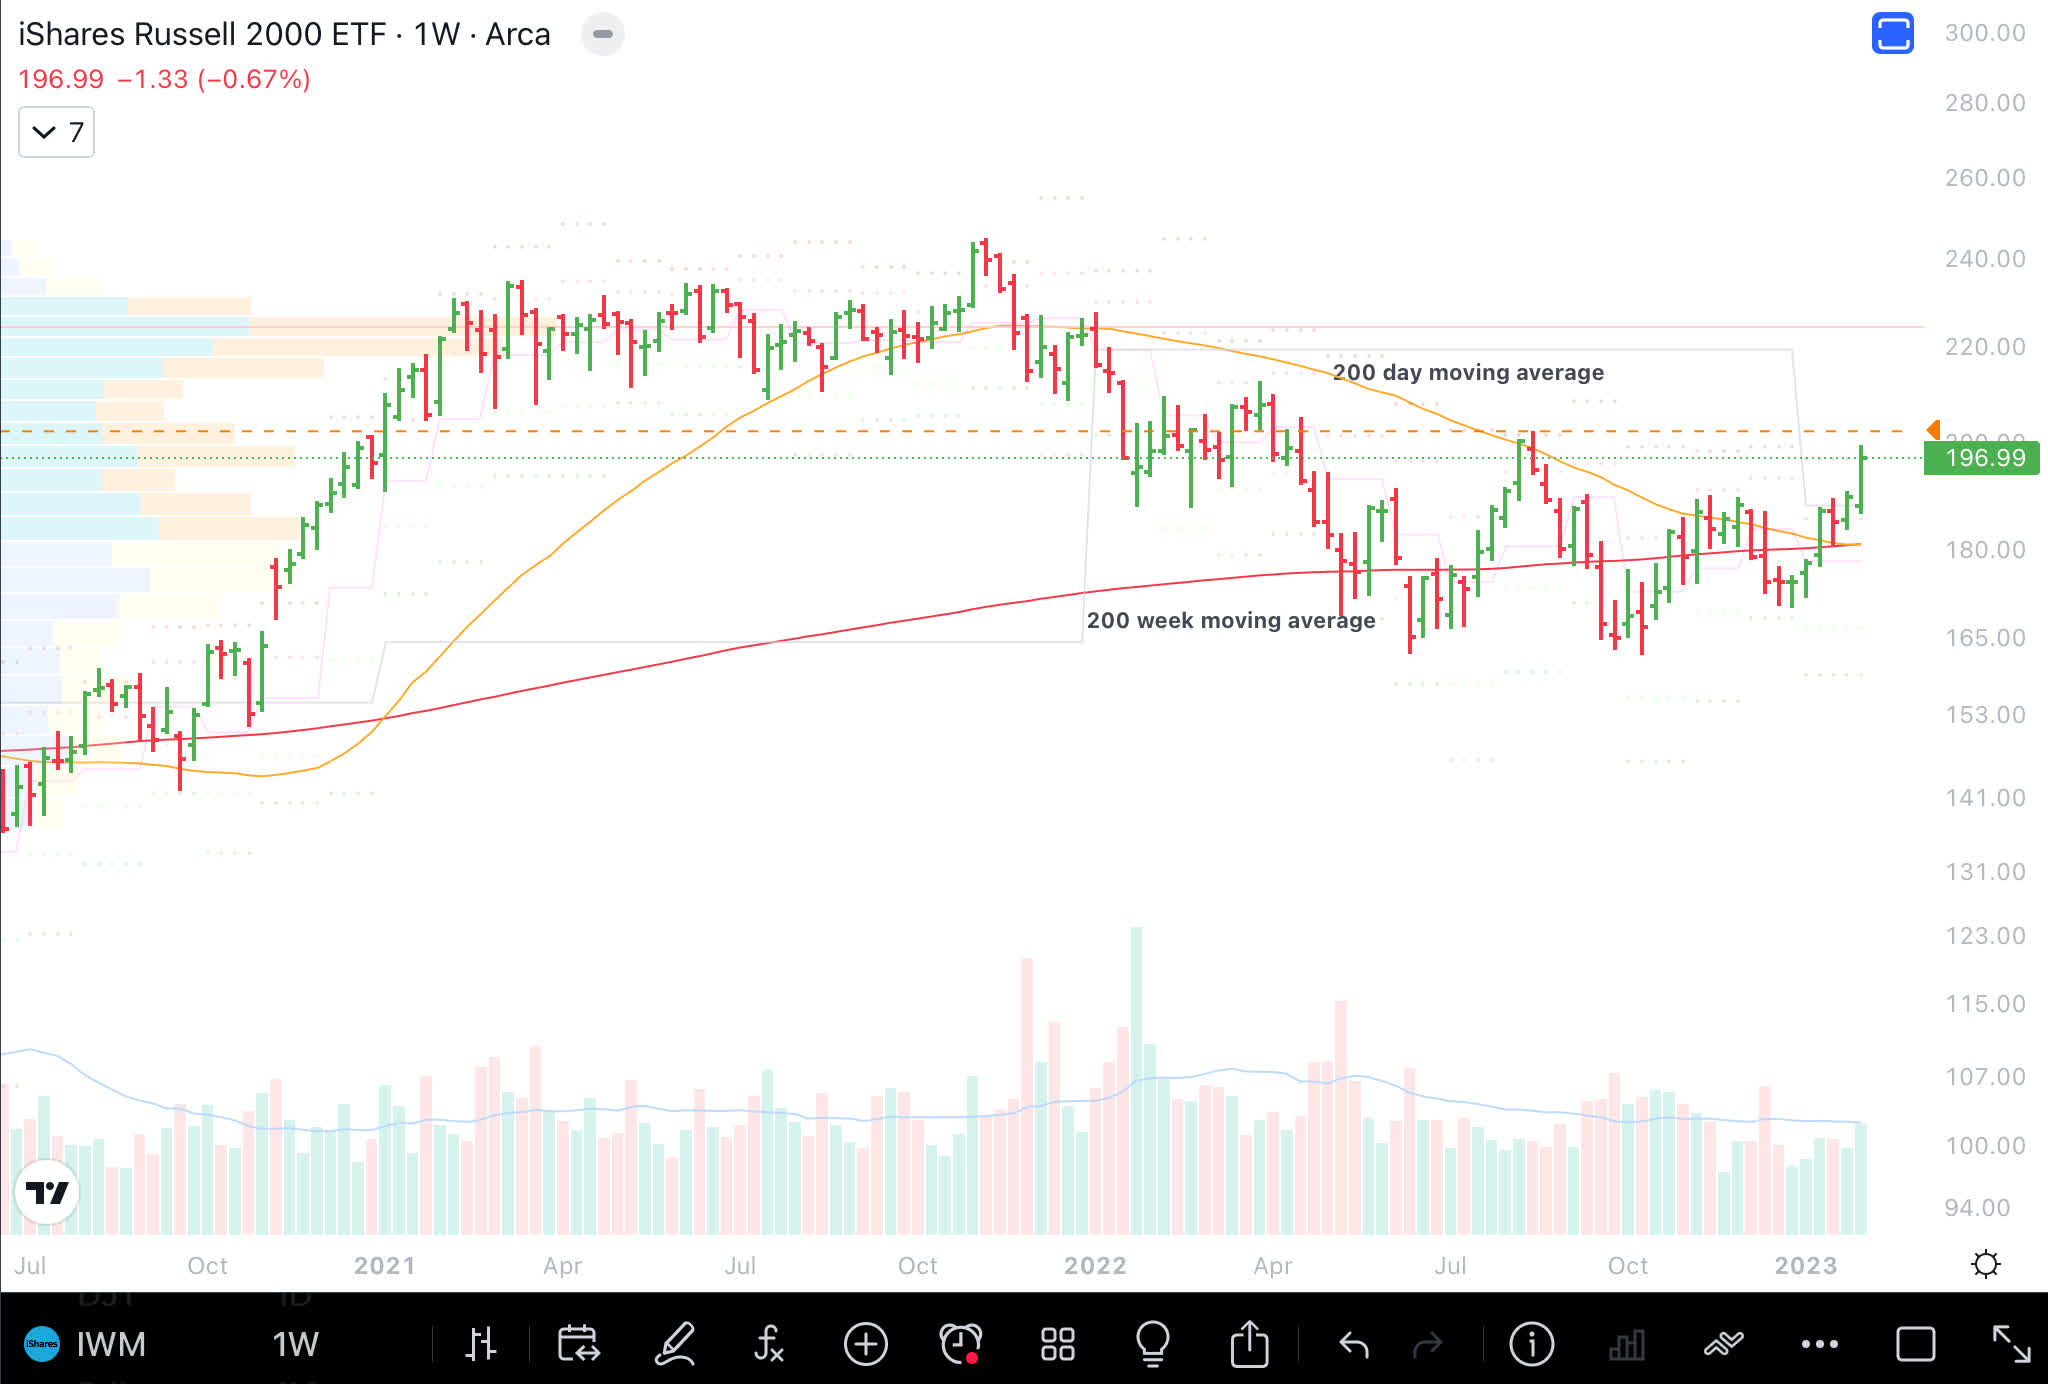
Small-cap (IWM), which represents the Russell 2000 indices, are showing promise. They should be leading and that is a concern.
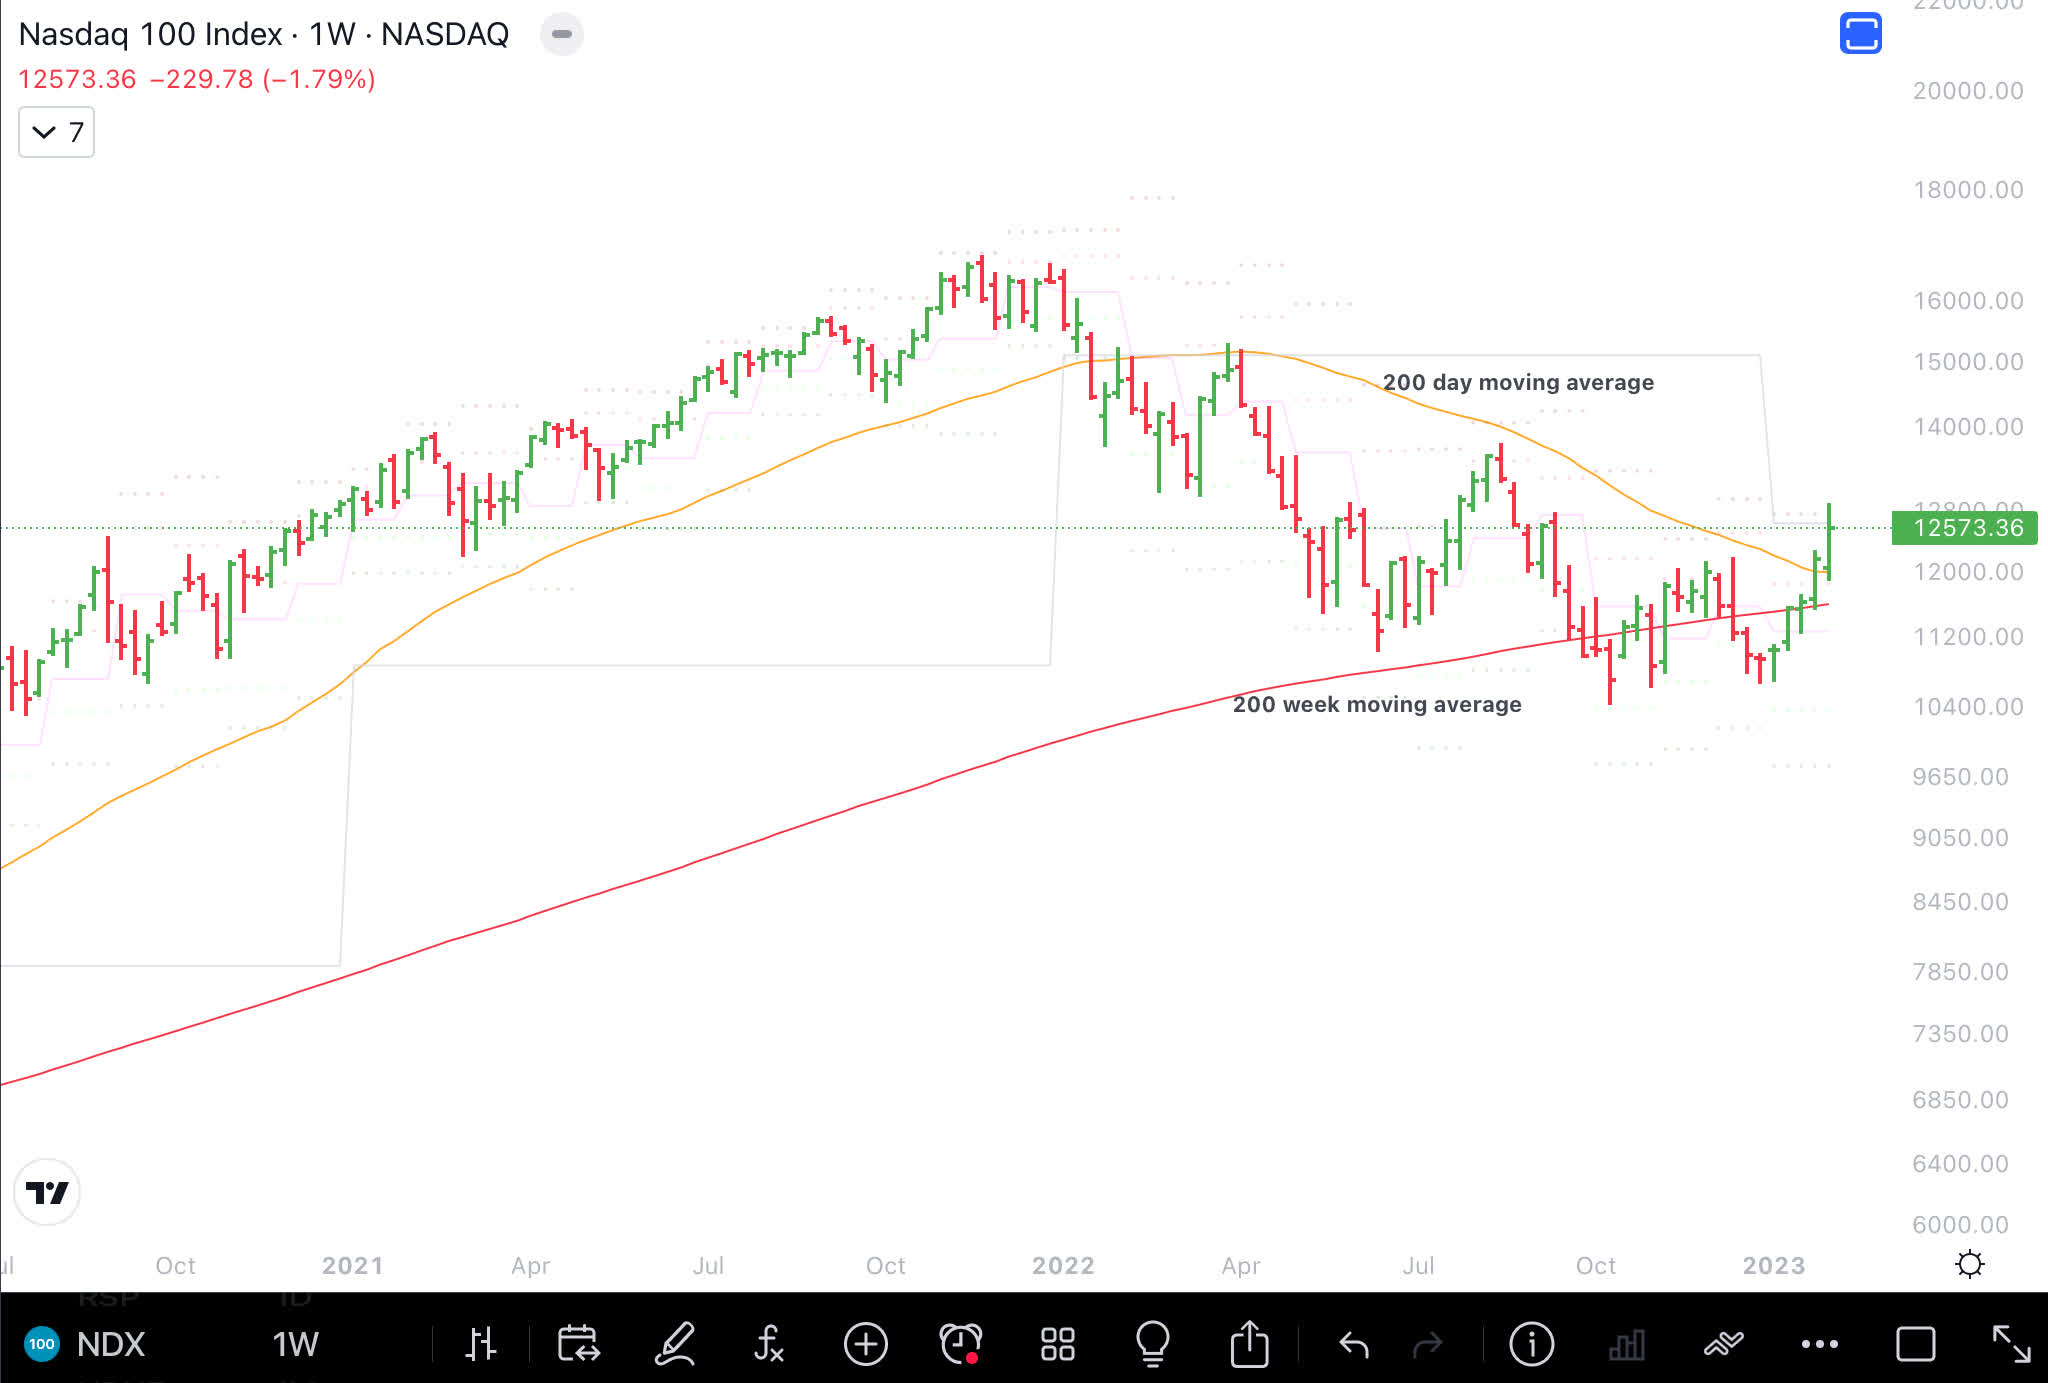
NASDAQ 100 (NDX) is finally showing signs of a turnaround.
Semi-conductor index (SMH) is stronger than the NDX, which is a positive.
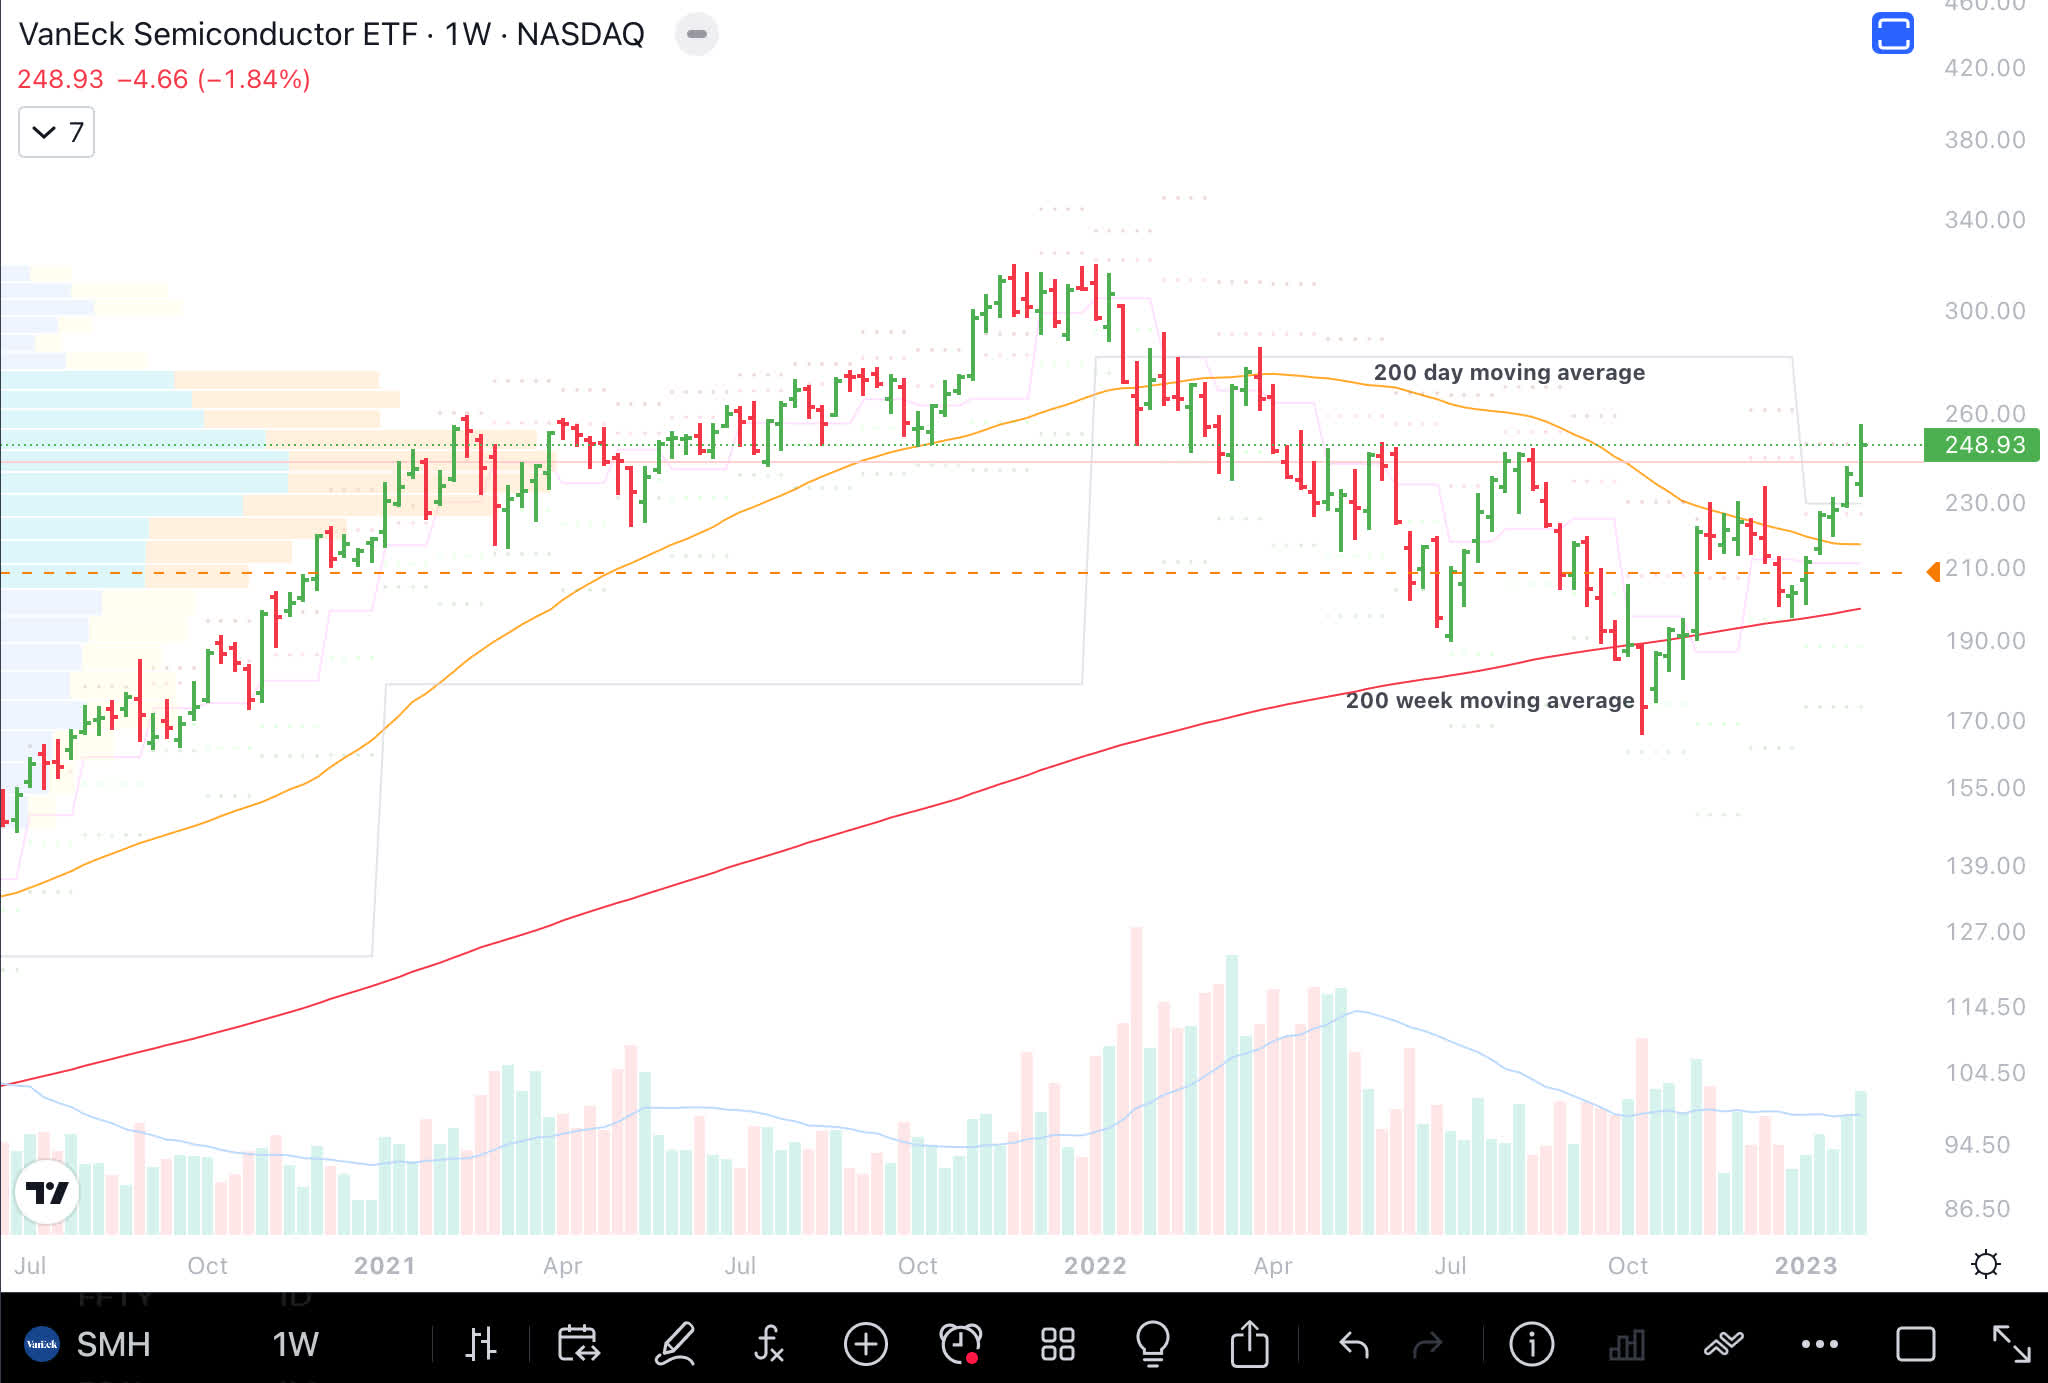
Equal Weighted Index
Equal weight S&P 500 (RSP) has been leading SP500 which indicates a broad based rally.
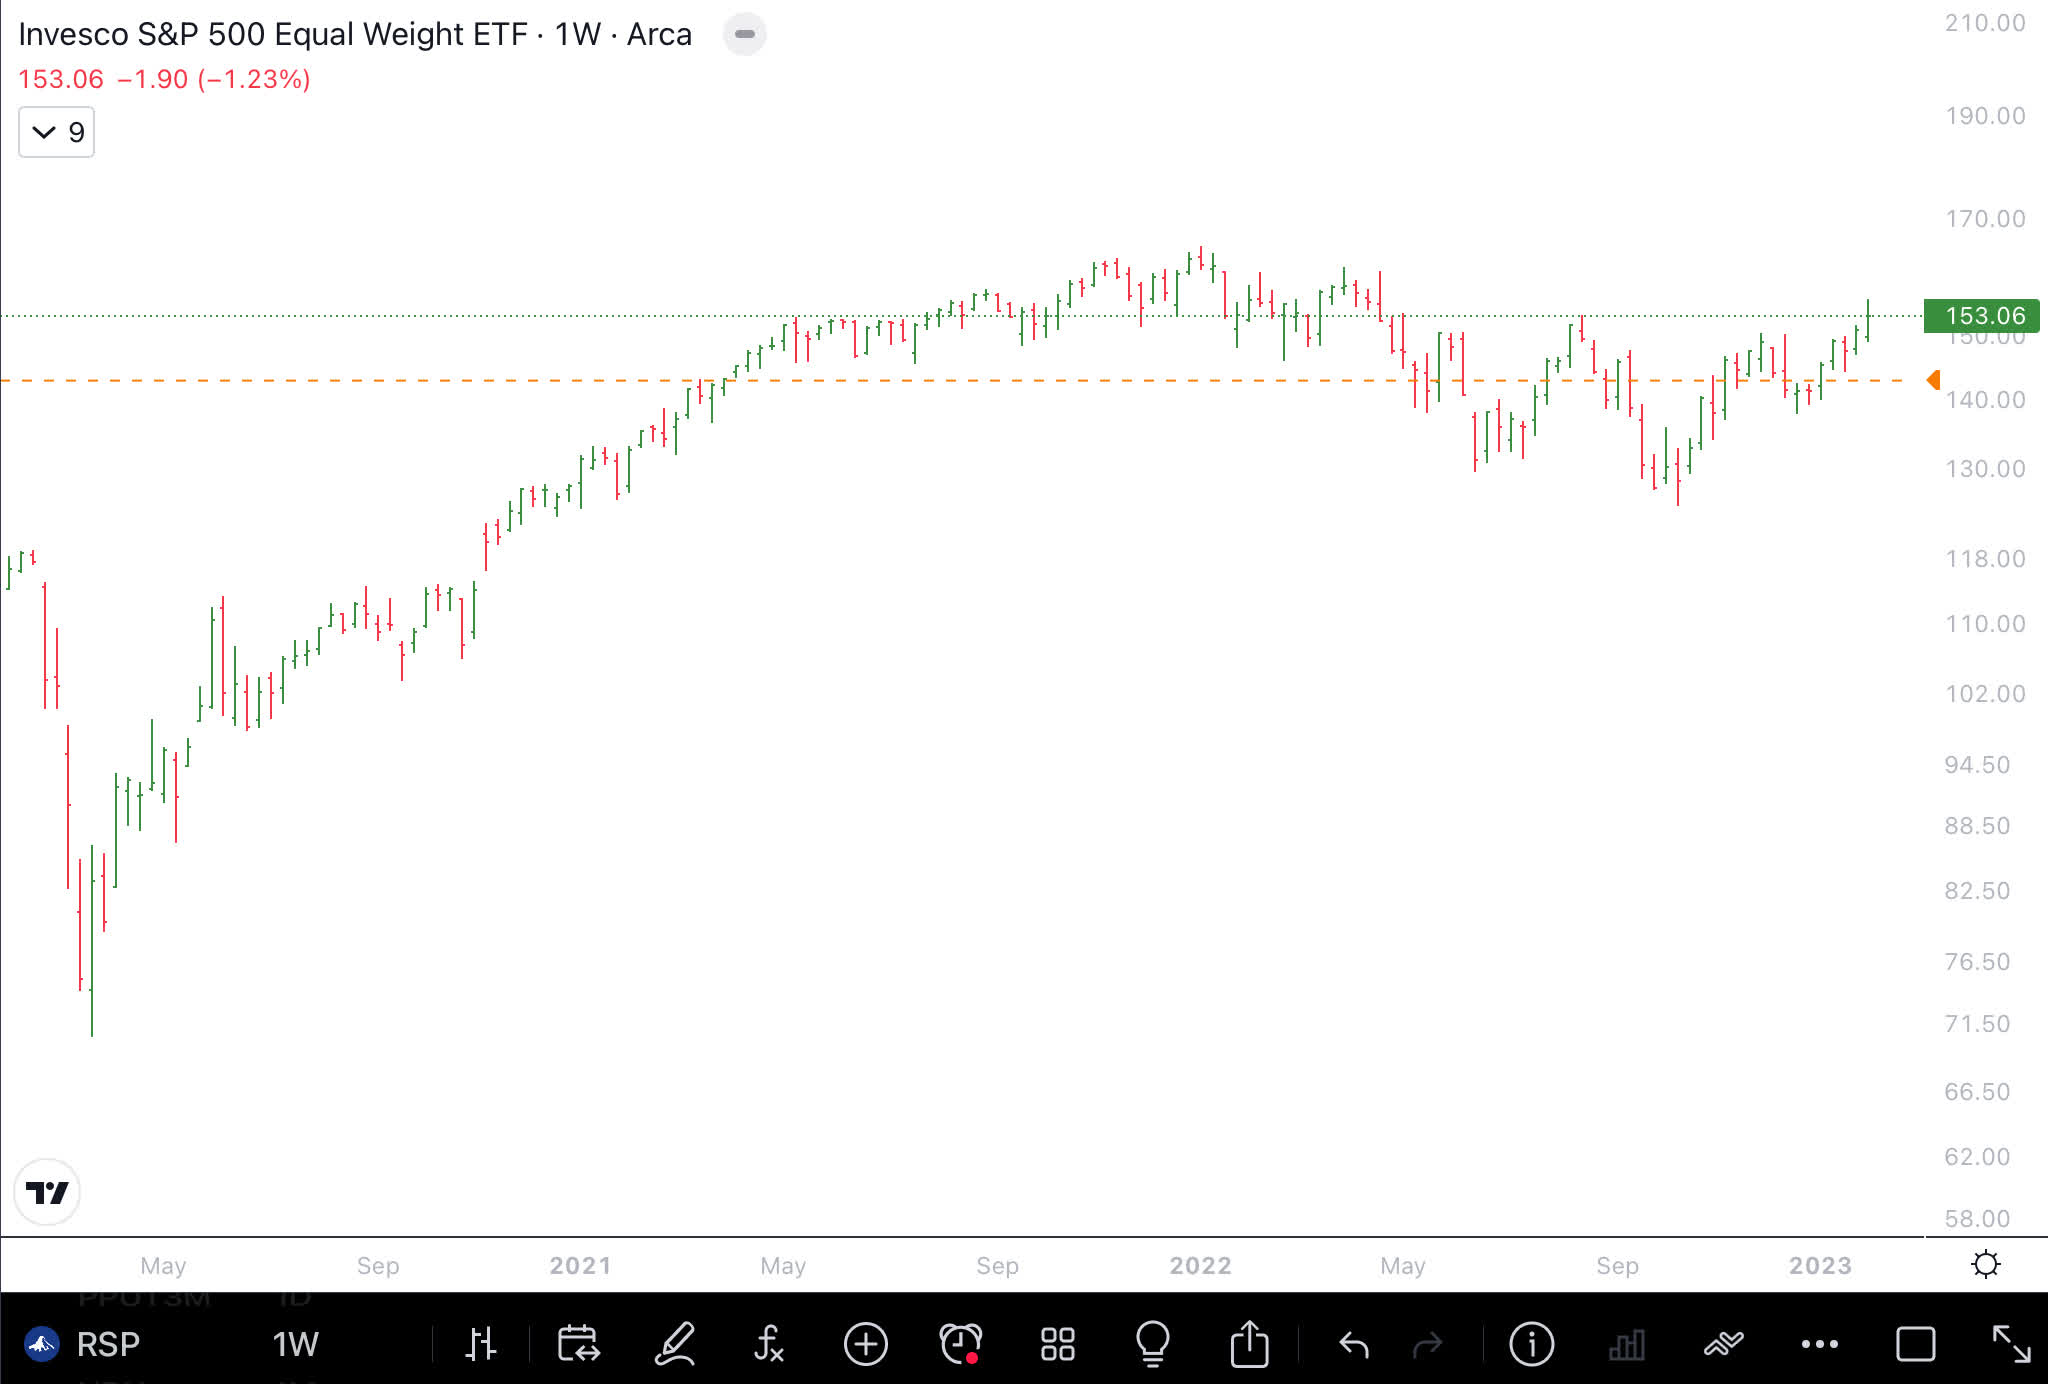
Equal weight mid-cap (EWMC) is also exhibiting a broad rally.
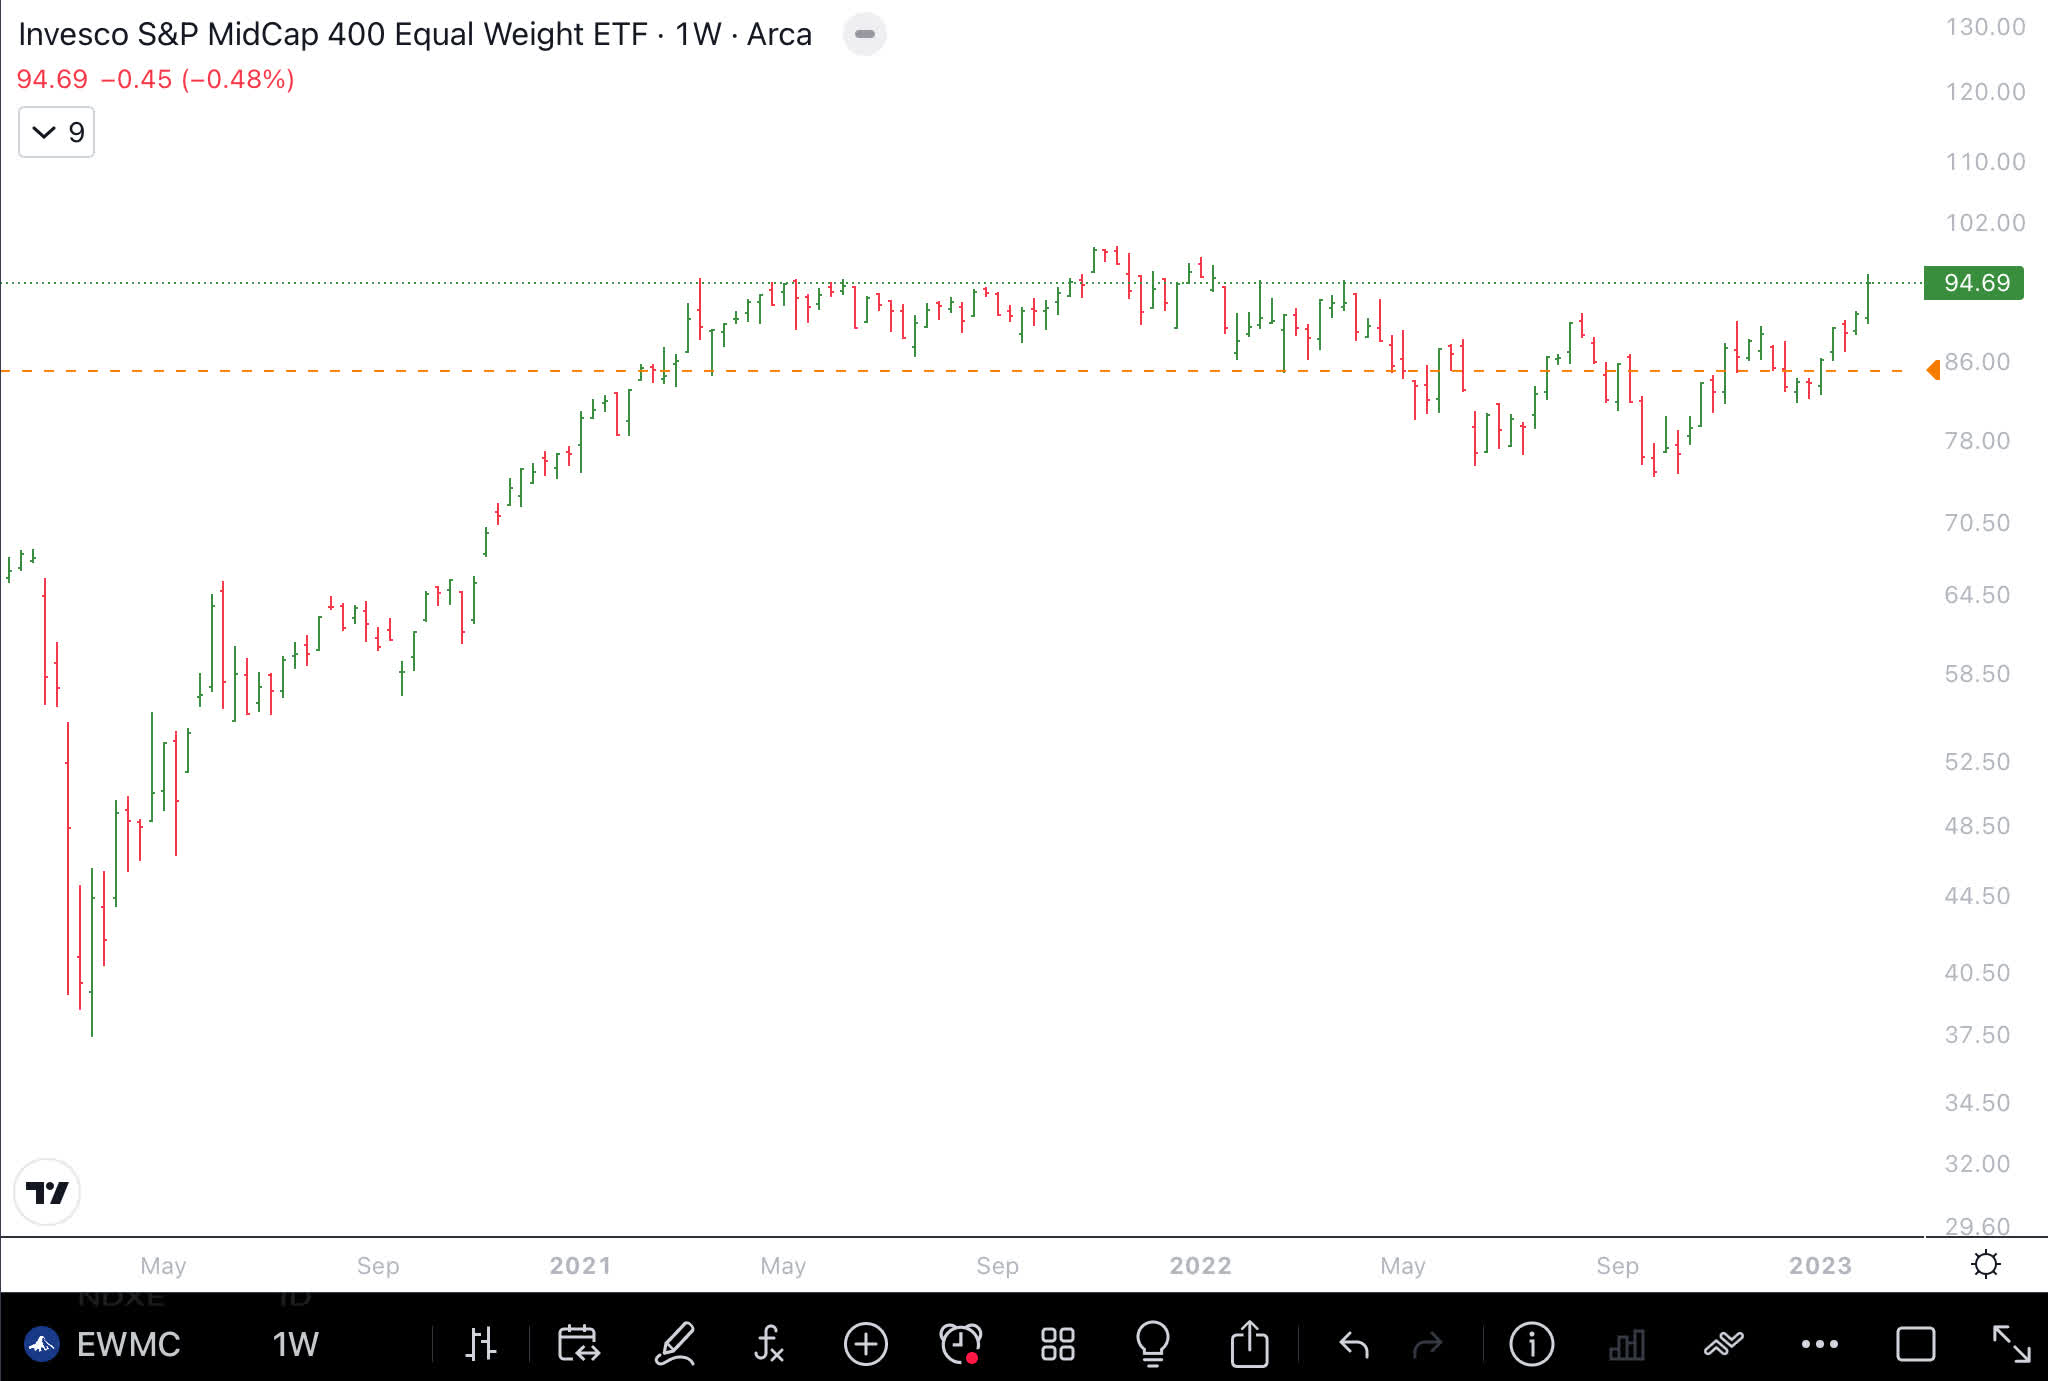
Equal weight small-cap (EWSC) indicates underlying strength.
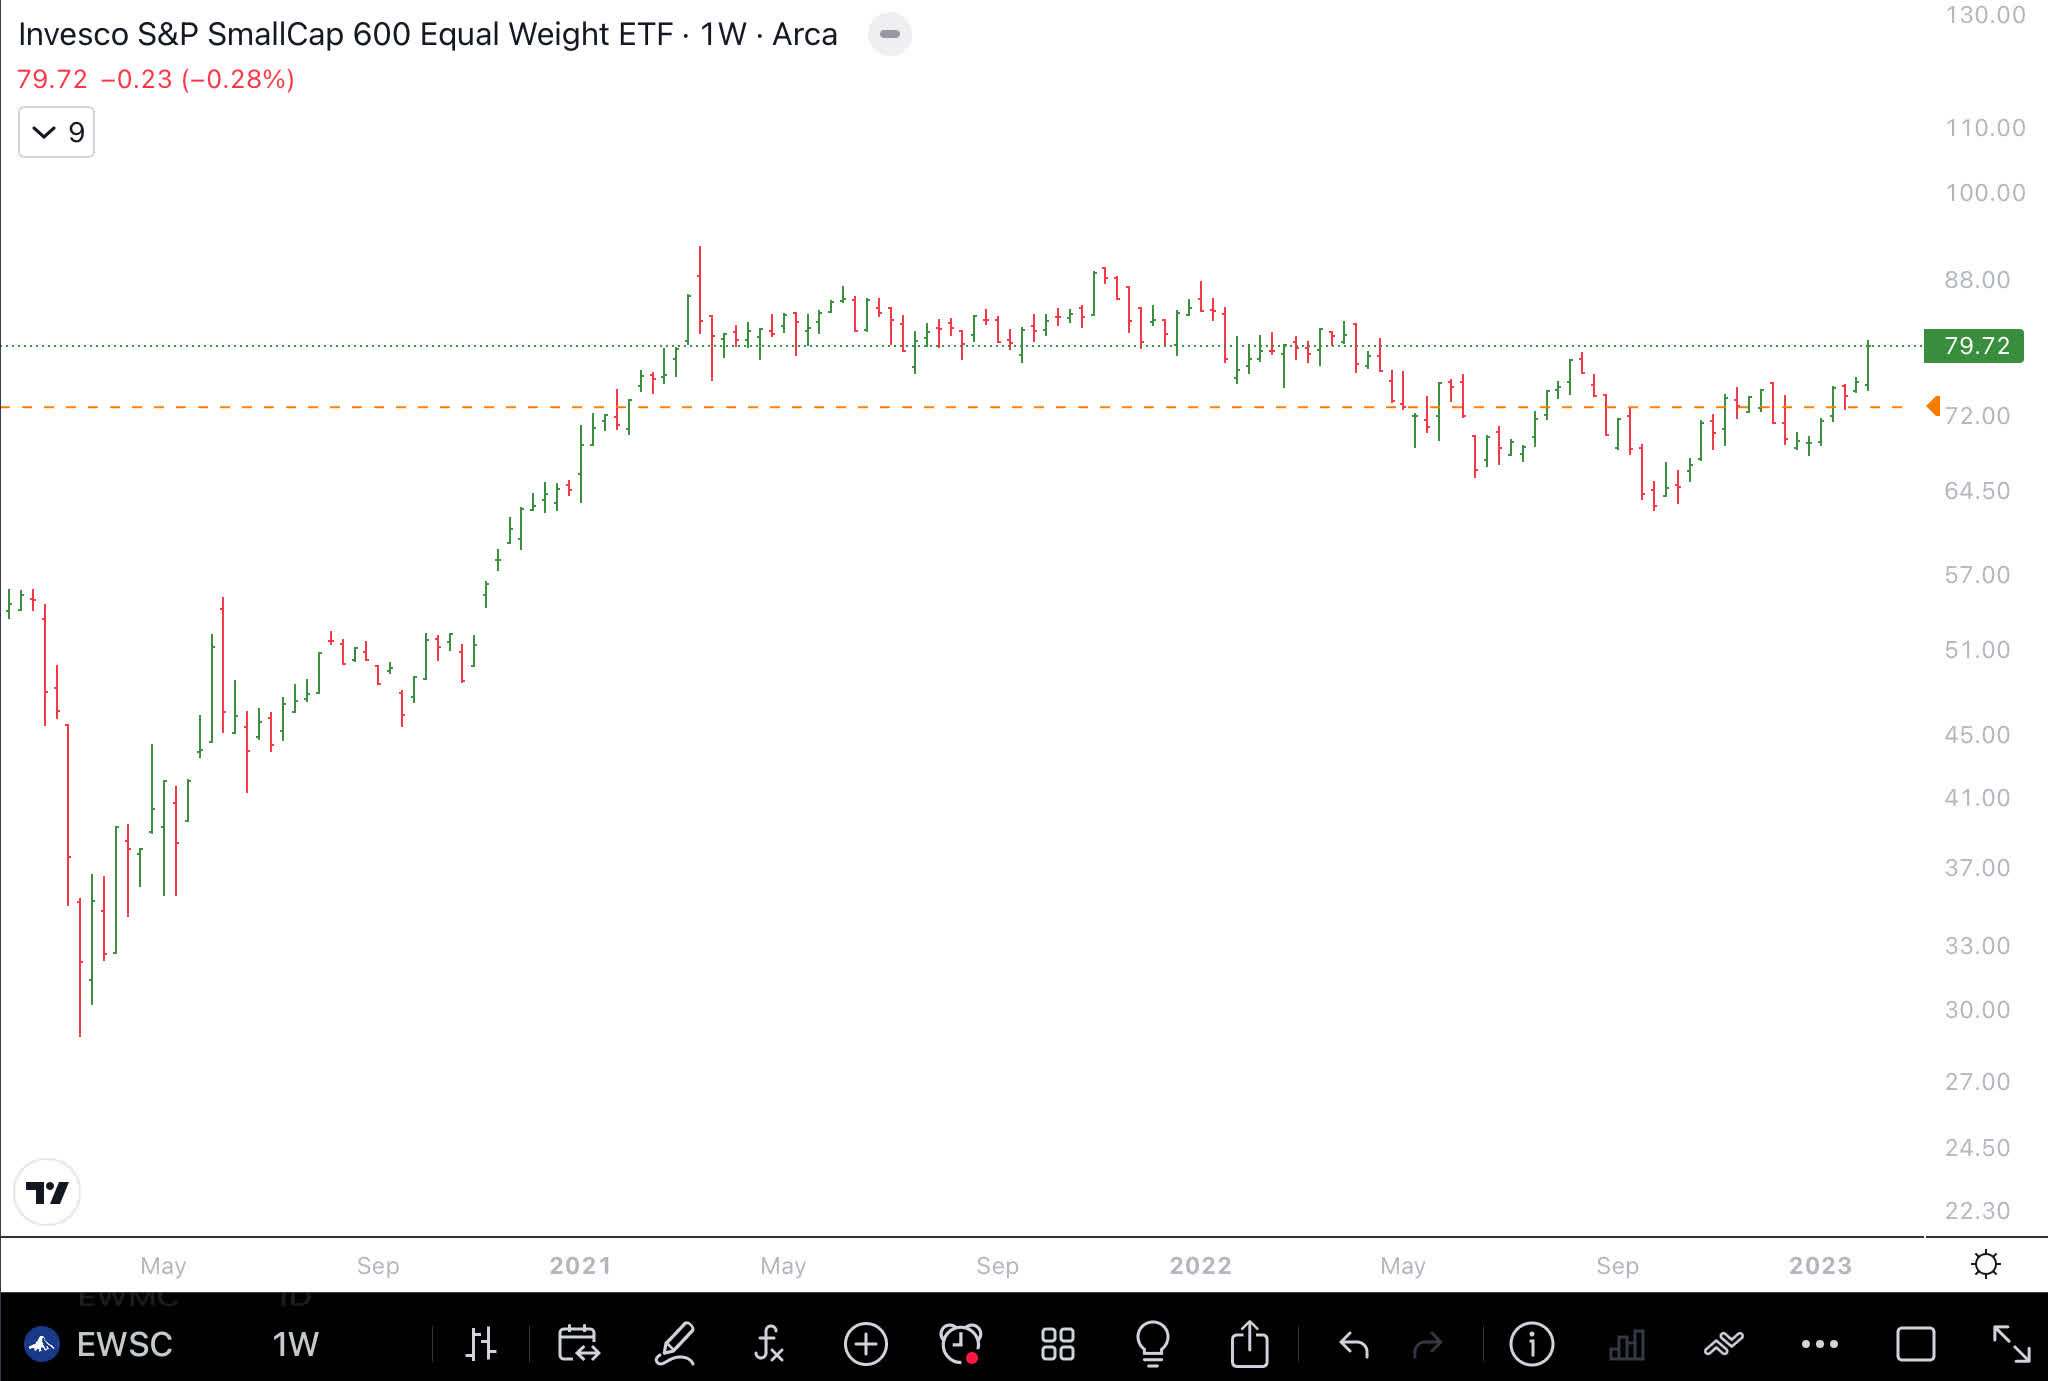
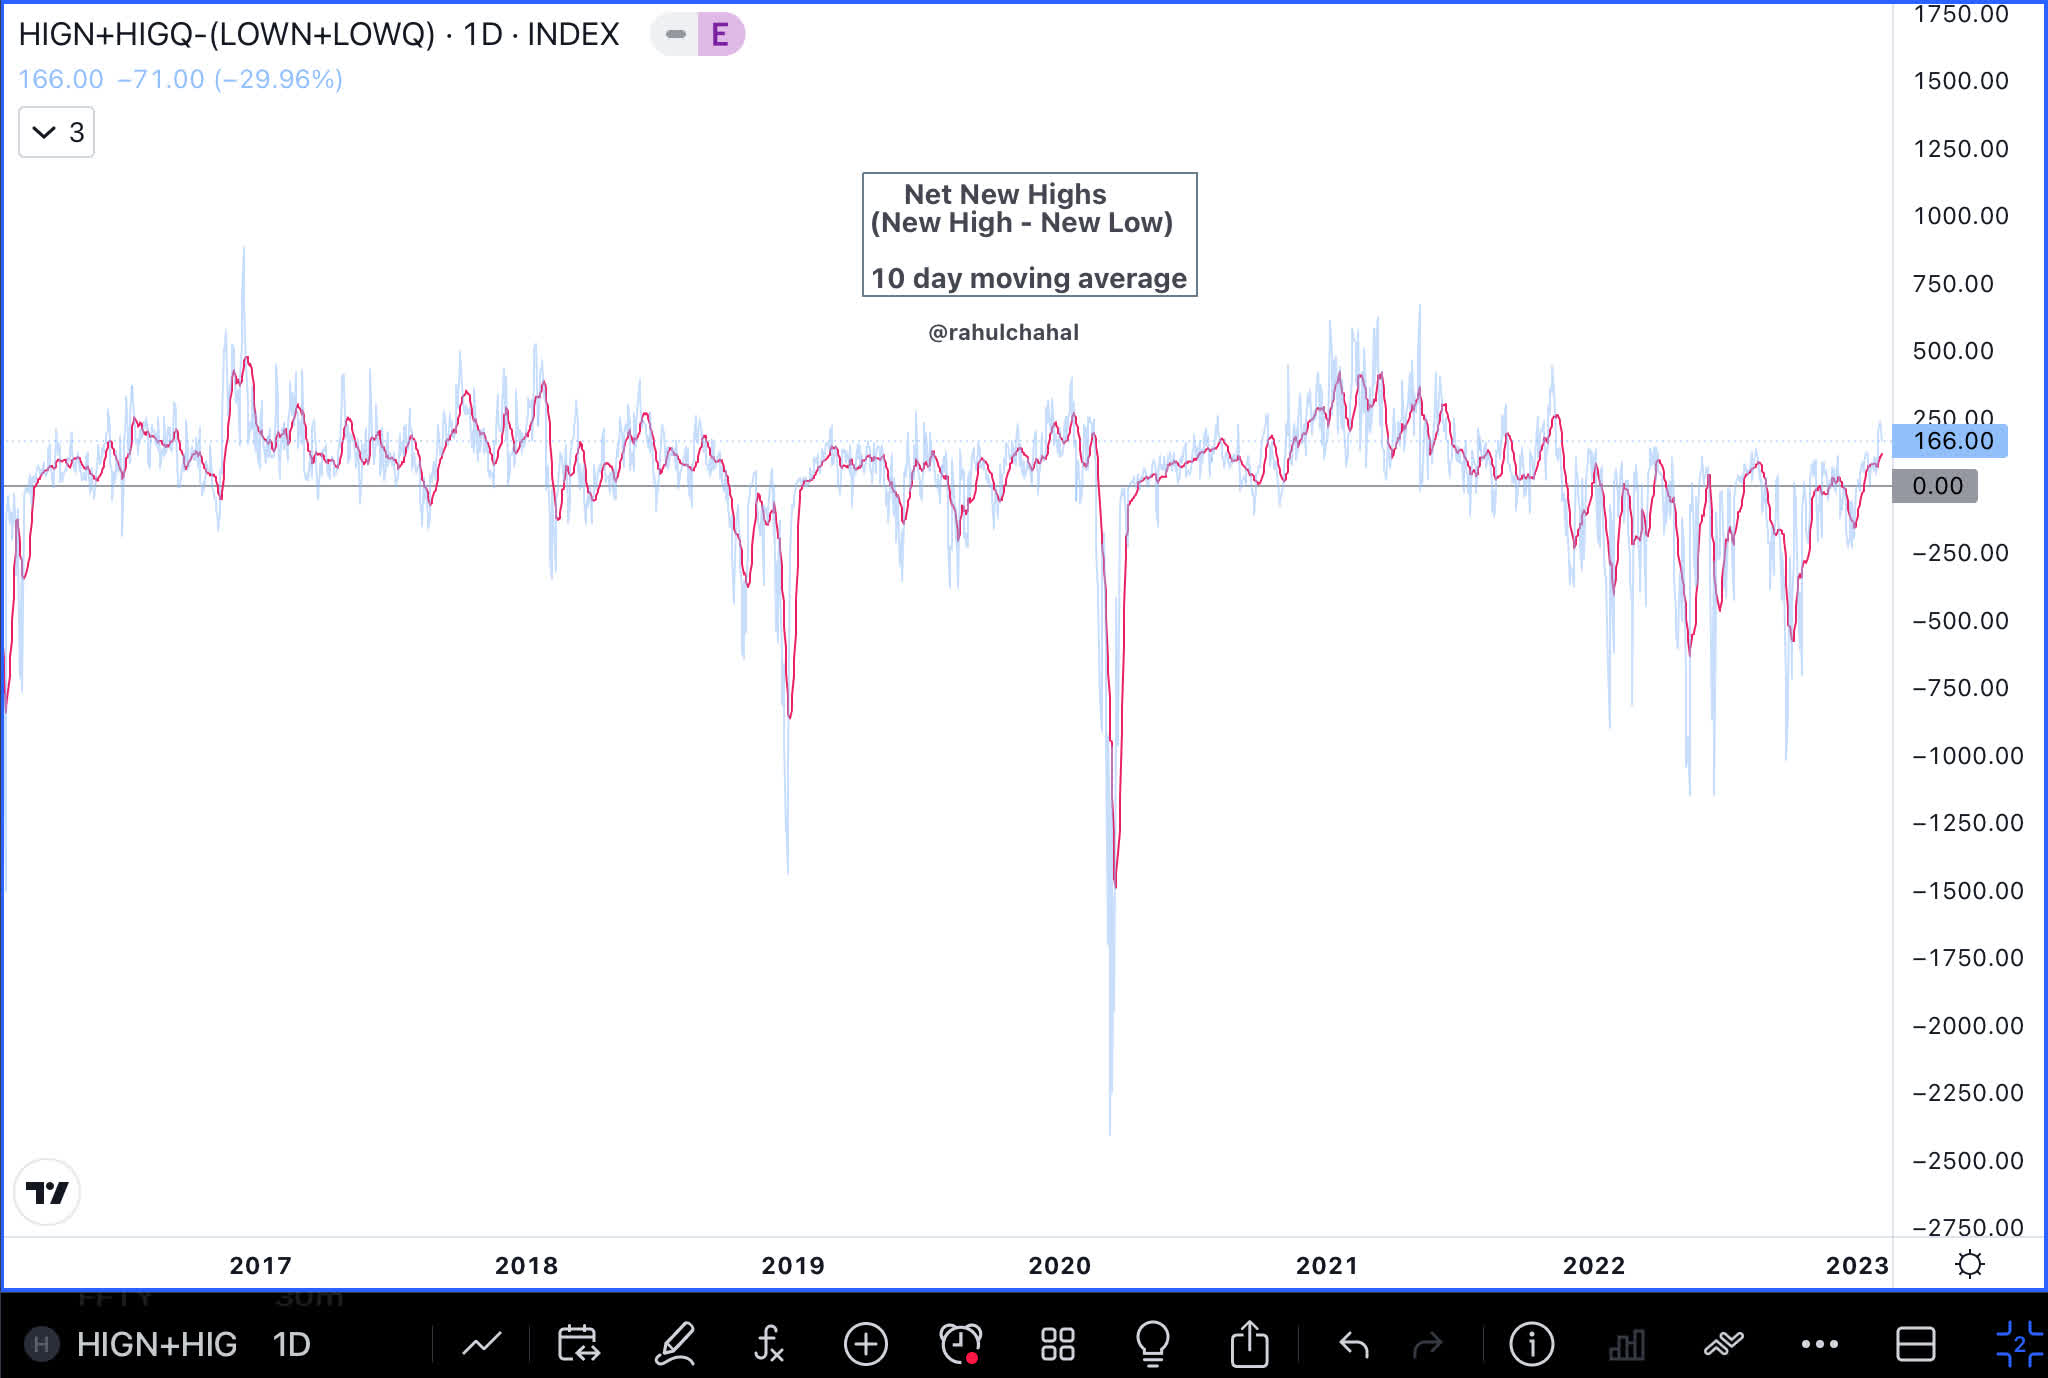
Net New Highs
There are green shoots and the charts below captures them. Net new highs (new highs minus new lows) for the New York Stock Exchange and NASDAQ have remained positive for the past few weeks. For months until October 2022, net new highs were negative.
Comparison Charts
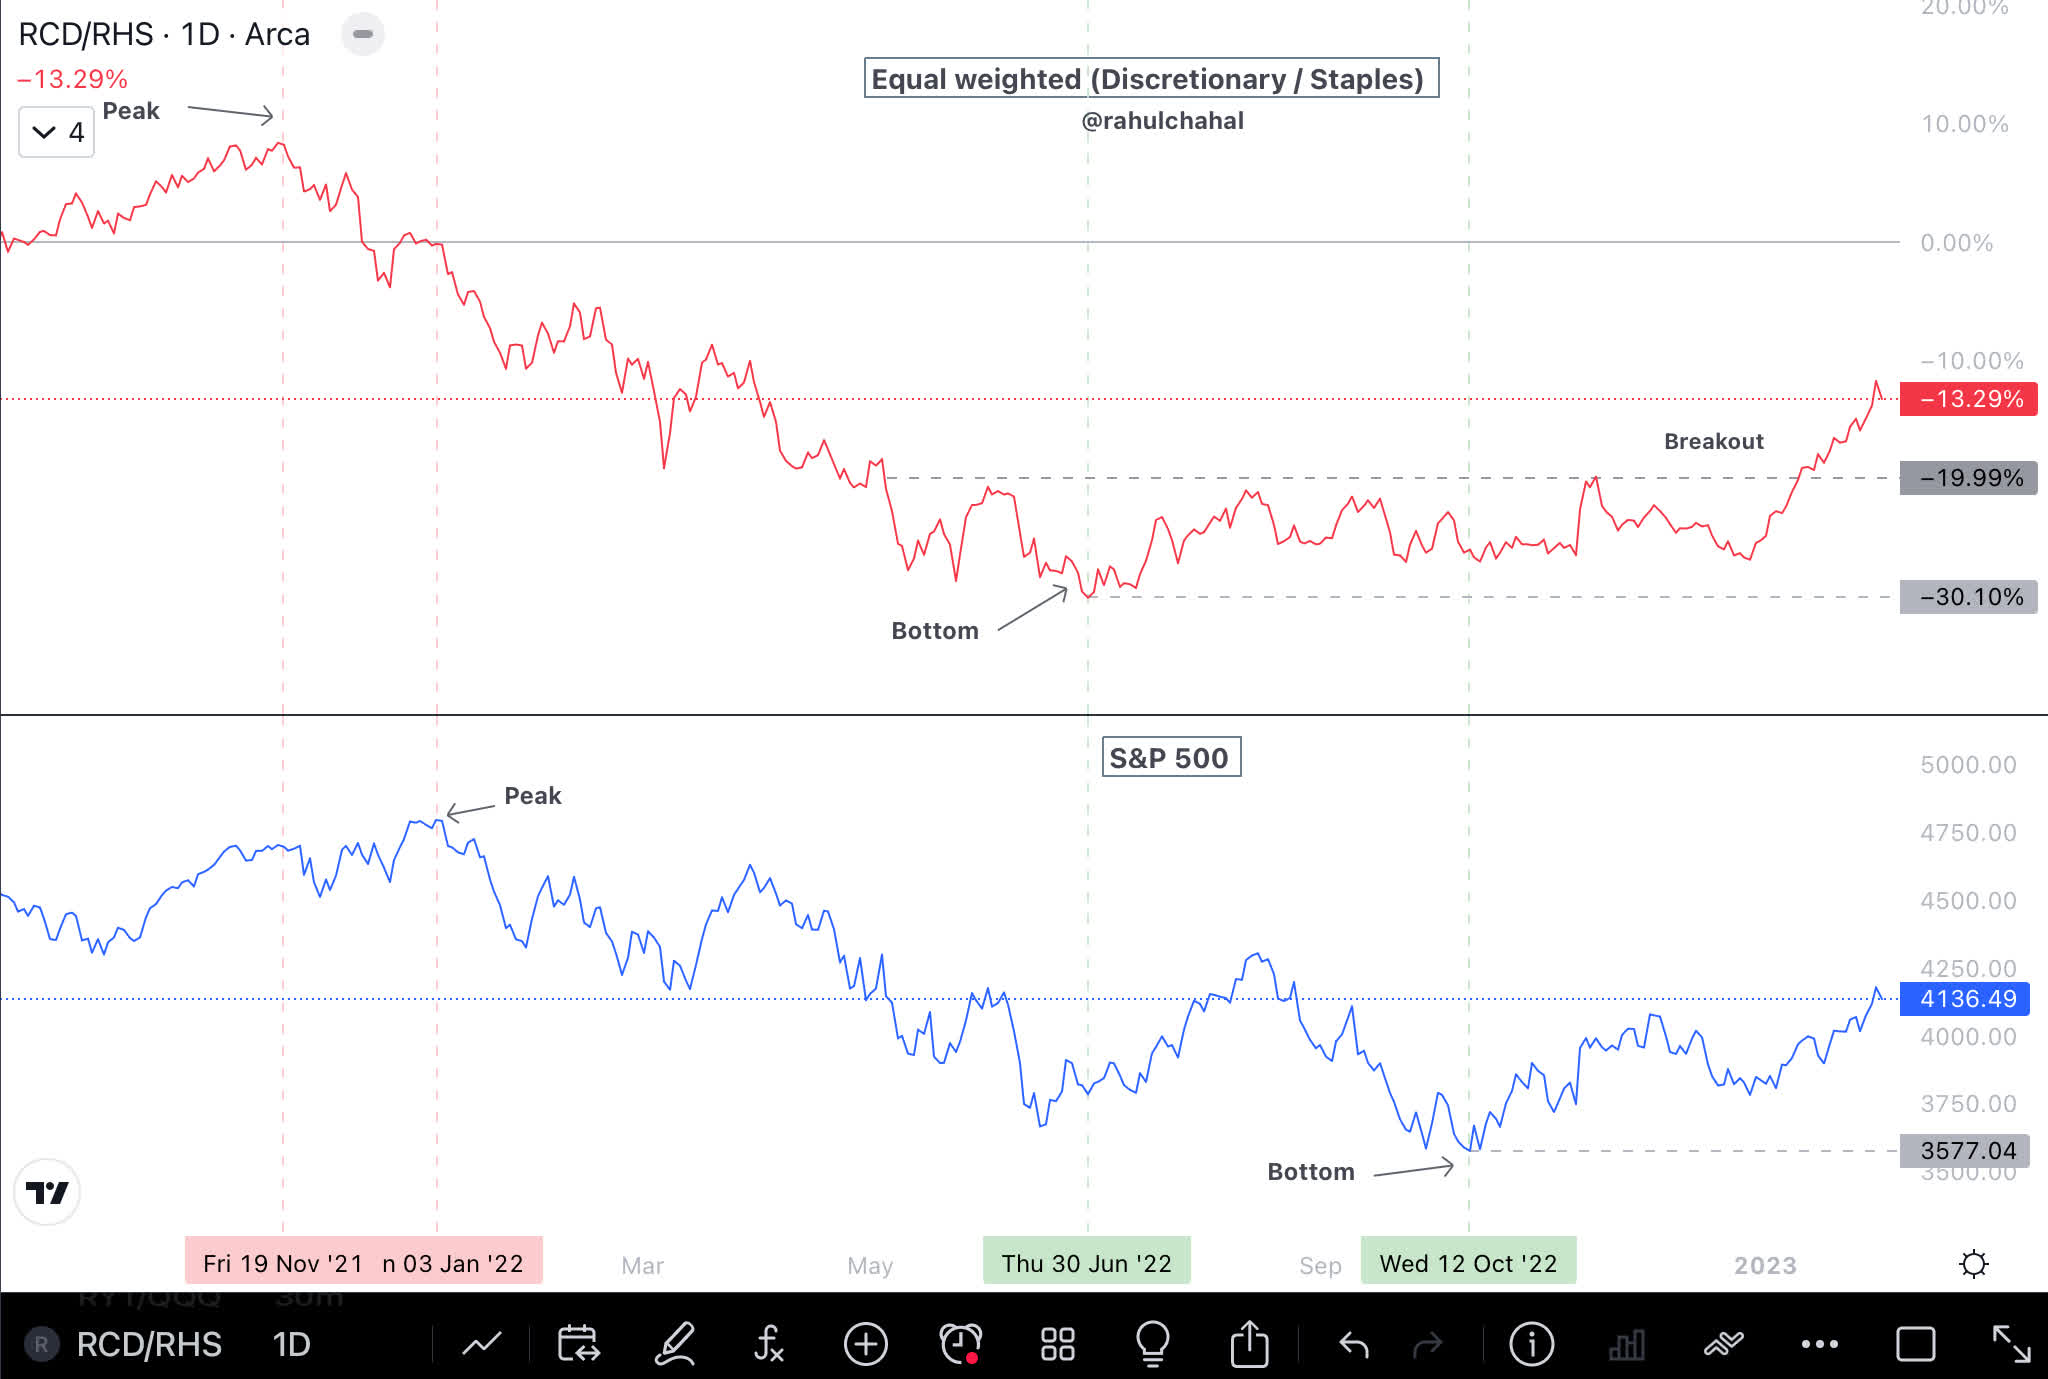
Equally weighted discretionary to equally weighted staples has trended up and is so far indicating that the stock market might go into a risk-on environment.
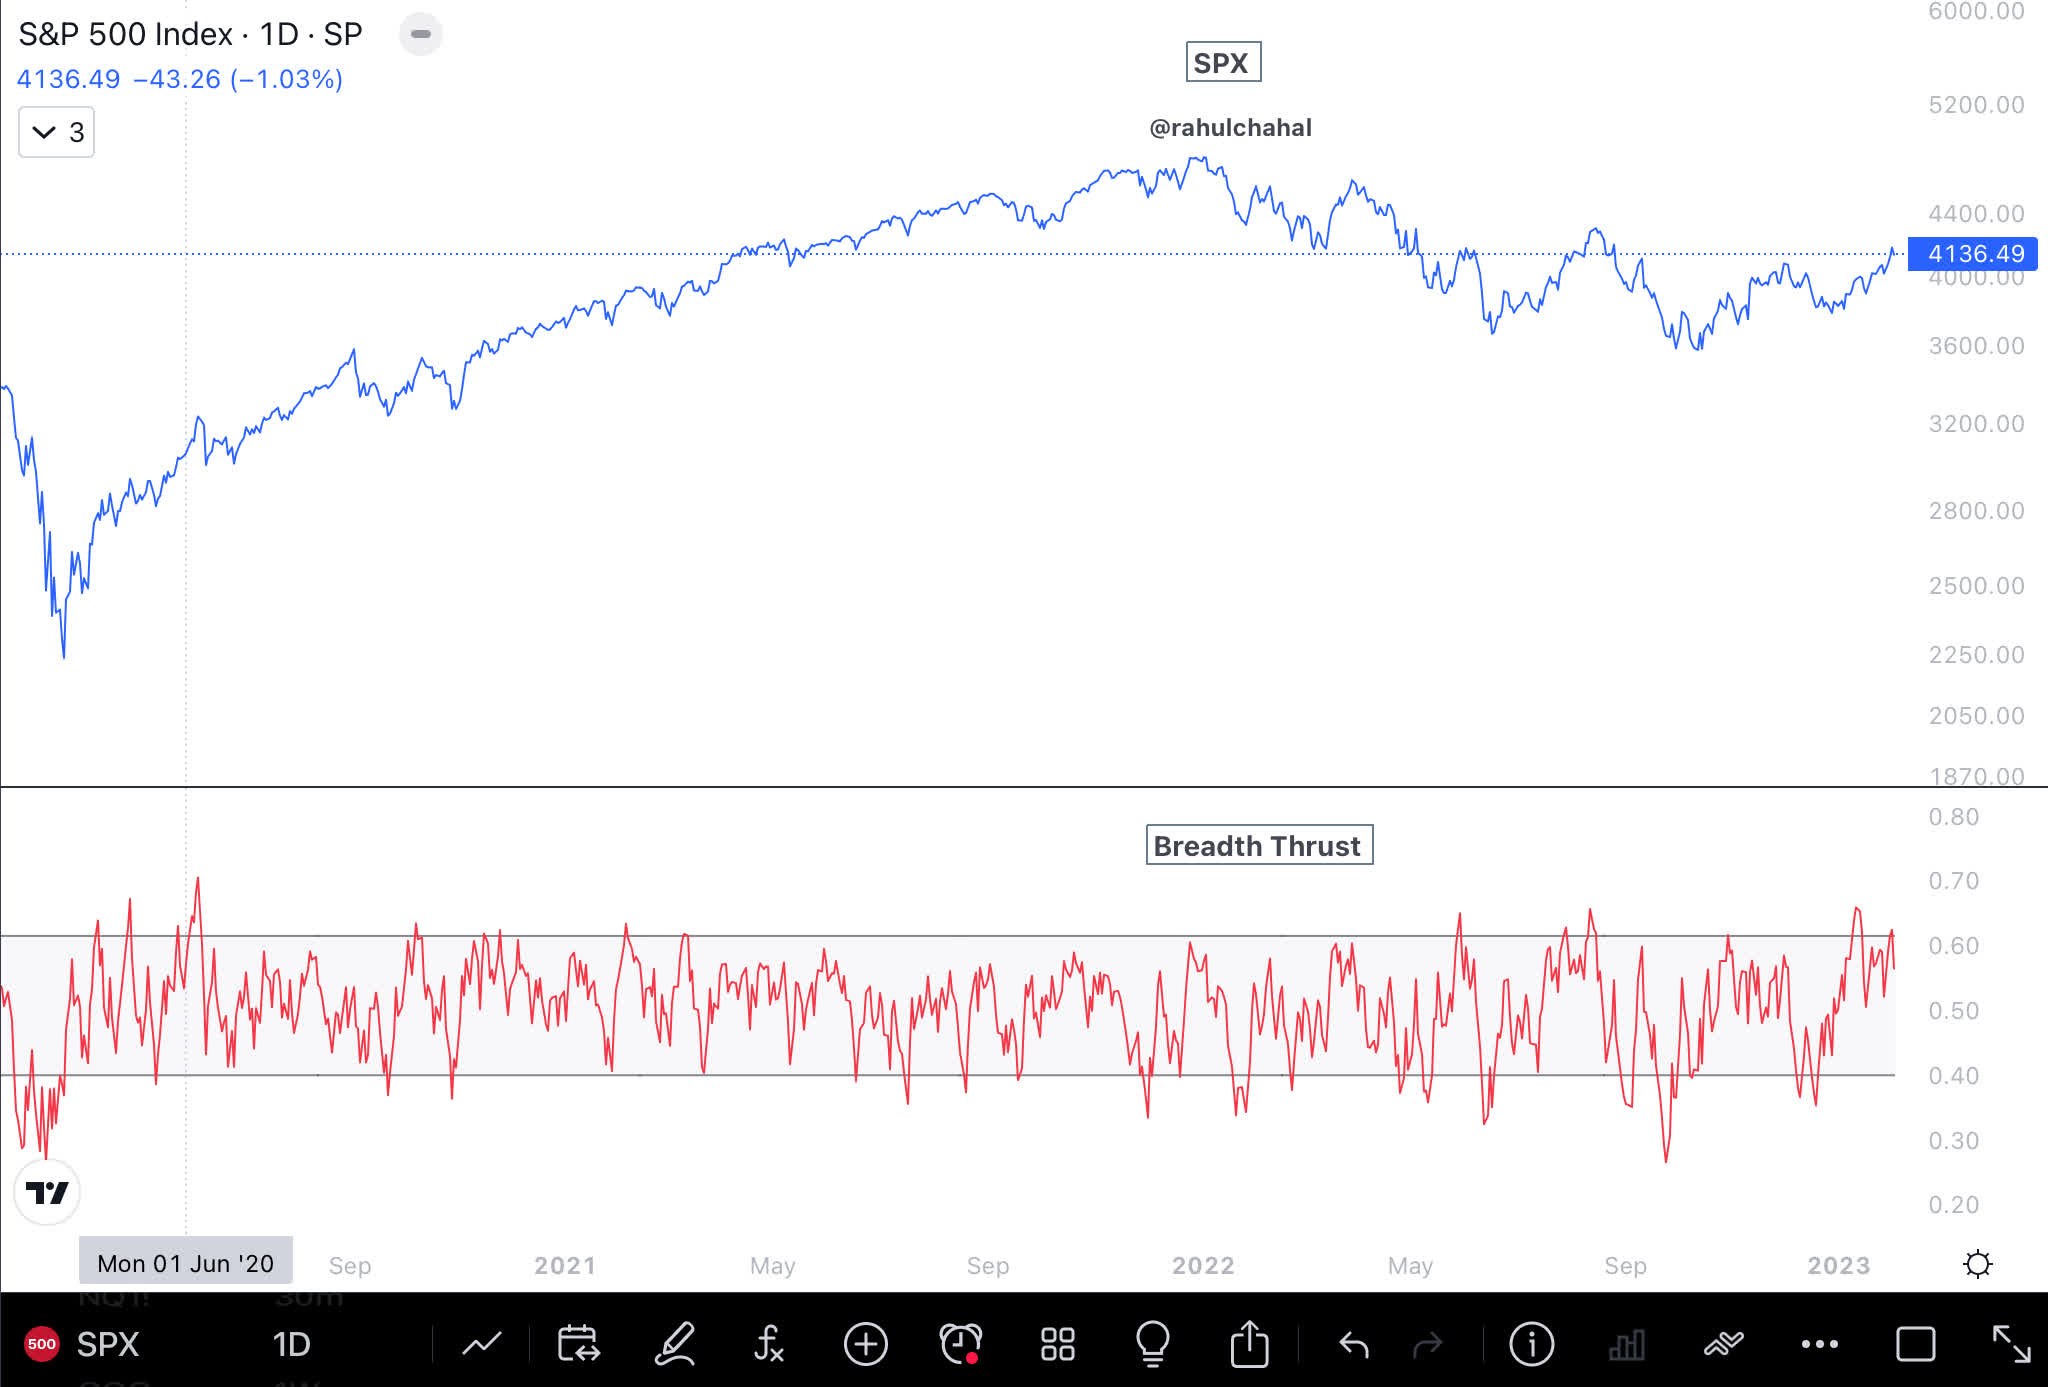
The S&P 500 had a breadth thrust, along with a number of other positive signals. All of these signals are piling up as supportive to start of a higher trending stock market.
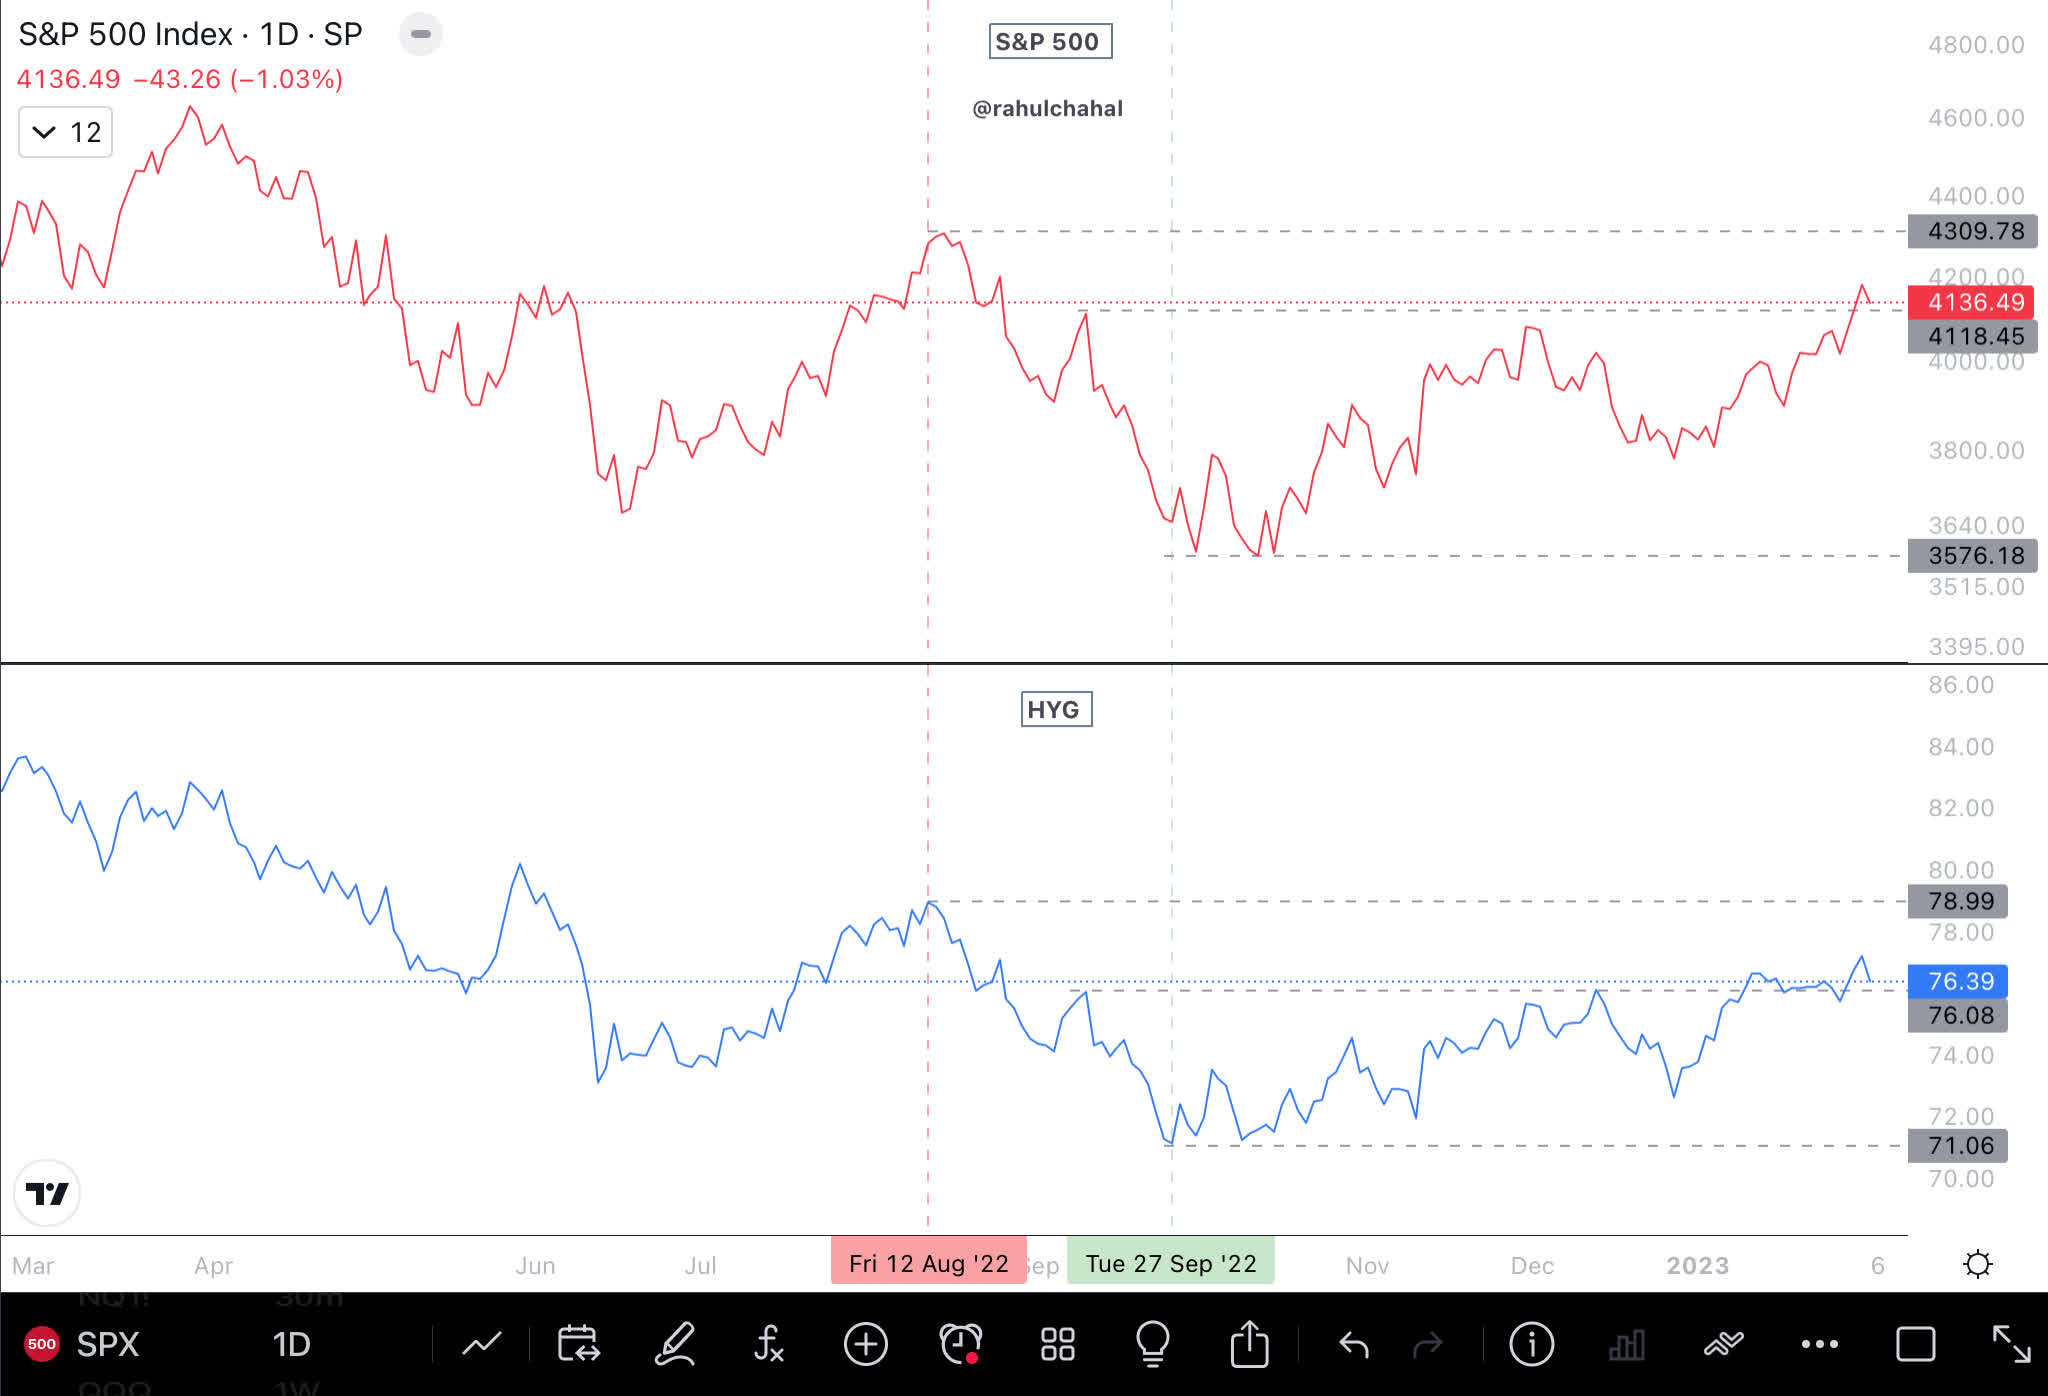
The U.S. high yield corporate bond ( HYG ) has been steadily rising and has broken out above the range from August 2022, which indicates start of a risk-on environment.
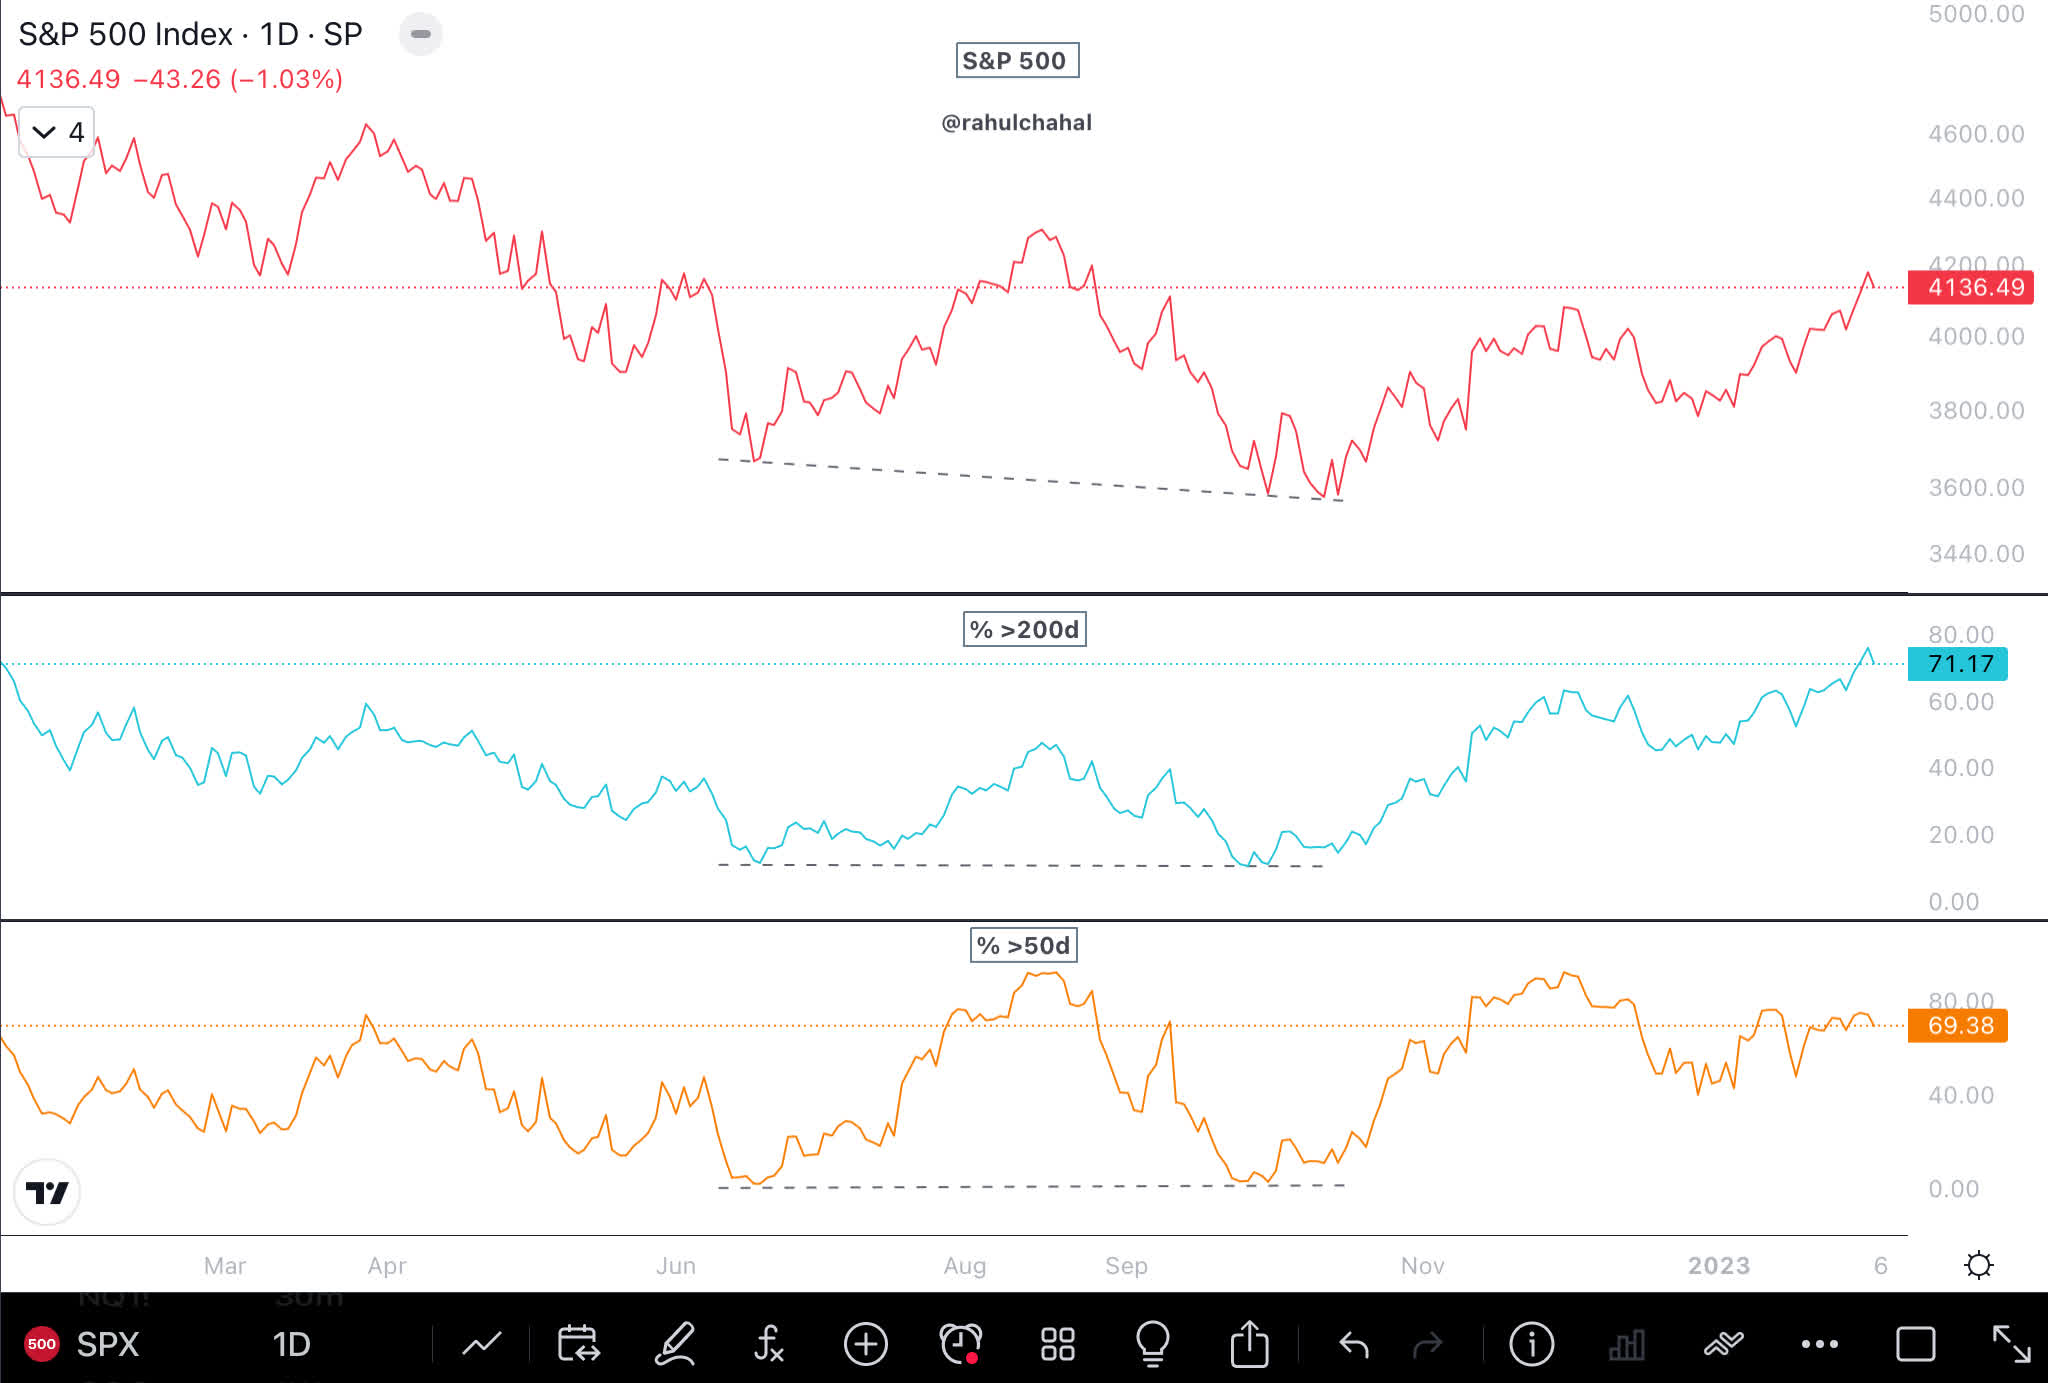
The percentages of S&P 500 stocks above the 200- and 50-day moving average are holding up, which is supportive for the overall stock market.
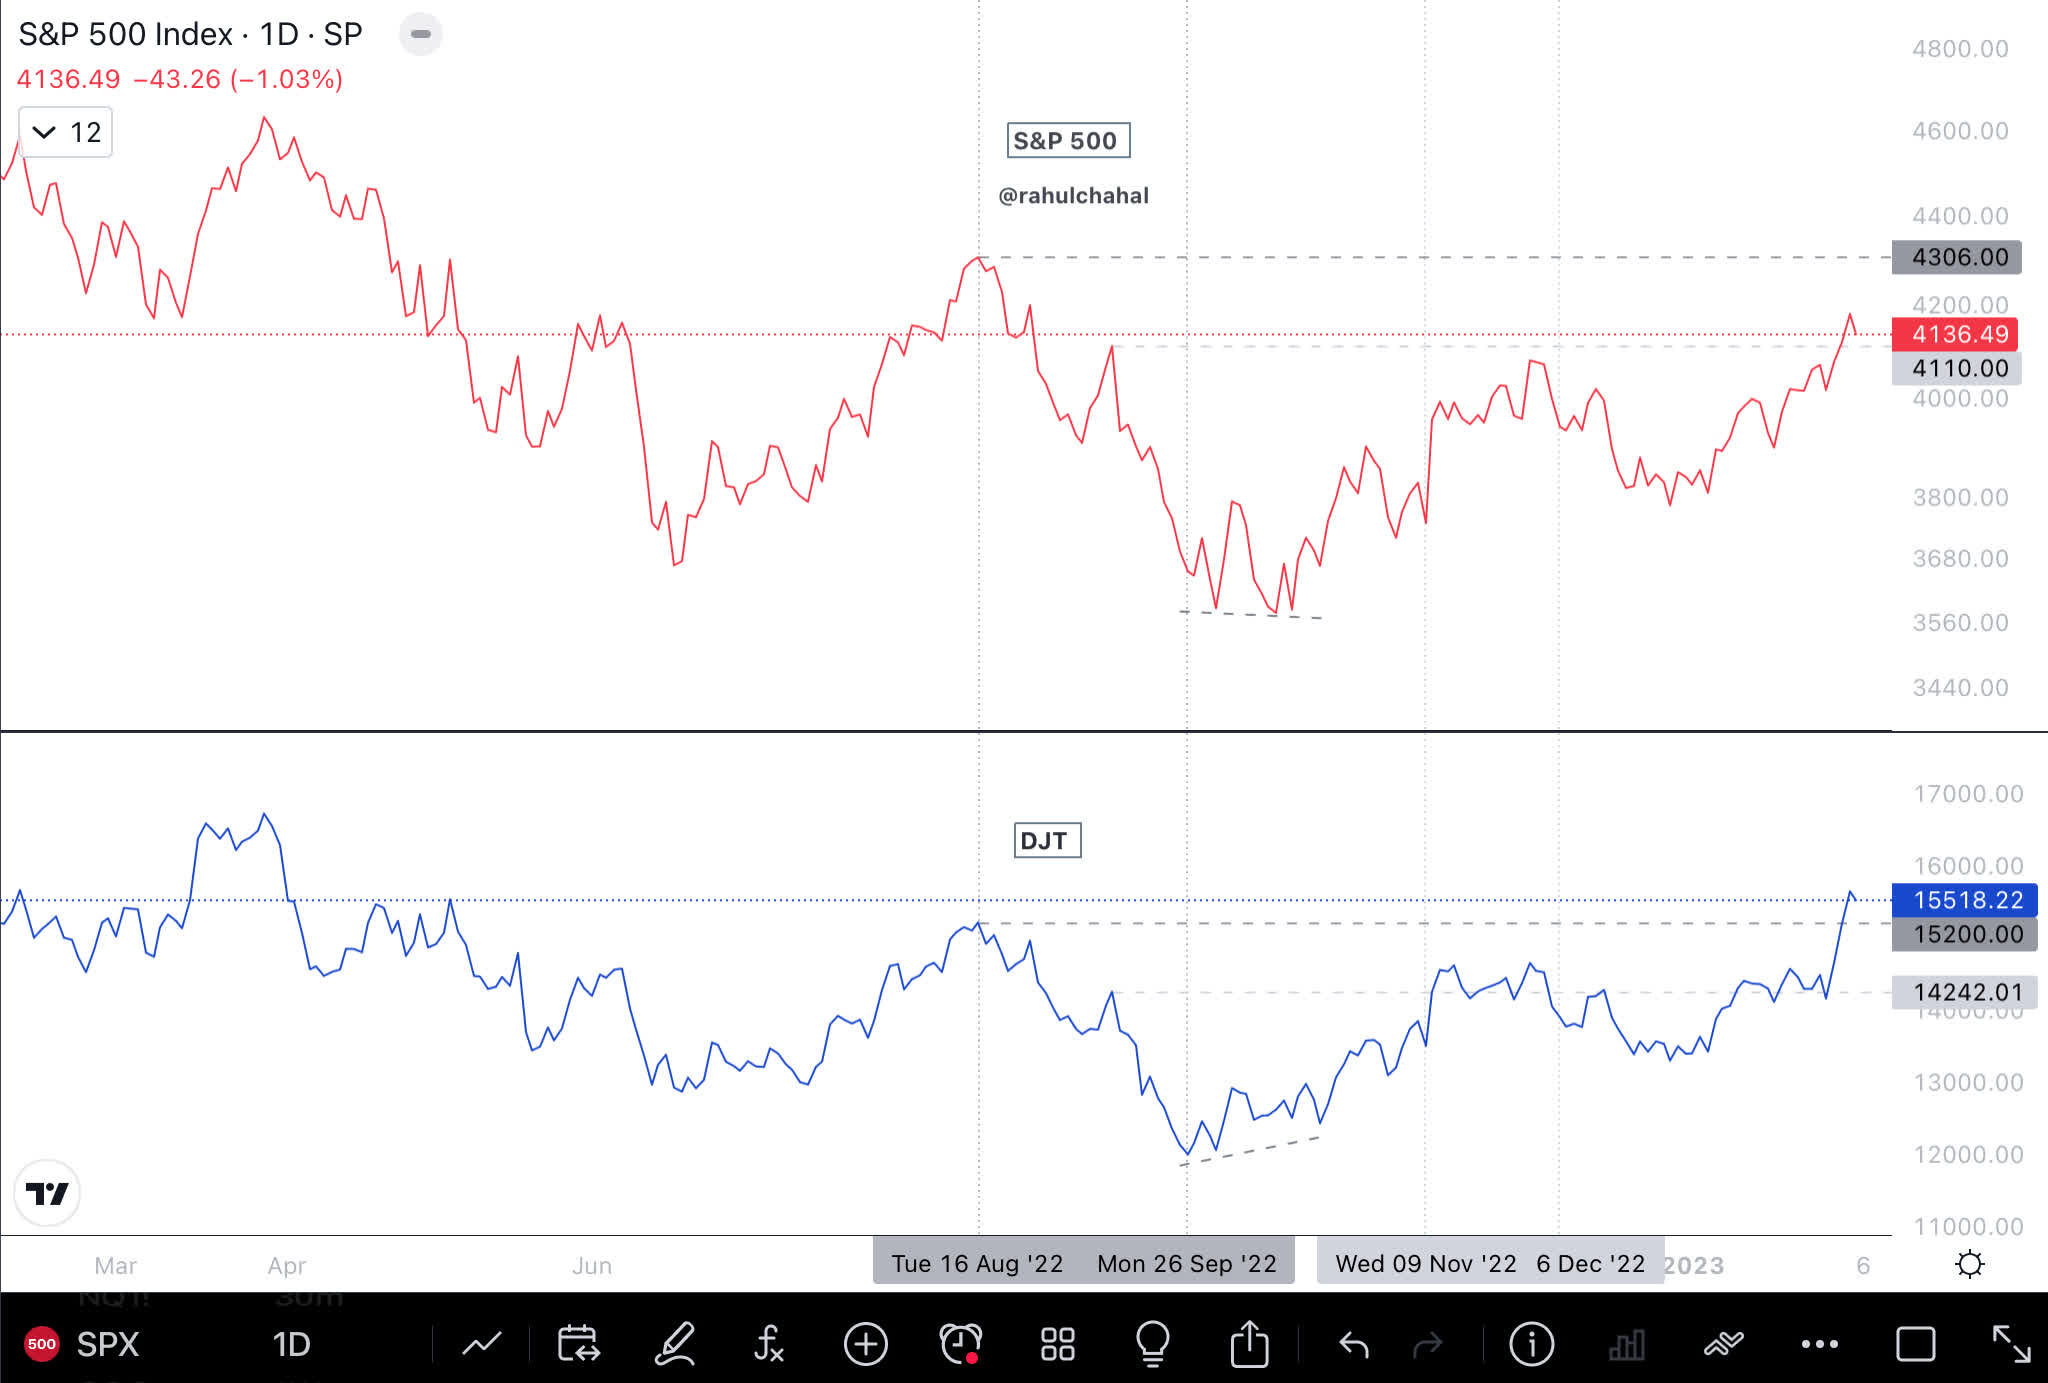
Dow transports index ( DJT ) is holding up, and has closed above 15,200. This is supportive for the overall stock market.
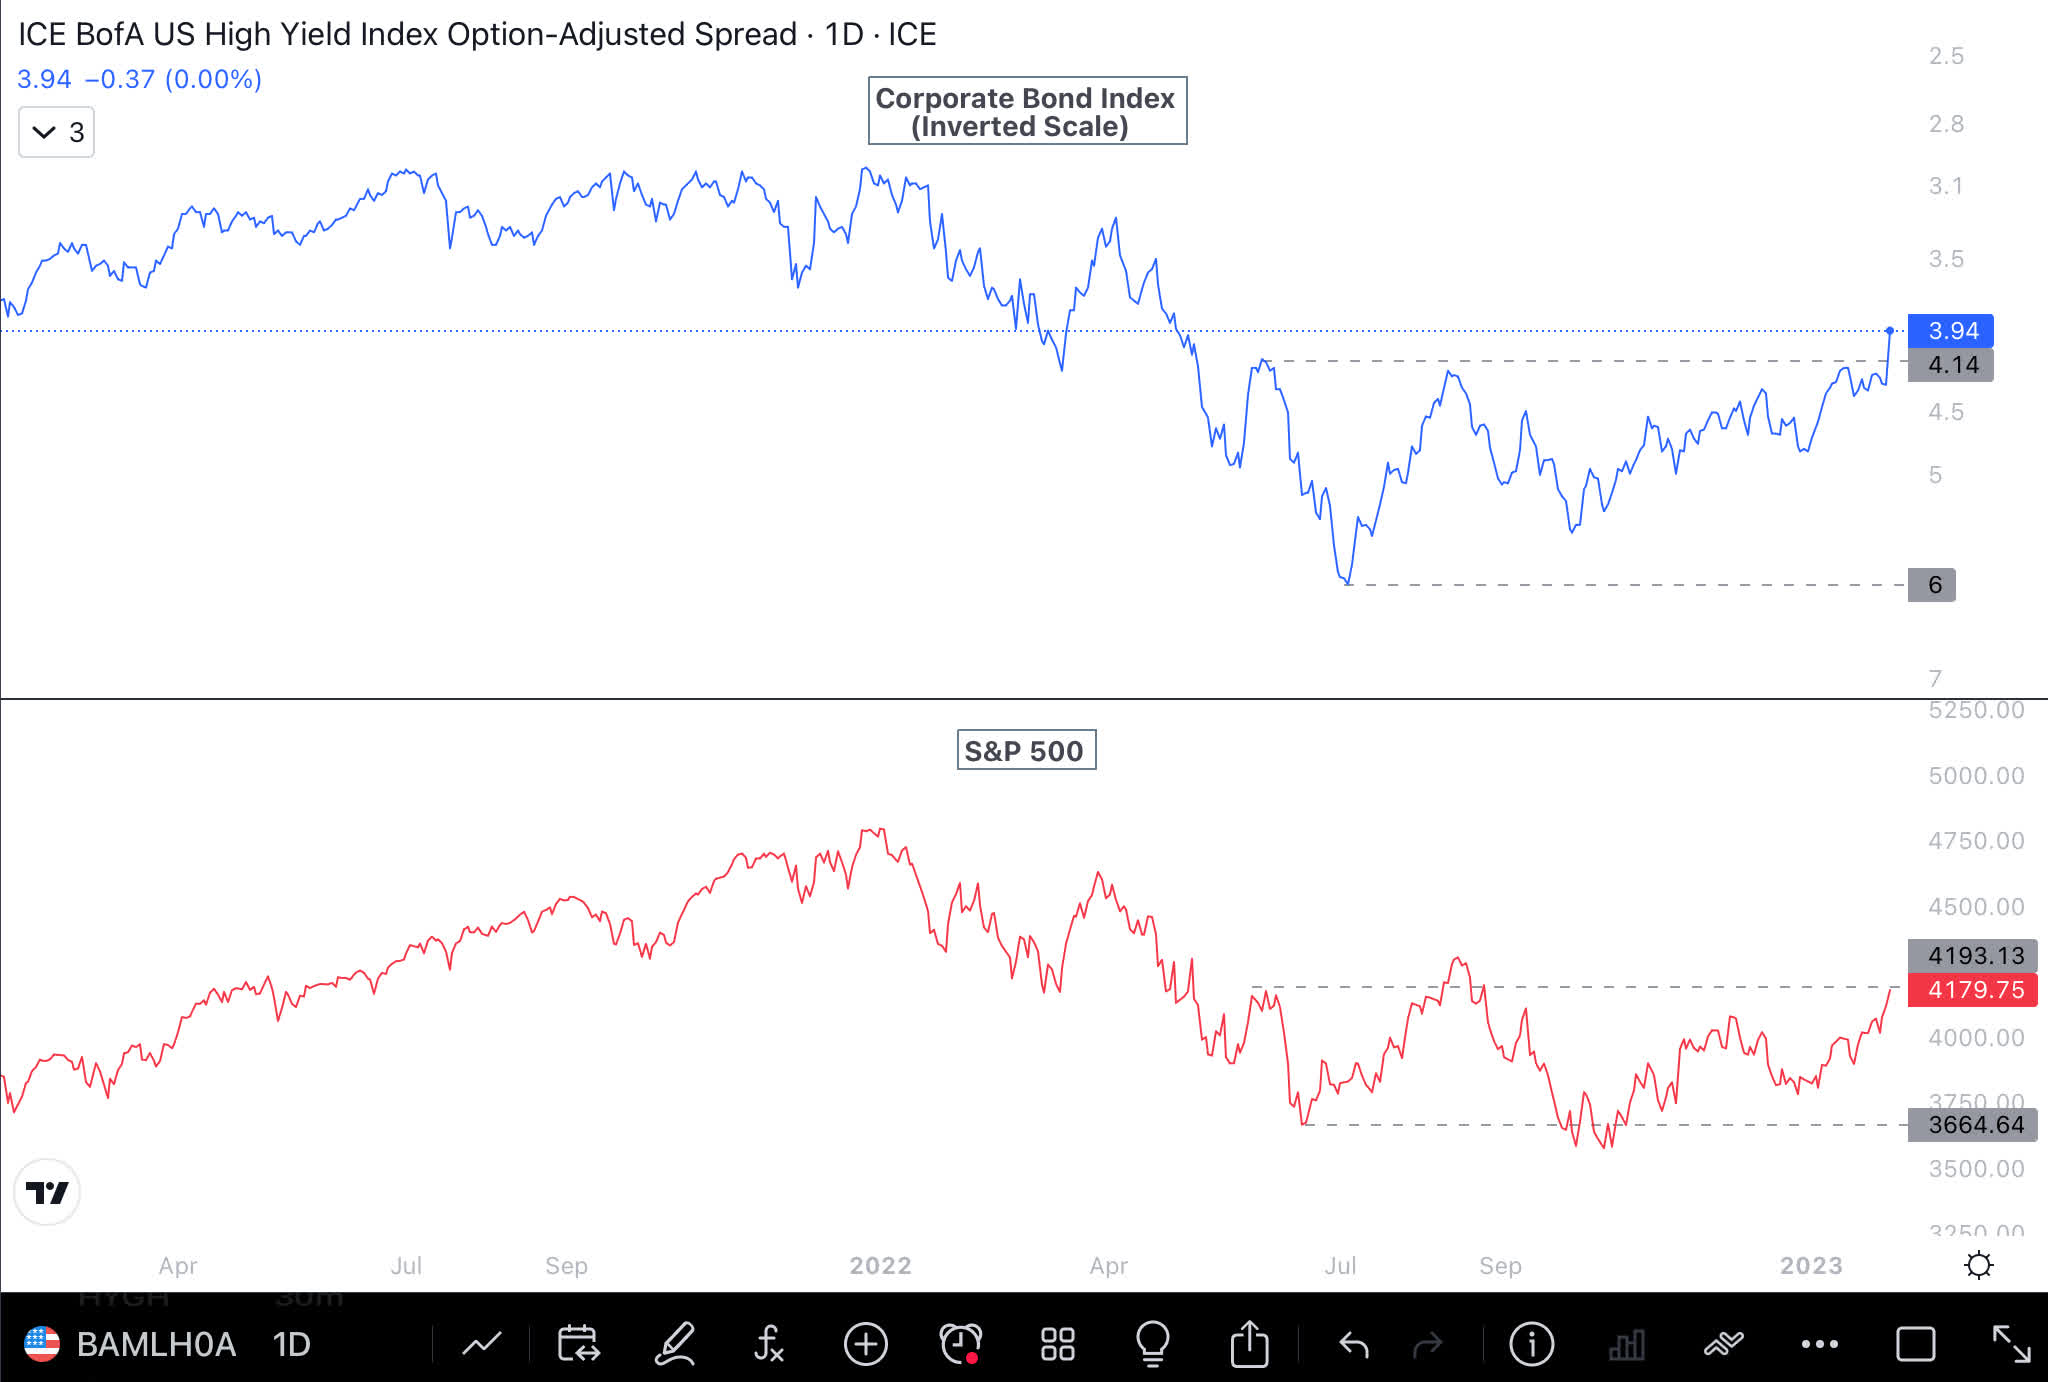
The corporate bond index is shown below on an inverted scale, so that it can be compared to the S&P 500. Over the past few weeks, the corporate bond index has held up, and a continuing trend upward would be positive for the stock market.
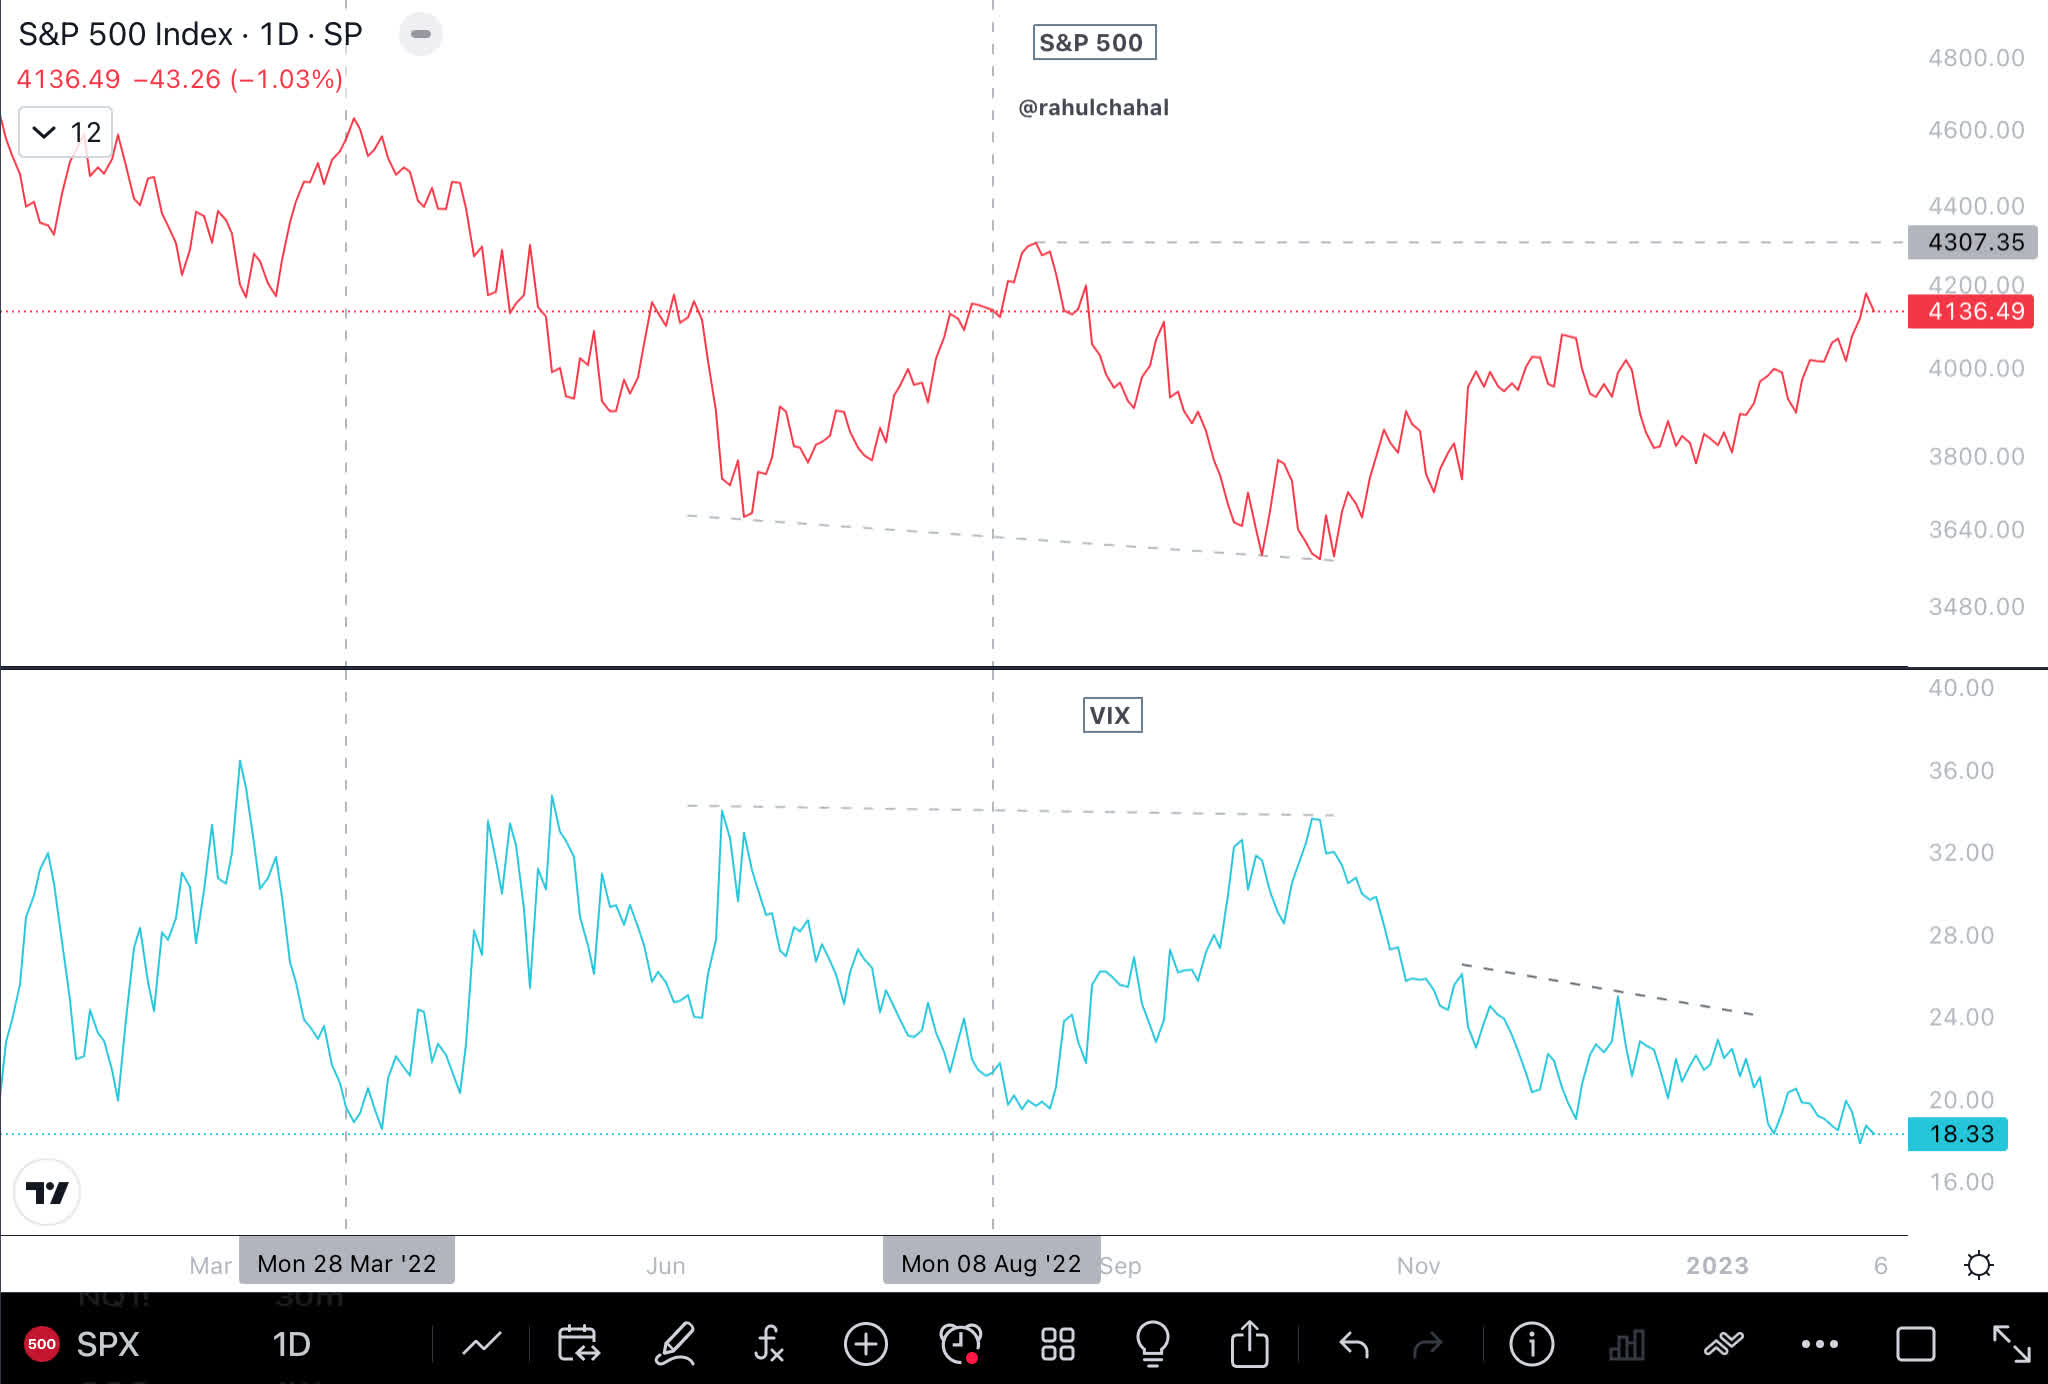
VIX has remained calm the past few weeks considering all the economic and geopolitical issues out there.
VIX Term Structure
The VIX term structure is in contango, and the VIX is below 20. This is a positive development and supportive for a risk-on environment.
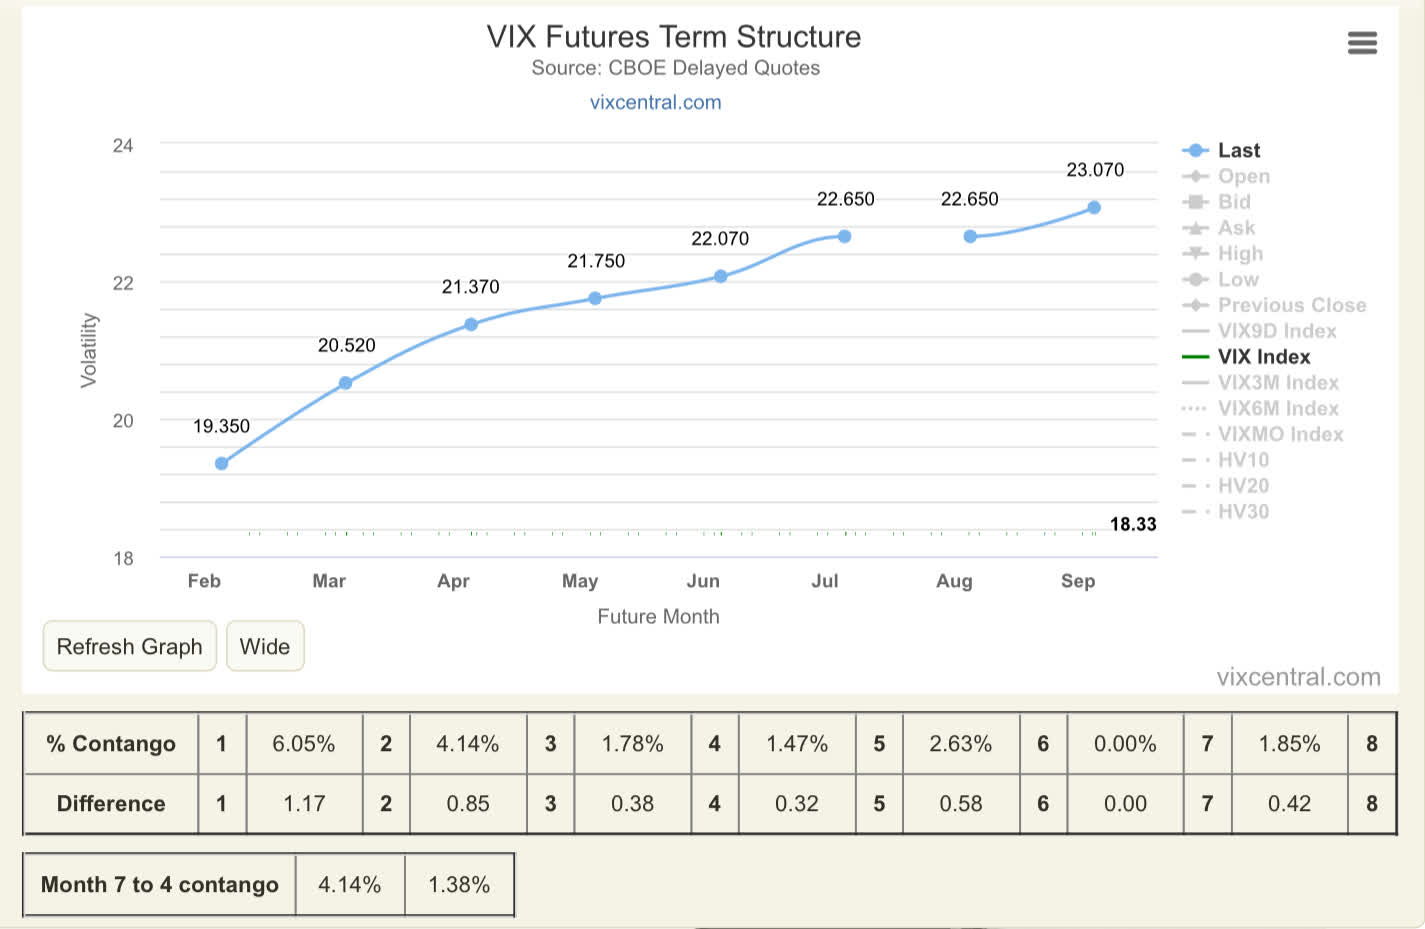
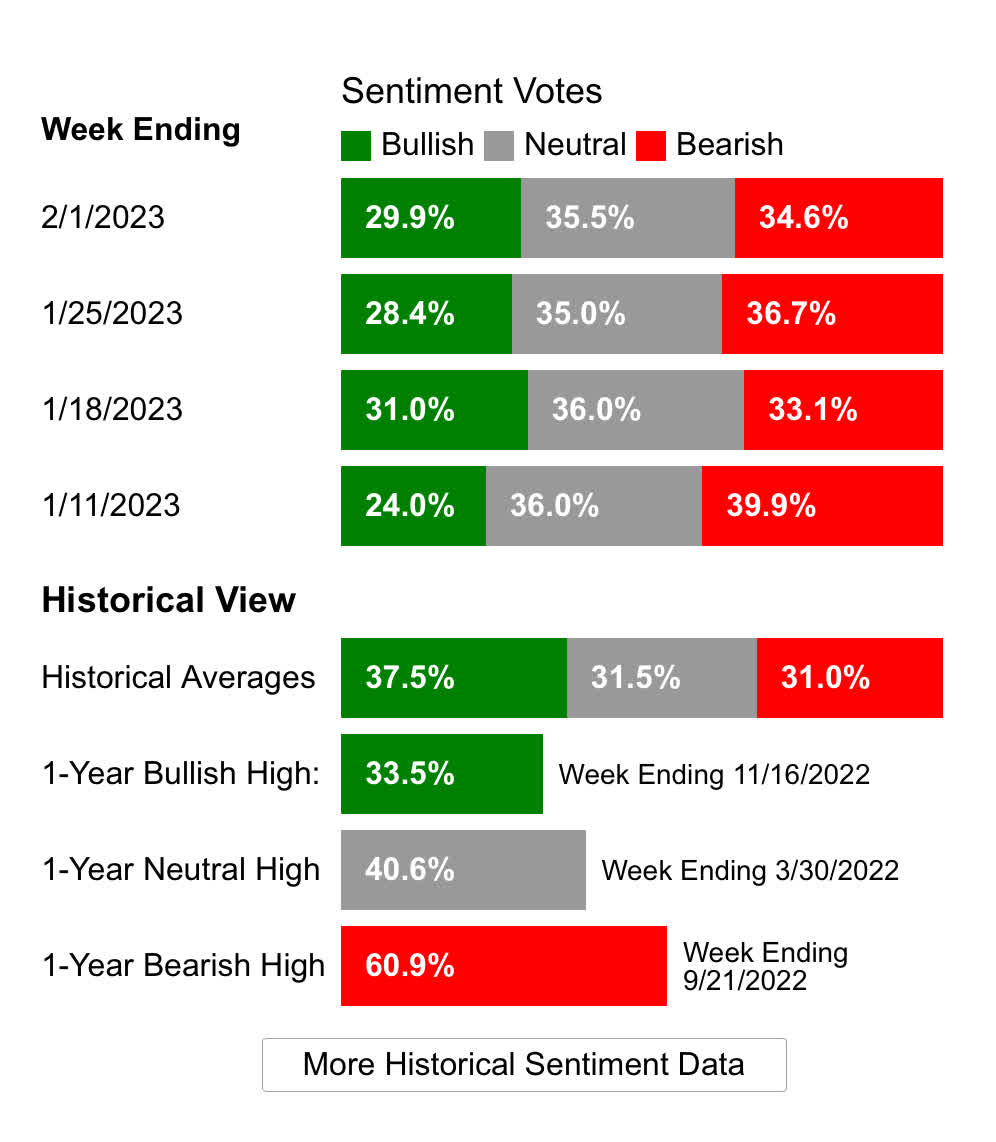
Sentiment & Positioning
Sentiment has remained bearish for a number of weeks. While I would not rely too much on sentiment, it could mean that a lot of investors are worried about a recession and are holding cash or shorting the stock market.
National Association of Active Investment Managers (NAAIM) have increased their exposure to the stock market over the past few weeks.
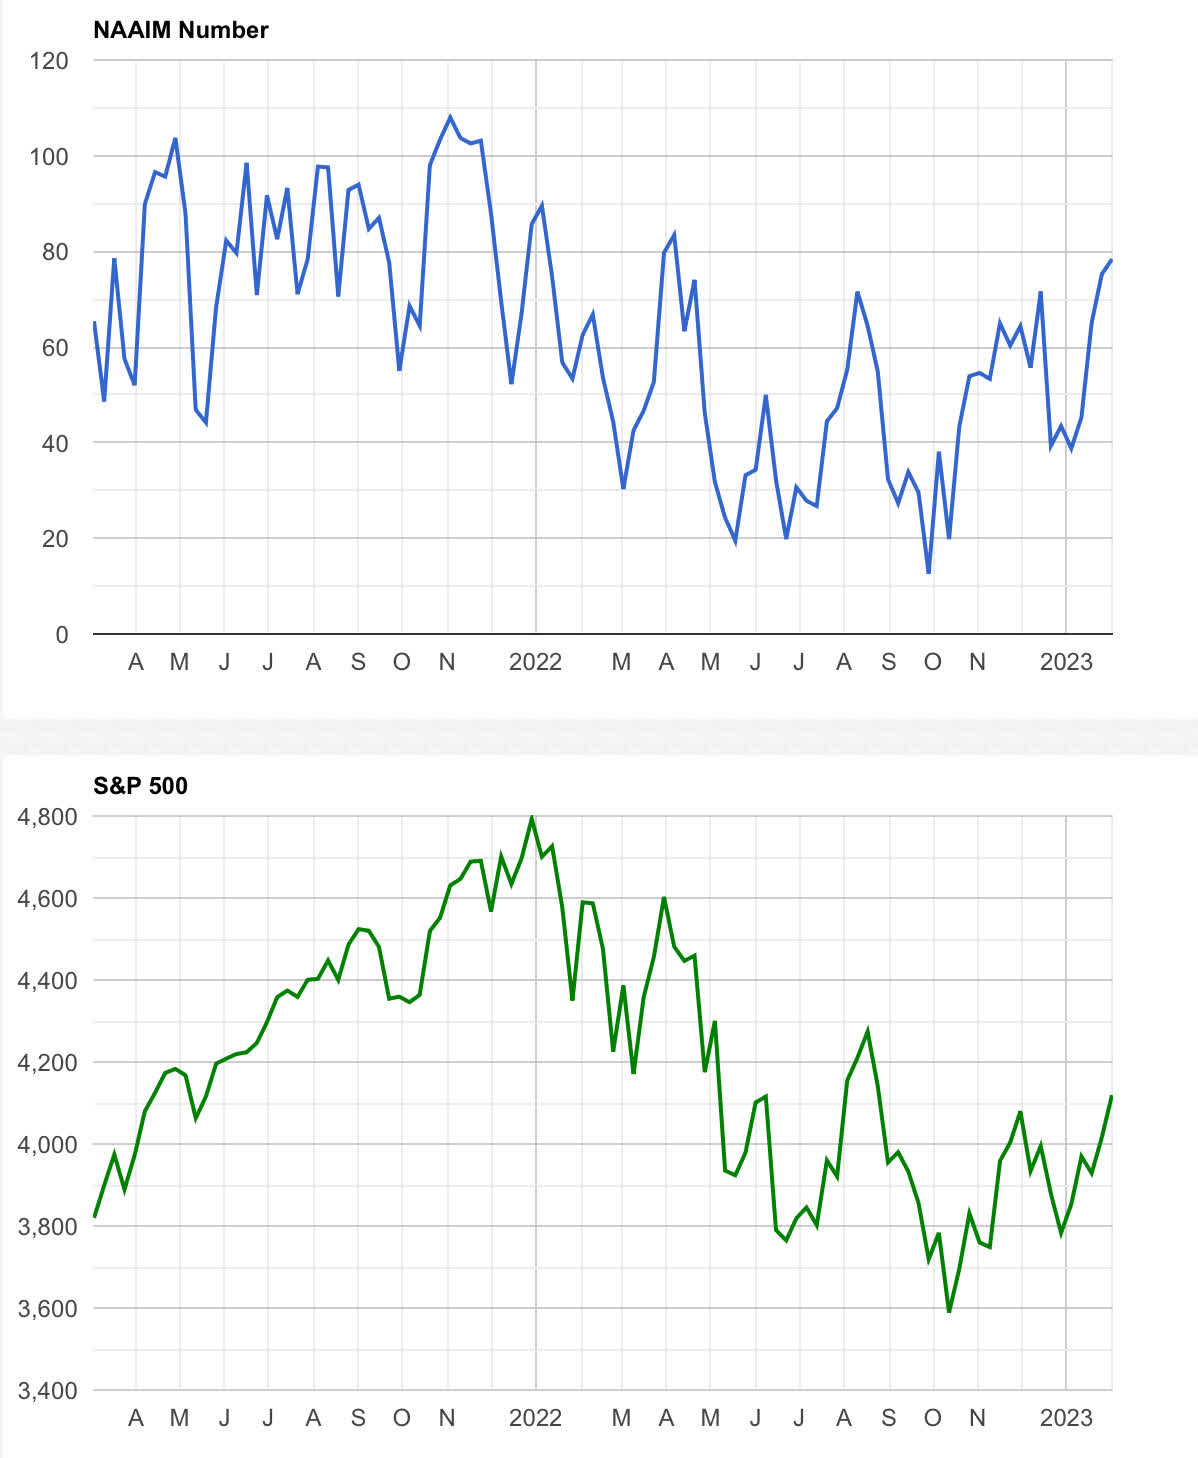
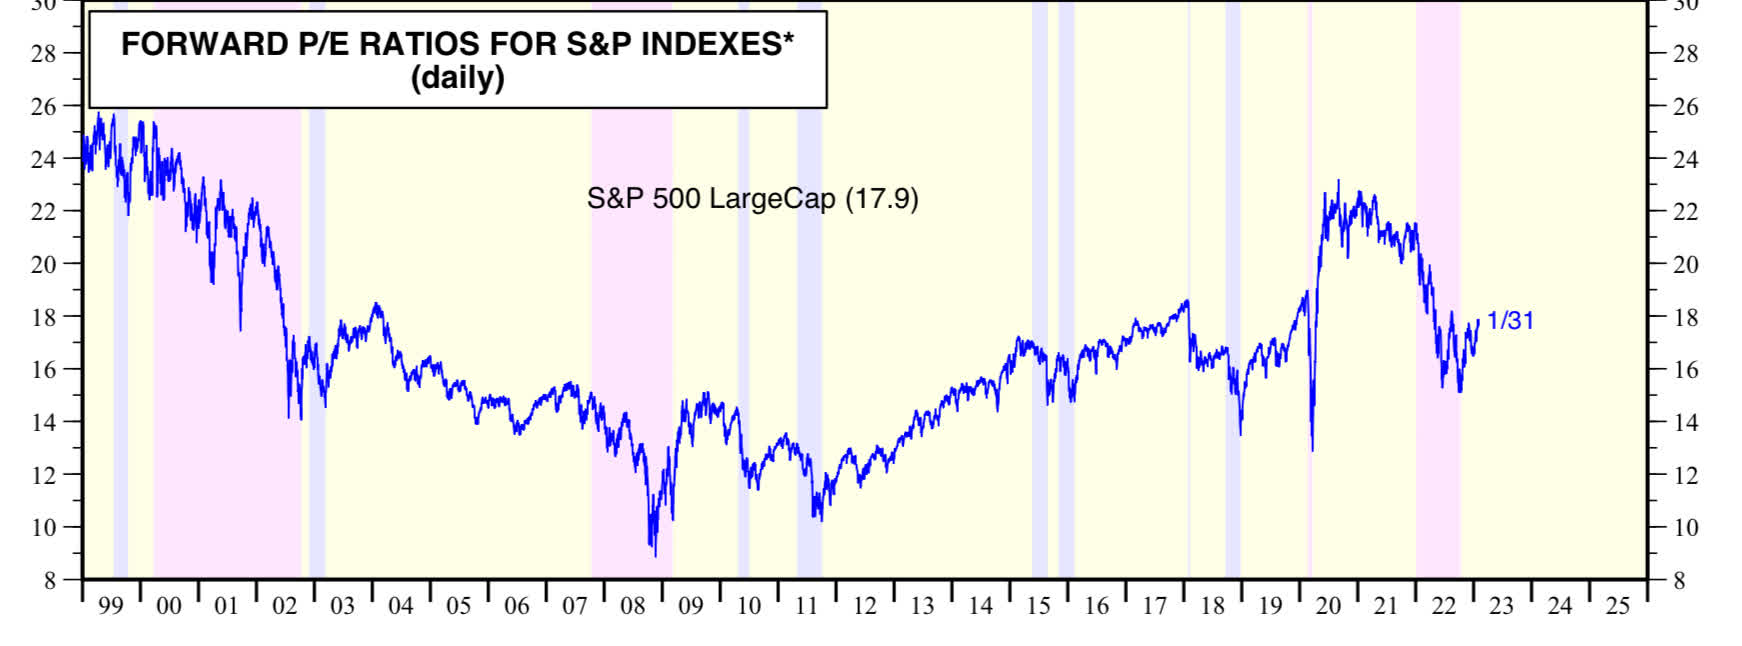
Valuation
Large-cap valuation remains high, and that is going to be a challenge for long term investors.
Mid-cap valuation is much more attractive than the large-cap.
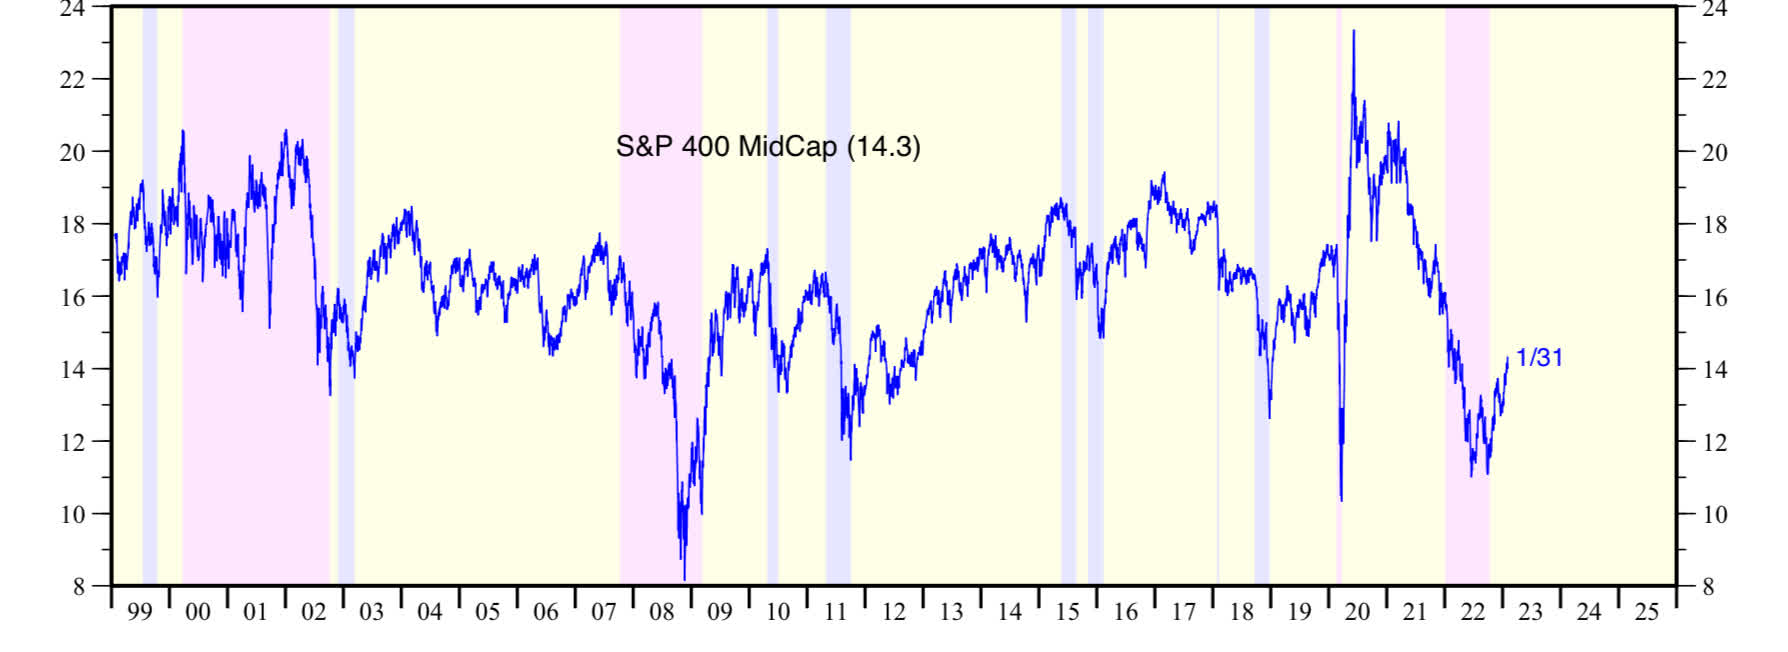
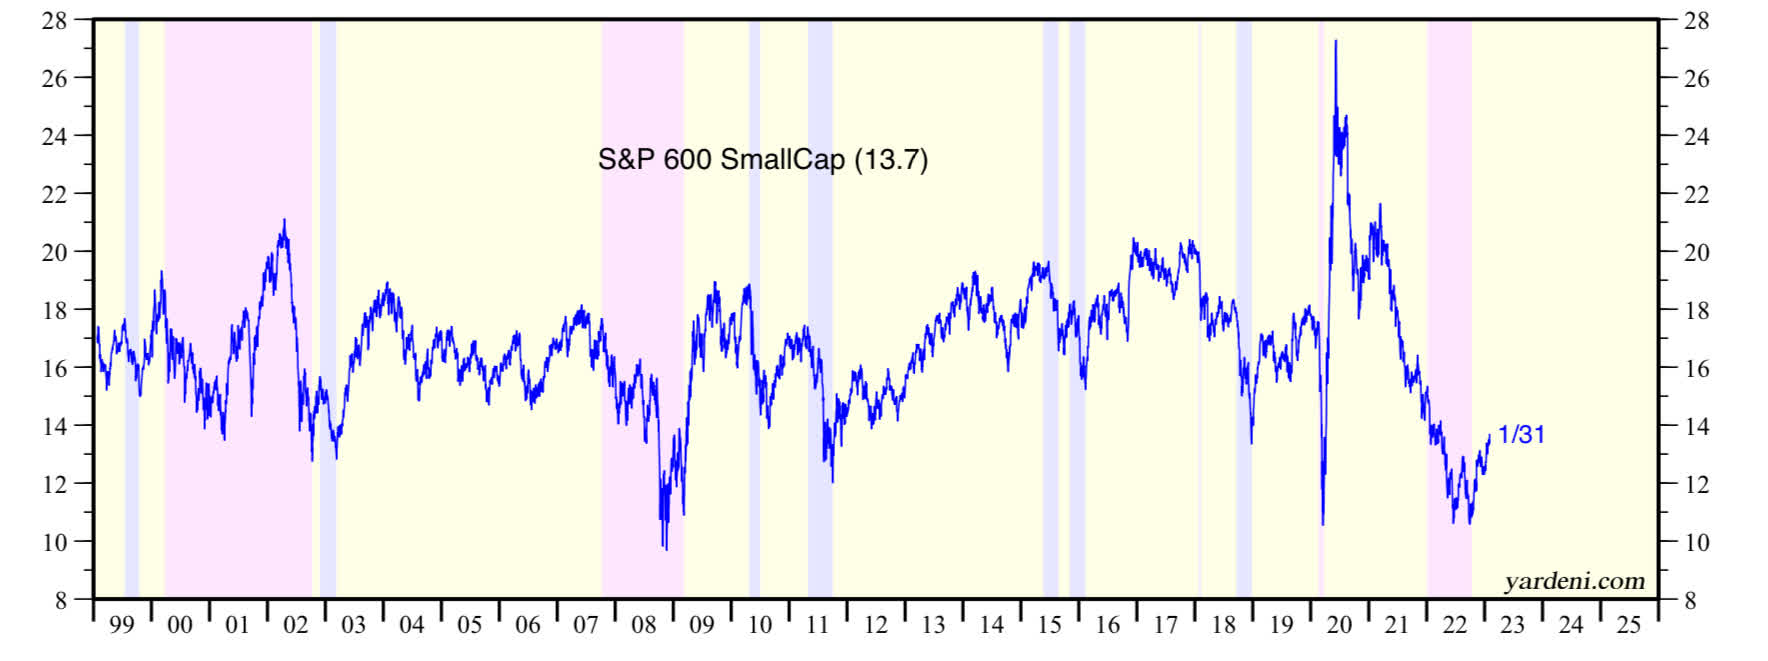
Small-cap valuation is fairly reasonable.
Don't Fight the Fed
While there is no fool-proof way to predict the "top" or "bottom" in the stock market, there are several positives factors that have come together for a possible uptrend. However, we are going to have higher interest rates, inflation could bounce back up, earnings growth is likely to be negative, US Dollar could continue its uptrend, valuations remain high, and many other reasons to be vigilant.
While the news is already factored into the stock market, equities could resume their downtrend. As long as there are no new surprises, the S&P 500 could remain in a sideways range or slowly go higher. Based on the future, there are cash flow positive stocks that have meaningfully come down to levels that make them a great time to own if one has more than a decade before needing those funds. Your feedback and input on this article would be most appreciated.
For further details see:
Early February 2023 Chart Storm (Technical Analysis)