ELV - Elevance Health: An Overlooked Healthcare Gem?
2023-10-23 17:47:51 ET
Summary
- With ELV's underlying markets growing at around 6-7% and the normalized FCF yield sitting at 6.8% at the moment, ELV should be able to deliver low double-digit returns.
- The medical membership structure and the venture into other business segments like PBM and healthcare services are similar to the market leader UnitedHealth Group.
- My DCF valuation indicates that ELV is undervalued, even when using growth rates that are lower than what I actually expect.
- The major risks are regulatory risks for the health insurance market as a whole and more regulation regarding M&A.
Introduction
A couple of months ago, I wrote a three-part series and started coverage of three big health insurance providers in the U.S.:Humana Inc. ( HUM ), UnitedHealth Group ( UNH ) and Cigna Group ( CI ). For reference, here are the links to the three articles, sorted by time of publishing:
- Humana: Recent Selloff Might Present A Buying Opportunity
- UnitedHealth Group: Attractively Priced Compounder But Regulatory Risks Remain
- Cigna Group: Weaker Than Peers But Still A Buy
I initiated coverage with a buy rating on all three companies and they did quite well compared to the wider market since then. I will refer back to these articles throughout this article.
In the comment sections of the aforementioned articles, some readers pointed out that I should also take a look at Elevance Health ( ELV ) and that they are curious about my thoughts on this company. So in this article, I will add a "bonus episode" and start coverage on Elevance Health.
I might also cover CVS Health ( CVS ), another big health insurer through its subsidiary Aetna, sometime in the future. I am kind of hesitant though since the accounting and segment reporting looks kind of chaotic which might make it very hard to assess the company in a way similar to the other four.
However, let's start with taking a look at Elevance Health.
Business Overview and Reporting
In this first section, I want to give a quick overview of what the company is doing and, even more importantly, untangle how it reports earnings for the different business segments (Elevance Health changed its segment reporting several times over the past few years due to expanding into other businesses).
As of right now, ELV reports and operates in three main segments: Health Benefits (the health insurance business), CarelonRx (the PBM business) and Carelon Services (the health services business).
The insurance business was split up into two reportable segments until 2023, the "Commercial & Specialty Business" and the "Government Business". The Government Business included Medicare, Medicaid and Federal Employees Health Benefits Program (FEHB) while the "Commercial & Specialty Business" included the commercial business and other insurance products like vision and dental insurance.
CarelonRx markets and offers PBM (Pharmacy Benefit Manager) services to affiliated customers (inside ELV) and customers outside of their own health plans (external customers). I will come back to this later. Another thing to note is that CarelonRx delegates certain PBM administrative functions, such as claims processing and prescription fulfillment, to CaremarkPCS Health, L.L.C., which is a subsidiary of CVS Health. The agreement for this is set to terminate at the end of 2024. Before that, some functions were delegated to Express Scripts which is now a part of Cigna Healthcare (I wrote about this in my Cigna article).
Carelon Services was not separately reported until this year. Until FY2022, it was reported under the "Other segment". Carelon Services offers healthcare-related services to internal customers (mainly their own insurance business) and external customers.
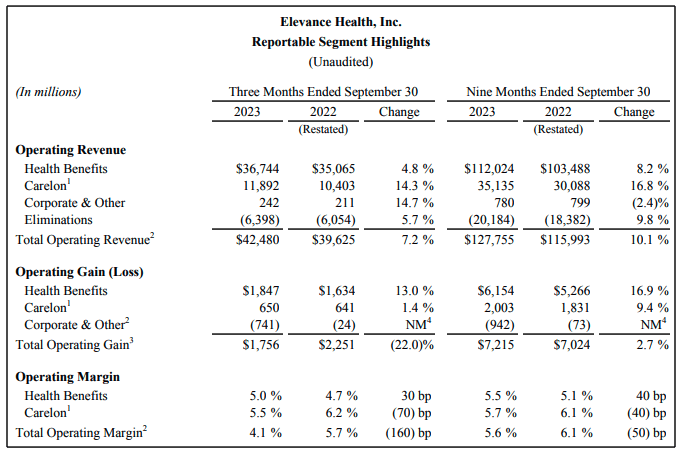
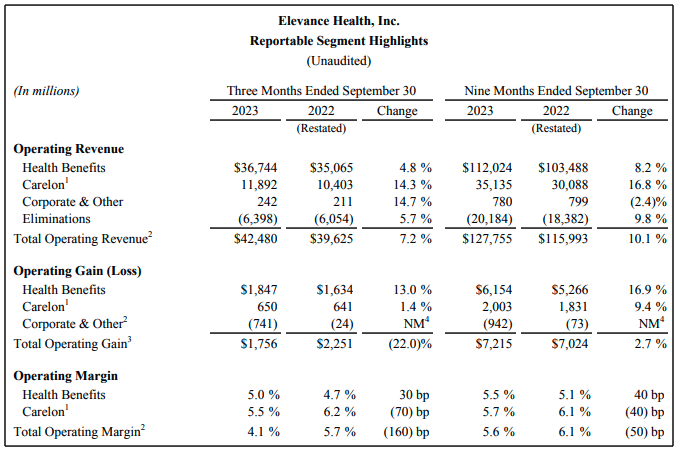
Now some words on reporting. Here is a screenshot from the latest earnings release put on October 18th:
ELV reporting (Q3 23 Earnings release)
ELV reports operating revenue which excludes net investment income and net losses/gains on financial instruments. The difference between operating revenue and total revenue is insignificant so I won't discuss this any further.
Then ELV reports what they call "Operating Gain". Operating Gain is some sort of adjusted EBIT and is derived like this:
Earnings before taxes - Investment Income +- Gains/Losses of financial instruments + interest expense + Amortization of intangibles +- gain/loss on extinguishment of debt.
I like these adjustments because they come very near to what I would do to arrive at an adjusted EBIT for this type of business, so I won't complain about the operating gain metric. I think it is very accurate.
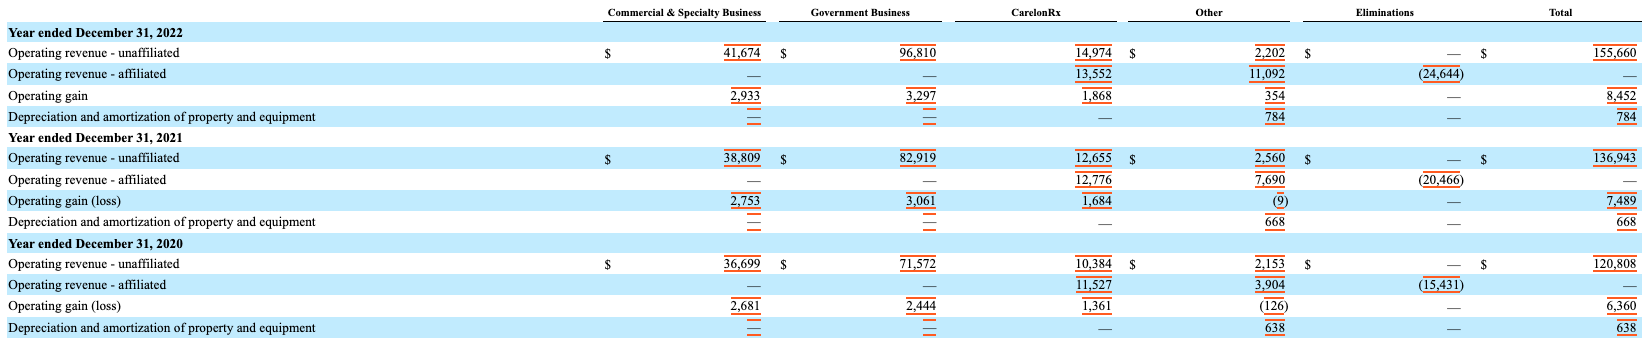
The problem is that ELV (just like all the other three healthcare companies I wrote about) only gives us one row for "Elimination" and doesn't explain what is eliminated on what level or for which segment. This is where we have to look into the 10-K/10-Q filings which I did. Here is the overview from the FY2022 10-K :
ELV Segment Reporting (ELV FY2022 10-K - Notes)
Here we can see that ELV divides the segment's revenues into unaffiliated and affiliated operating revenues. Affiliated revenues are revenues that were billed inside ELV and have to be eliminated in the consolidation process. Unaffiliated revenue is the external revenue and the revenue we should care about. As we can see, around 50% of the CarelonRx revenue is internal with only the other 50% being external revenue. The "Other" segment (which included the healthcare services in this reporting) on the other hand is mostly internal revenue (around 83% in FY2022). The insurance business doesn't bill anything towards other segments. This is the same as we have seen at Humana and UnitedHealth.
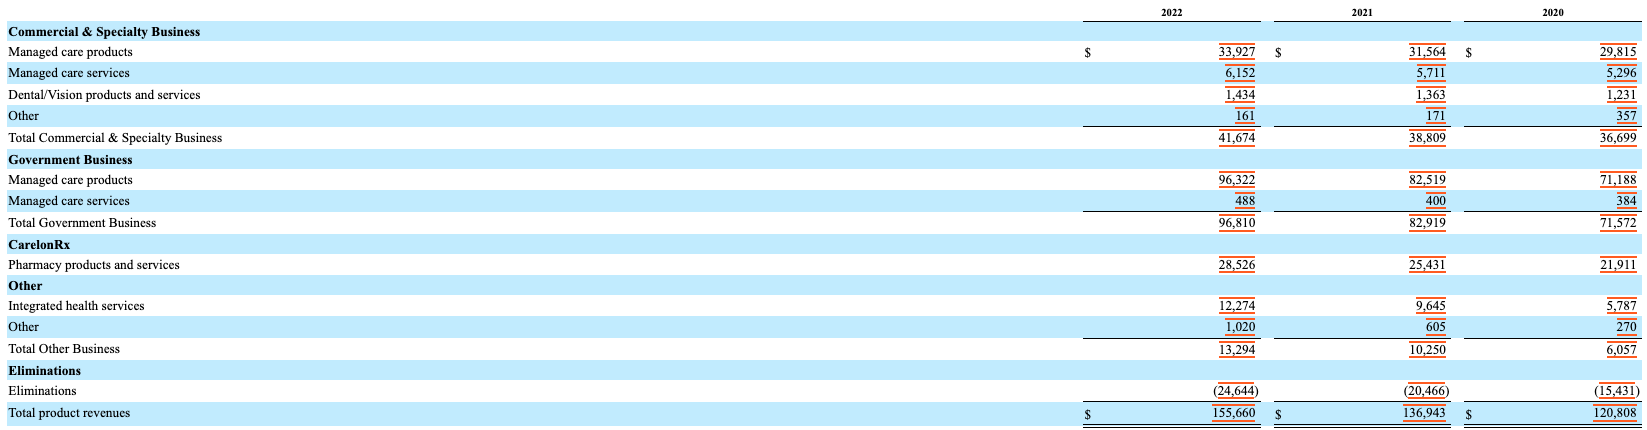
Two other important things that are only reported in the 10-K filings are (a) the composition of the insurance revenue and (b) the amount of healthcare services revenue included in the "Other" segment (only until FY22 since it has been reported separately since FY23). Here is another screenshot showing what I mean:
Revenue composition (ELV FY2022 10-K - Notes)
The insurance revenue is mainly divided into "products", "services" and "Dental/Vision". I will further discuss this later in this article when I dive deeper into the insurance business.
We can also see that "Integrated health services" made up a huge part of the "Other" segment's revenue and have been growing very fast. I will come back to this later in the chapter dedicated to the Carelon services segment.
Insurance Business
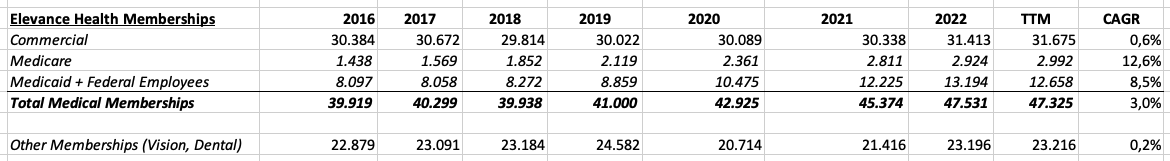
The insurance business is by far ELV's largest segment and attributed close to 75% of EBIT in FY2022. I want to start by giving an overview of the medical membership structure:
ELV medical memberships structure (Company reports - compiled by Author)
Here we can see that ELV's membership structure is well-diversified. The membership composition looks similar to UnitedHealthcare. Humana on the other hand is highly concentrated on Medicare while Cigna is very focused on "services only" memberships (I will come back to this soon). Commercial and "Other" memberships are pretty much unchanged compared to FY2016 while ELV has seen quite some membership growth in Medicare and Medicaid.
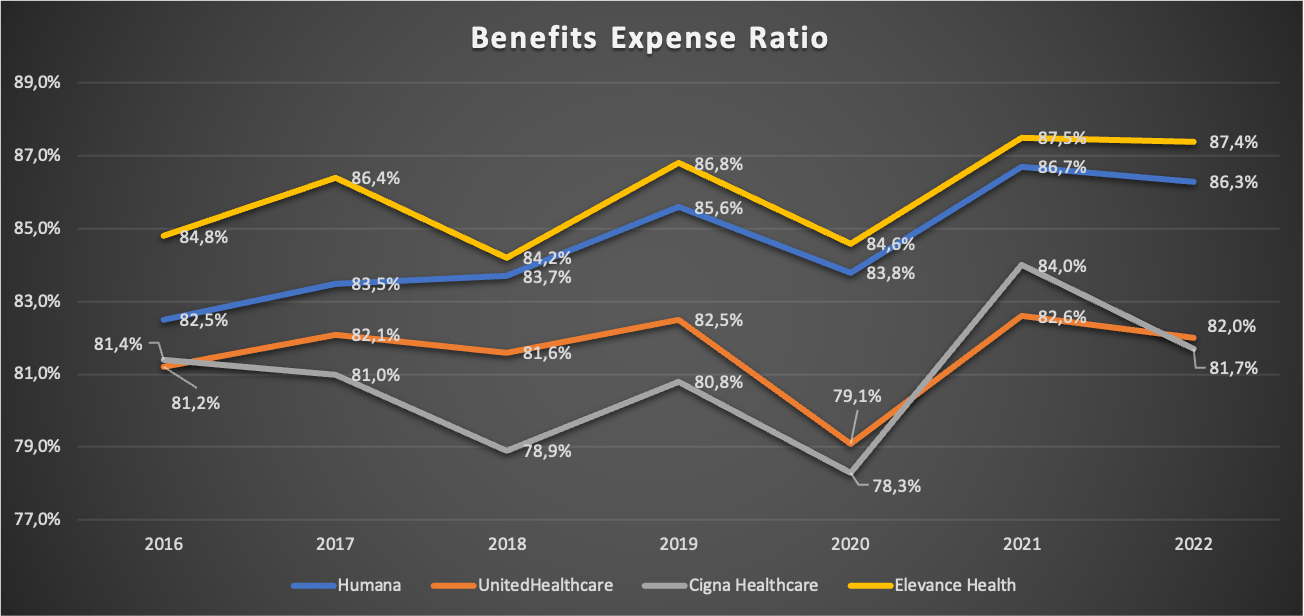
Now let's take a look at the Benefits Expense Ratio (I will just call it BER from now on) and compare it to the other three companies. As a quick reminder, this ratio describes the relationship between medical costs for the insured members to the paid premiums. So the lower this ratio is, the better. Here is a chart comparing the ratios for the four companies:
Benefits Expense Ratios FY16-FY22 (Company reports - compiled by Author)
We can see that ELV has the highest BER among the peer group so we have to ask ourselves why this is and if it is a bad sign. The BER is tightly connected to the membership structure. Medicare and Medicaid normally have a higher BER as we can see by the highly Medicare-concentrated Humana and Molina Healthcare ( MOH ) which is highly concentrated in Medicaid and reported a BER above 88% in FY22. With ELV having around 30% of memberships in Medicare and Medicaid, the BER will naturally be higher. However, UNH also has close to 40% membership exposure in Medicare and Medicaid. So why does UNH report a BER that is around 500 basis points lower?
I am not 100% sure but I think the reason is that ELV operates as a licensee of the Blue Cross and Blue Shield Association ("BCBSA") in several states. If I understand it correctly, Internal Revenue Code §833 allows for some tax benefits for BCBSA companies as long as their BER is not less than 85% (§833(c)(s)). Assuming that BCBSA memberships make up a large part of ELV commercial memberships, that would explain why the overall BER is so much higher compared to UNH. If this is true, the higher BER is nothing to worry about. If you are an expert on this topic reading this, feel free to share your knowledge in the comment section. I am really curious.
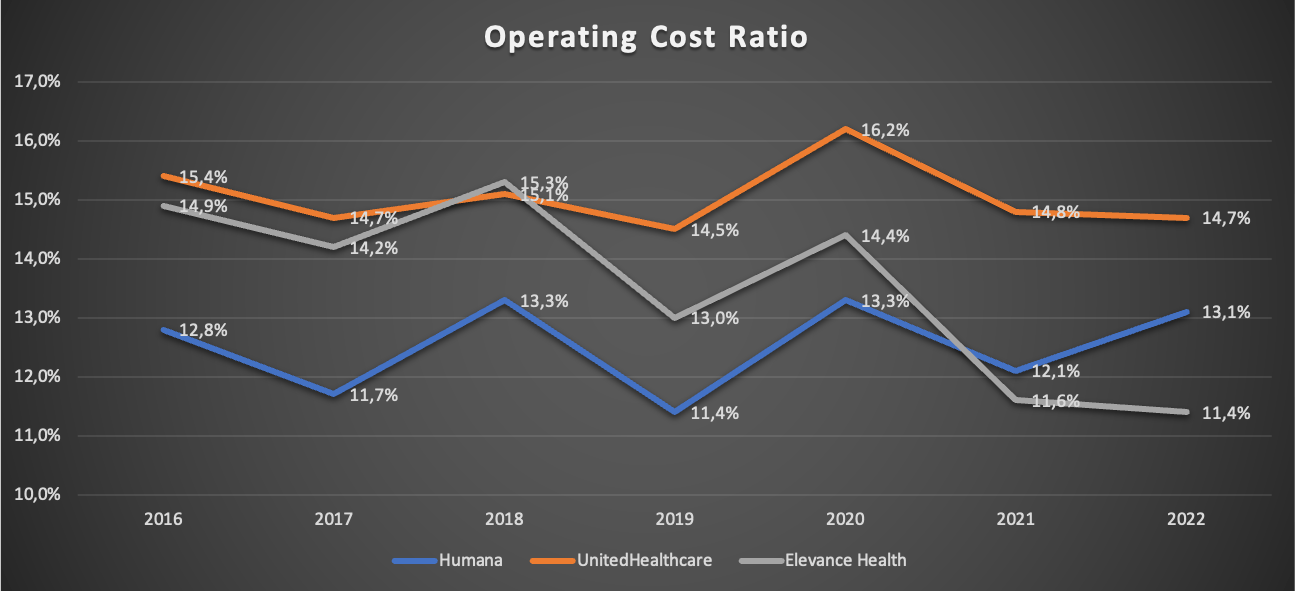
Now let us turn to another ratio, the Operating Cost Ratio ((OCR)). Here is a chart showing the OCR for ELV, HUM and UNH for FY2016-FY2022:
Operating Cost Ratio FY16-FY22 (Company reports - compiled by Author)
I left Cigna out on purpose. The reason for this is that Cigna has a very high focus on services-only memberships which drives the OCR much higher (Cigna reported an OCR of 21.9% in FY22). The more services-only memberships, the higher the OCR.
Quick reminder: Services-only refers to the company only doing administrative services like handling claims without assuming the risk of both medical and administrative costs for its customers.
In the above chart, we can see that ELV managed to bring the OCR down consistently from 14.9% in FY16 to only 11.4% in FY22. For FY23, ELV guided for an OCR of 11.2% +- 50 basis points, signaling that this trend might continue. The reasons for the declining OCR are that (a) services-only memberships/revenues grew slower than "normal" memberships/revenues so that services-only now makes up a lower % of total memberships/revenues, (b) expense leverage due to top-line growth (ELV doubled revenues from FY16 to FY22) and (c) the repeal of the health insurer tax in 2021.
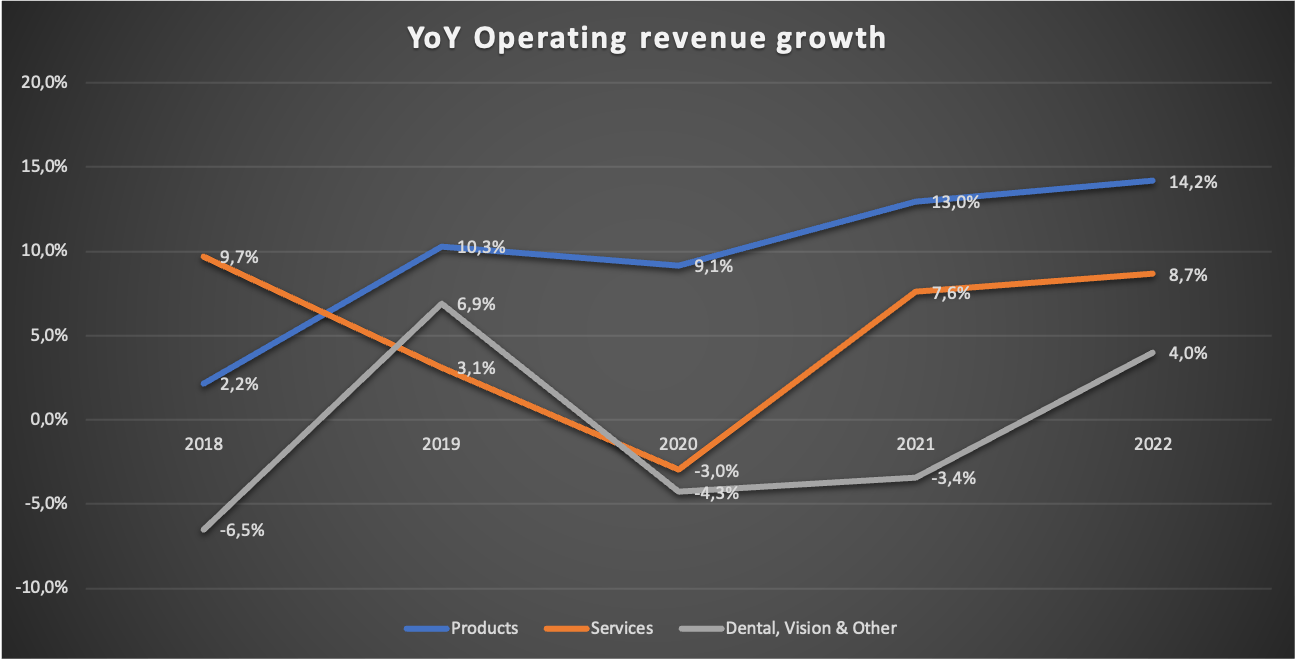
Since I am already at the topic, here is a chart showing the operating revenue growth rates for the different parts of the insurance business:
YoY revenue growth (Company reports - compiled by Author)
FY22 Dental, Vision & Other revenues are lower than in FY16 which is why I won't focus on these in this article. Products revenue far outpaced the growth rates of services. This makes sense since we have already seen that the membership growth solely took place in the Medicare and Medicaid space.
To close this section, I need to make some comments regarding further growth prospects for this segment. The membership structure is comparable to UnitedHealthcare, so everything I said regarding this in my UNH article also holds here. In that article, I argued that since UNH caters to all age ranges, organic growth excluding pricing power should be at least equal to the growth of the population ages around 18-85 (basically the U.S. working force plus the Medicare-eligible population). I will repeat the table I used as a source here:
U.S. Population projection by age group (U.S. Census Bureau)
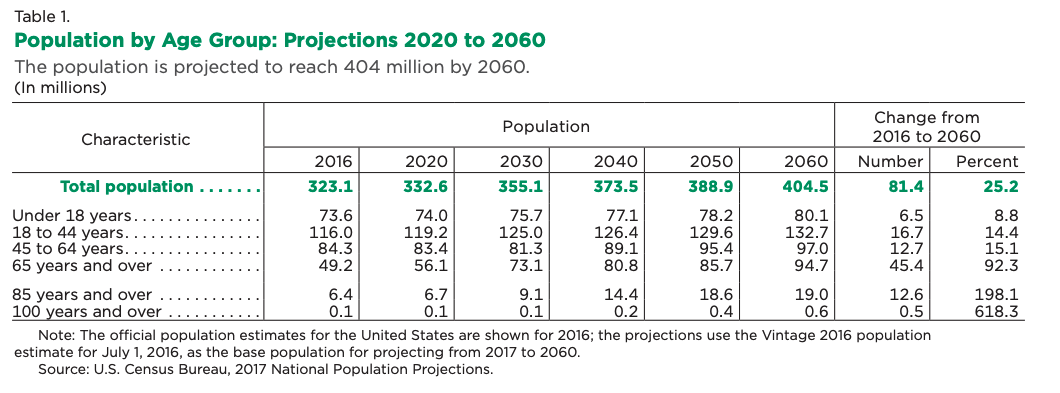
Here is what I wrote in my UNH article:
"If we only take the age ranges 18-44, 45-64 and 65-85, the CAGR from 2020 to 2030 is a meager 0.71%. Nothing to be excited about. Taking into account that Medicare has been UNH's fastest-growing segment, we might be able to project organic growth excluding price increases of around 2% (assuming zero market share gains/losses).
Regarding pricing power, I will again assume that price increases a bit above GDP growth seems reasonable. With GDP growth around 2-3%, 4% growth through price increases seems reasonable to me. Combined with the aforementioned 2% TAM growth, I think 6% organic growth seems reasonable and conservative (again: all of this assumes zero market share gains/losses)."
Source: Author's UNH article
From FY16-FY22, ELV medical membership CAGR came in at 3%, a bit above my aforementioned 2% assumption (UNH grew medical memberships at 2.1% from FY16-FY22). I will just be conservative and assume 2% membership growth in the future. Combined with my assumed 4% growth through pricing power, the insurance segment might deliver top-line growth of around 6% well into the future. This is assuming no market share gains/losses.
PBM Business
The PBM business was first reported in the FY2020 10-K and was then called IngenioRx. It was renamed to CarelonRx in FY2022 and since FY2023 it is reported as one segment under the Carelon segment (besides Carelon services). PBM is the abbreviation for pharmacy benefit manager. A PBM administers your pharmacy plan, negotiates with drug companies for the best medication prices and processes pharmacy claims.
I want to start with a table showing total external, internal and total PBM revenue since it started being reported in FY2019 (in ):
| FY |
| Total |
| Internal |
| External |
| 2019 |
| 5,402 |
| 3,395 |
| 2,007 |
| 2020 |
| 21,911 |
| 11,527 |
| 10,384 |
| 2021 |
| 25,431 |
| 12,776 |
| 12,655 |
| 2022 |
| 28,526 |
| 13,552 |
| 14,974 |
| TTM |
| 32,531 |
| 14,336 |
| 18,195 |
External revenue grew from $2,007 million in FY2019 to $18,195 million for the trailing twelve months ((TTM)), an astounding growth rate due to ELV just starting in this business segment. TTM EBIT (defined as the operating gain I highlighted at the start of this article) stands at $1,960 million, making up above 20% of consolidated EBIT. The fact that ELV was able to integrate and scale this business to such a level in a matter of only five years is very impressive. We might see some more years of elevated growth here before it slows down to market growth levels.
Regarding market growth levels, here is what I wrote about my assumptions regarding PBM growth in the future in my UNH article:
"In my most recent article, I outlined that the elderly population (the ones who should make up the largest part of pharmacy spending) in the US is expected to grow with a CAGR of 3.6% until 2030. Additionally, I guessed that the pricing power for such non-discretionary spending should allow for price increases a bit above GDP growth at around 4%. This would result in around 7.6% growth in the future. Interestingly, this is exactly the kind of growth Optum Rx has been able to achieve over the past five years. External revenue grew from $26,801 million in 2017 to $38,837 million in 2022 (CAGR: 7.7%)."
Source: Author's UNH article
With UNH being at around 20% market share, it is pretty safe to say that UNH is pretty saturated in the PBM space, unlike ELV which is just starting. I think we may see low double-digit growth here for a few more years before growth rates come down toward the mid-single digits.
Health Services Business
Before 2023, the health services segment was reported inside the "Other" segment. Since then, it has been reported as Carelon services as one branch under the Carelon banner. Carelon Services has the most exciting prospects out of all of ELV's business segments. For simplicity's sake, I will just add the Carelon services and the other revenues together. Here is a table showing health services (also split into internal and external revenues) growth since they were first reported in FY2018 (in $ million):
| FY |
| Total |
| Internal |
| External |
| 2018 |
| 1,519 |
| 1,308 |
| 211 |
| 2019 |
| 2,293 |
| 1,212 |
| 1,081 |
| 2020 |
| 6,057 |
| 3,904 |
| 2,153 |
| 2021 |
| 10,250 |
| 7,690 |
| 2,560 |
| 2022 |
| 13,294 |
| 11,092 |
| 2,202 |
| TTM |
| 14,317 |
| 12,012 |
| 2,305 |
Here we can see that while internal revenue grew very fast over the past few years, external revenue has been close to stagnant since FY19. At the beginning of this article, I said that we should only care about external revenue. So what is the point of growing a new segment and only bill towards your own insurance business? Here is what I wrote regarding this topic in my HUM article :
"What does Humana get out of all these interconnections between their two business segments? I think a good comparison is what Nike ( NKE ) has been doing in the past: cutting out parts of the value chain from how a product goes until it reaches the consumer. If Nike sells shoes directly to the consumer, it cuts out the margin that an intermediary like a retail outlet would take if it were to sell these shoes in Nike's place. Humana basically does the same. By offering the needed healthcare services itself and cutting out the margins of healthcare service providers, it can either (a) lower prices for premiums, ultimately making the main insurance products more attractive to the consumer or (b) keep the premiums unchanged and improve margins."
Source: Authors's HUM article
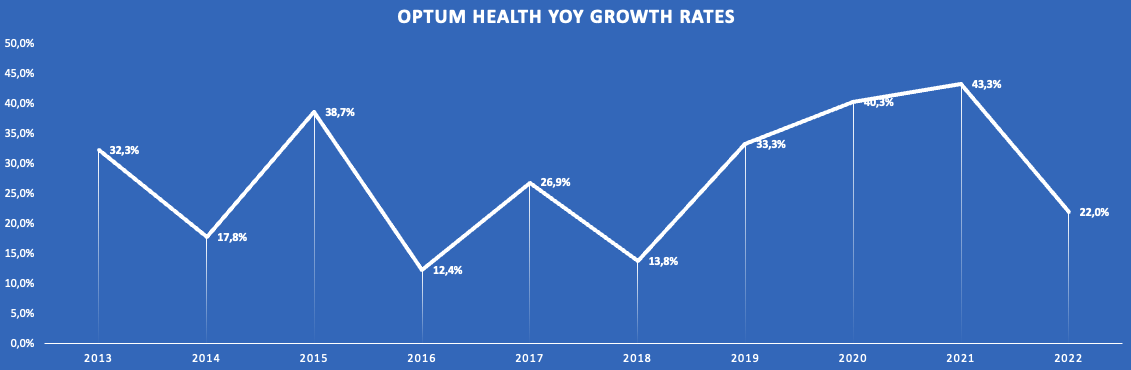
ELV benefits from either kind of revenue. However, I still think what we should look out for is external revenue growth and I would like to see more external revenue growth in the next couple of years. Here is the chart I used in my UNH article showing YoY external growth rates for the Optum Health segment which is comparable to Carelon Services:
Optum Health YoY revenue growth rates (Company reports - compiled by Author)
Now I don't say that ELV will be able to achieve similar growth rates in the future but this shows the possibilities entering the health services market offers to ELV. UNH achieved these growth rates through many M&A deals. It remains to be seen if ELV chooses to pursue the same path (which might be more difficult now due to regulatory reasons I will cover later in the risks section) or prioritizes organic growth.
Regarding future growth prospects, I will again use the 2022 study by McKinsey . McKinsey projected Healthcare provider EBITDA to increase from $249 billion in 2021 to $325 billion in 2025, a CAGR of around 7%. I think a growth CAGR of 7% or a bit lower seems reasonable going forward. This also matches my assumption of around 7% revenue growth potential in the PBM business.
Financials
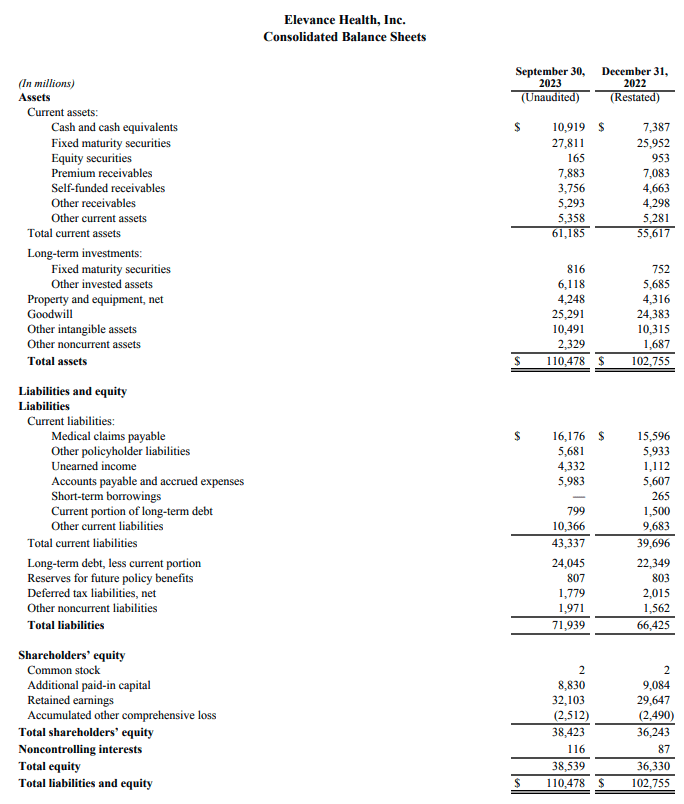
Now I want to turn to the financials and I will start with the balance sheet. Here is a screenshot from the latest Q3 23 earnings release showing the latest balance sheet:
Q3 2023 Balance sheet (Q3 2023 Earnings release)
ELV has $10.9 billion in cash and equivalents, $0.8 billion of current debt and $24 billion in long-term debt. This would result in a net debt position of $13.9 billion. According to Tikr (which uses S&P Capital IQ), net debt currently stands at $14.8 billion. I guess there are some other long-term liabilities included in these $14.8 billion. Compared to $8.6 billion EBIT, $7.8 billion in adjusted net income and $8 billion in Free Cash Flow ((FCF)) for the TTM, net debt sits around two times ELV earnings power. The debt level is much higher than for UNH (debt is less than one year of earnings) and HUM (Humana has $4 billion net cash on the balance sheet) which might explain the valuation discount to these two. Still, net debt to earnings power of two times is comfortable overall. So I am neither overly excited nor concerned about ELV balance sheet.
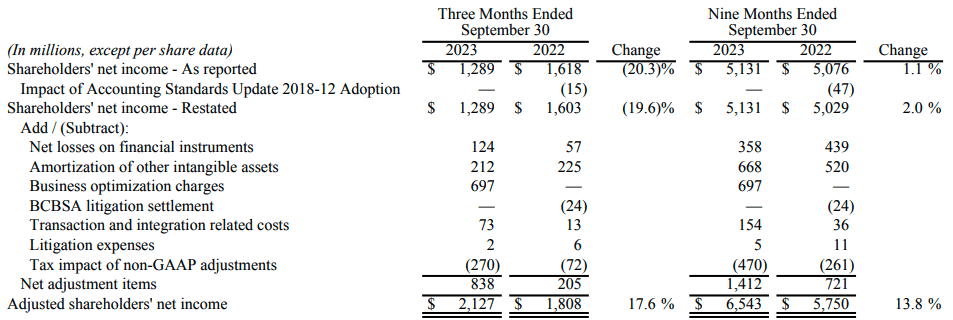
Now let's turn to consolidated financials. I want to start by addressing ELV's way of reporting adjusted net income. I highlighted earlier that I think the adjustments ELV makes to arrive at Operating Gain (adjusted EBIT) make sense and there is nothing to nag about this. Sadly, the same isn't true for adjusted net income. Let me show you by using the latest Q3 23 earnings release as an example:
Adjusted net income definition (Q3 23 Earnings release)
It starts by adjusting some accounting standard changes (fine), net losses on financial instruments (fine) and Amortization on intangibles (fine). Then $697 million of "Business optimization charges" are adjusted for just one quarter. Here is what ELV writes regarding these charges:
" In the third quarter, we completed a strategic review of our operations, assets, and investments to enhance operating efficiency, refine the focus of our investments in innovation and optimize our physical footprint. This resulted in a net charge of $697 million, comprised of the write-off of certain information technology assets and contract exit costs, a reduction in staff including the relocation of certain job functions, and the impairment of assets associated with the closure or partial closure of data centers and offices. "
Source: Q3 23 Earnings release
So the adjustments included some write-offs related to internal IT projects that were stopped ($446 million according to the 10-Q filing) and some personal reduction costs ($230 million according to the 10-Q filing).
How is this not a cost? The money for the internal IT projects is already gone and might as well have been accounted for as R&D costs. The severance packages are supposed to be paid through 2024, so cash is leaving the company. The amount of the charge is also not negligible at one-third of Q3 23 net income. While I do understand that this is a one-time expense, it still is an expense that is incurred by the operating business, unlike something like tax changes which you simply can't control. ELV also adjusted Business optimization charges for FY21 ($187 million) and FY20 ($653 million). If you have to adjust for Business optimization charges year after year, isn't it a recurring cost that should be treated as such?
This is why I will use Operating Gain (EBIT) and FCF for valuation and all other purposes instead of adjusted net income.
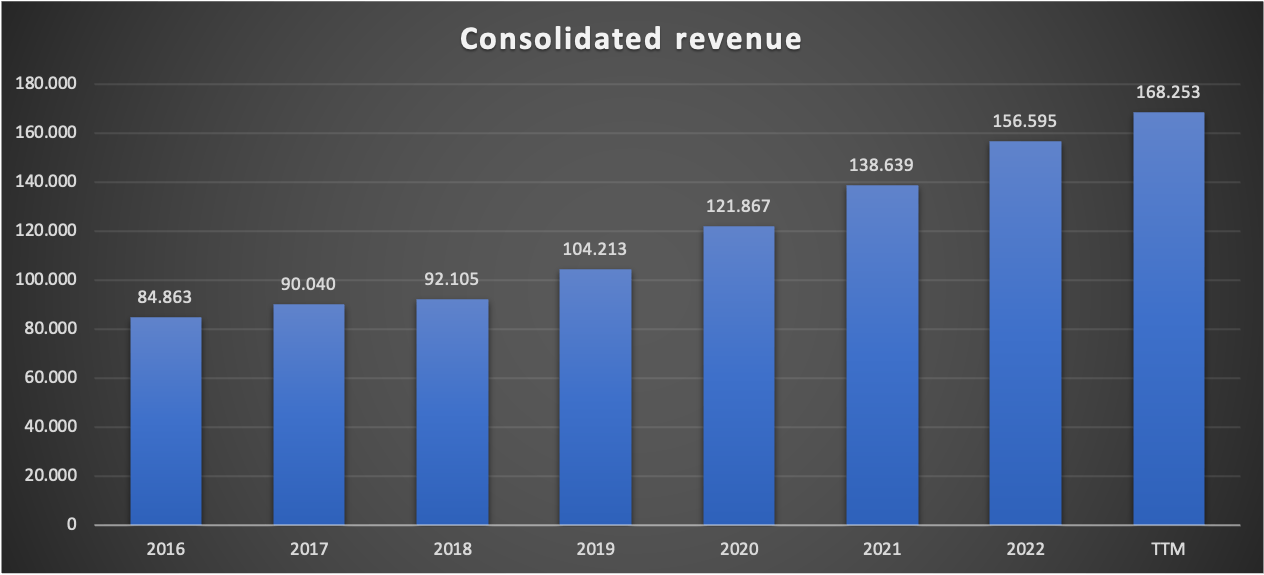
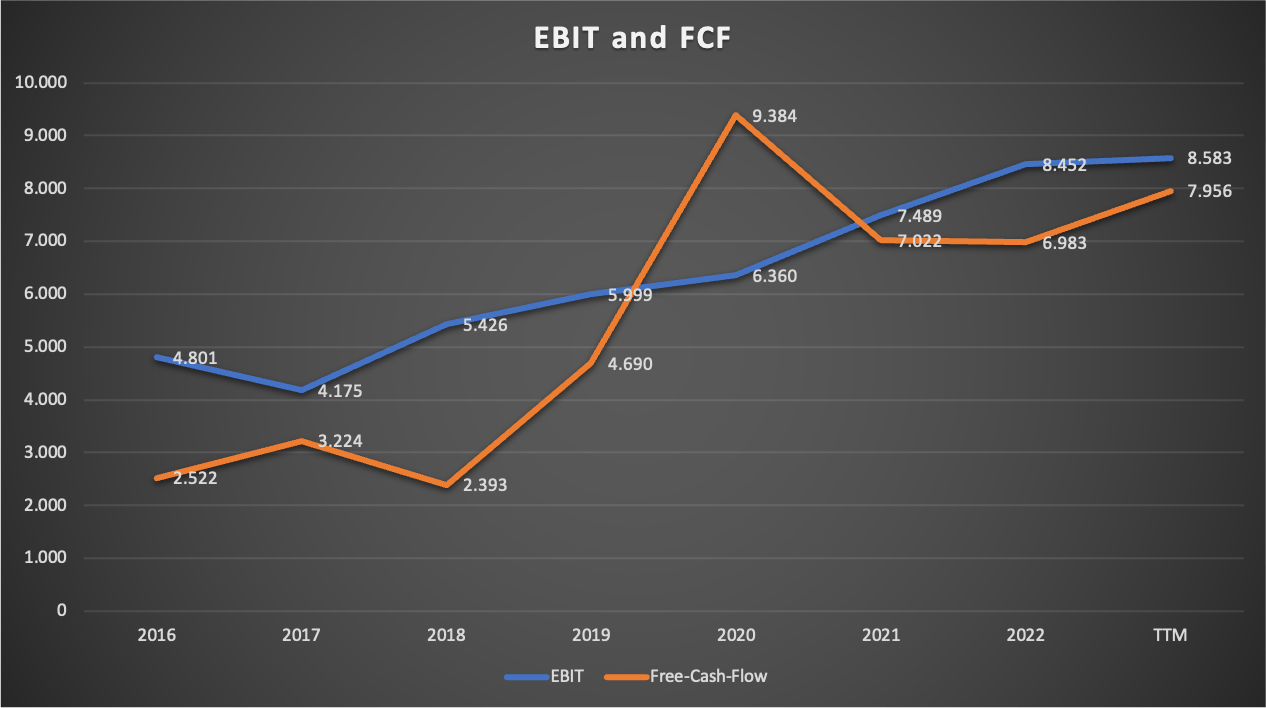
Now here are two charts showing revenue, EBIT and FCF since FY16:
ELV Consolidated revenue since FY16 (Company reports - compiled by Author) ELV Consolidated EBIT and FCF since FY16 (Company reports - compiled by Author)
Revenue grew from $84,863 million in FY16 to $156,595 million in FY22 (CAGR 10.75%). EBIT and FCF grew with a CAGR of 9.88% and 18.5% respectively. We can see that FCF is much more volatile than EBIT, something we have already seen at all other health insurance companies I covered so far.
In conclusion, revenue and earnings growth was very good and very steady. Nothing to complain about here.
In FY22 (where there were close to no Business optimization charges), return on equity (RoE), defined by adjusted net income divided by the balance sheet equity, came in at 19.4%. For comparison: UNH posted RoE of 25.9% while Humana reached 20.9%. UNH's higher RoE is attributable to the bigger part of non-insurance earnings. For a (mainly) insurance business, RoE in the range of around 20% is very good.
Recent results
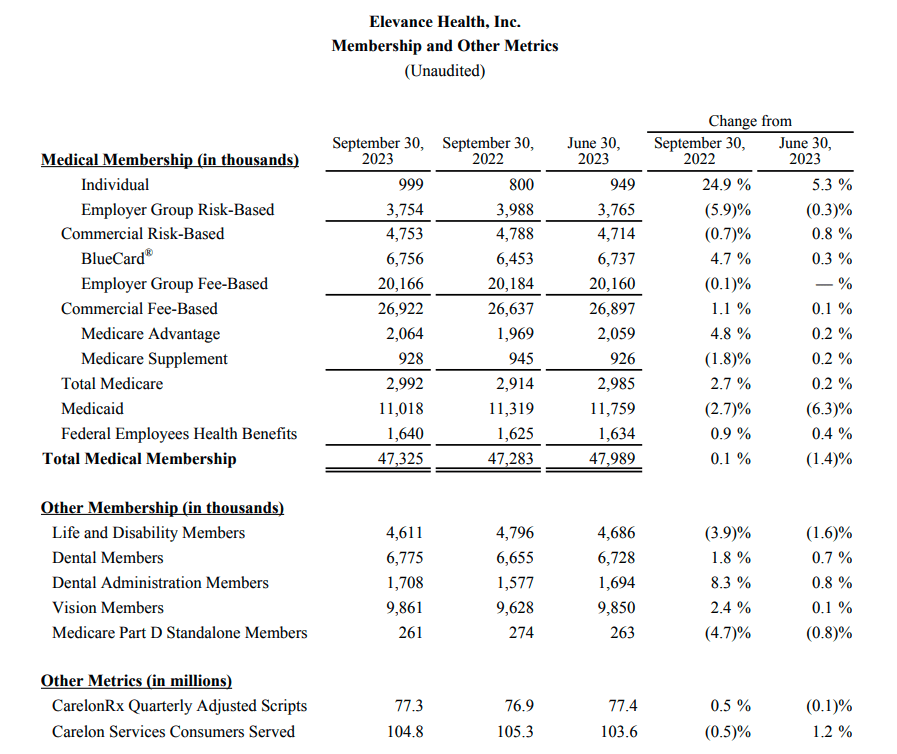
While I already included the latest results for Q3 23, which were reported last Wednesday, in my above numbers, I still want to address them real quick. Here is the overview of the memberships and some other important metrics:
Q3 23 Membership and other metrics (ELV Q3 23 Earnings release)
Nearly everything was flat YoY. Total medical memberships only grew by 0.1% YoY, CarelonRx Quarterly Adjusted Scripts only increased by 0.5% YoY and Carelon Services Consumers Served declined by 0.5% YoY. This looks pretty depressing.
Meanwhile, operating revenue grew by 7.2% and Operating Gain grew by 12.2% if we were to exclude the business optimization charges and some other integration costs, as we can see in the following snippet from the Q3 23 earnings release:
Q3 23 Highlights (Q3 23 Earnings release)
This shows the pricing power companies like ELV have. Despite no membership and prescription growth, ELV is still able to pull off 7% top-line growth, probably solely due to pricing power. Impressive.
Valuation
There are currently 237.8 million shares outstanding at the current price of $453.78 per share, resulting in a market capitalization of $107.9 billion. Compared to TTM FCF EBIT of $8.6 billion and TTM FCF of $8 billion, ELV currently trades at around 12.5 times EBIT and 13.5 times FCF (or a FCF yield of around 7.4%).
Since FCF has been volatile in the past, we have to gauge a normalized FCF. I normally use the cash-conversion rate, defined as FCF divided by (adjusted) net income. I replaced the net income with EBIT this time, which resulted in a ratio of 85% FCF compared to EBIT as an average for the fiscal years 2016-2022. So normalized FCF should be around 85% x $8.6 billion EBIT = $7.3 billion. If I were to use the same approach using adjusted net income, normalized FCF would be around $8.1 billion, so my approach seems quite conservative.
With a normalized FCF of $7.3 billion, the current FCF yield would be around 6.8%. I always repeat that the long-term return potential of any stock, disregarding valuation changes, should be the sum of the FCF yield and the FCF growth rate.
Throughout this article, I made the following assumptions regarding earnings growth for ELV segments:
- Insurance: 6%
- PBM: 7%
- Health Services: 7%
I also think that PBM and Health Services might deliver higher growth rates over the next few years due to the smaller scale compared to peers before leveling down towards the above growth rates. Assuming 6% earnings growth, ELV should be able to deliver 6% + 6.8% = 12.8% returns. This assumes no changes in market share and no changes in valuation multiples.
DCF valuation
To assess the possible effects of valuation changes, I will perform a supplemental DCF valuation. With the aforementioned FCF yield of 6.8% and the current share price of $453.78, normalized FCF per share should come in at around $30.86 per share. I will use a 10% discount rate and assume 5% earnings growth over the next 10 years (lower than the 6% I expect) and 3% growth into perpetuity (I expect closer to 4%). Here is the result:
DCF valuation (moneychimp.com)
Using my already lowered assumptions, ELV is still undervalued with an upside potential of around 16%.
Risks
Risks for ELV are pretty similar to the risks I outlined for UNH.
(1) Insurance
Health insurance is a market that is very vulnerable to regulations. This is also the reason why health insurance companies trade for lower valuation multiples compared to other sectors, especially when you take into account the growth rates we have seen in the past. For the insurance business, several possible regulations might impact ELV negatively:
- Drug price regulation: Regulations for lower drug prices would force health insurers to lower premiums because they have to operate in a certain range of benefits expense ratios. When expenses and premiums decline, health insurers will be hit on the top and bottom lines.
- Healthcare system changes: The biggest threat is the possibility of a switch from the multi-payer model to a single-payer model. In a single-payer system, everyone has health insurance under a one health insurance plan and has access to necessary services. While it wouldn't make health insurers completely obsolete, it would hurt the business model a lot.
- Medical care ratio regulation: Currently, health insurers are forced to stay in a certain range regarding the ratio of medical expenses to premiums. This ratio currently sits at 80% of premium revenues for individual and small-group markets. If this ratio is increased to let's say 90%, the margin between premiums and expenses would be halved. This would be disastrous for the bottom line of all health insurers.
I already highlighted in my first article on HUM that I think these risks are pretty low due to (a) opposing lobbies and (b) the requirement for political consensus. For ELV, risks like medical care ratio regulation are even smaller because the BER already sits well above 85%.
(2) PBM & Health Services
Earlier I said that Carelon Services might be the biggest growth driver going forward because if we look at what UNH has achieved over the past decade with Optum Health, there should be much room for ELV to grow from a small base. Risks for these segments are tied to M&A regulation. In the middle of this year, there were news reports that the U.S. Justice Department started a monopoly probe of the managed-care industry. The PBM space might also face more regulations according to this SA news report .
This might limit the possibilities for ELV to make accretive bolt-on M&A deals in these spaces which we might already see right now. According to this SA news report , ELV and Blue Cross Blue Shield of Louisiana had to put a merger on hold due to raised concerns from lawmakers and policymakers.
ELV might only be able to grow in line with the underlying industry growth at around 7% as I described in this article.
Conclusion
ELV has a very well-diversified medical membership structure comparable to the industry leader UNH. Compared to other peers like HUM and CI, this makes them less reliant on a single type of medical membership. ELV has the weakest BER due to the low exposure to services-only memberships and the fact that it has to keep a higher BER because it operates as a licensee of the Blue Cross and Blue Shield Association ("BCBSA").
ELV only started to diversify into PBM in FY2019 and health services in FY2018. If we take UNH as a blueprint for this, ELV might make these segments a large part of its business over the next five to ten years. It remains to be seen if management can pull this off.
ELV underlying markets are growing at around 6-7%. Coupled with the normalized FCF yield of around 6.8%, I think ELV can deliver returns in the low double-digits for the foreseeable future. My DCF valuation, where I used even smaller growth rates than I think are reasonable, indicates that ELV is undervalued at the current price of $453.78.
Therefore, I initiate coverage on ELV with a buy rating.
For further details see:
Elevance Health: An Overlooked Healthcare Gem?