WMB - Energy Transfer: Undervaluation And China's Reopening Should Help ET Grind Higher
Summary
- China has shifted from its zero-Covid stance, and a reopening of its economy will lead to increased consumption in traditional energy sources.
- Global oil and gas production will need to increase to sustain future economic growth and global stability.
- ET still looks to be undervalued by more than 50%, and investors can grab an 8% yield while they wait for future appreciation.
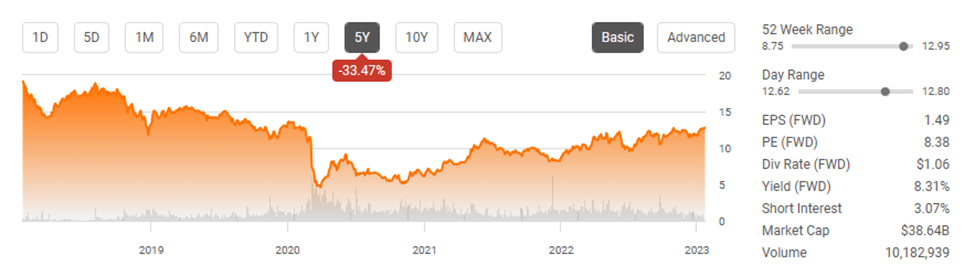
It's 2023, and units of Energy Transfer (ET) are still under $15. Units started declining in the fall of 2018 and haven't traded above $15 since the summer of 2019. The pandemic shattered valuations across energy infrastructure companies, and units of ET fell below $5 for a brief period in 2020. Since the pandemic crash, units have slowly grinded higher, and while there was an extended period of units trading in the single digits across 2020 and 2021, units have increased in value by 177.39% since 3/30/20, and over the past year, units have increased 33.89%. While there have been many rational reasons why commentators on ET believe it's undervalued and unit prices will continue their current trajectory, the reopening news out of China is extremely bullish for the commodity markets and should favorably impact ET. China is the world's second-largest economy and recently ended its zero-Covid approach, which included mass testing, centralized quarantine, and lockdowns after almost 3 years. China coming back to the global stage from business to tourism will increase commodity consumption, and while that could lead to global inflationary pressure, it is bullish for ET going forward.
China's reopening is projected to increase the demand in traditional energy sources
Based on China's actions since the beginning of the pandemic, it's too early to tell if the zero-Covid policy is gone forever. President Xi Jinping has called for unity as China entered what they consider a new phase in its approach to containing the spread of Covid-19. In his first televised speech since China struck down zero-Covid, President Xi stated that China had overcome unprecedented difficulties and challenges in the battle against Covid-19 and that its policies were optimized. We will need to wait and see as China has the largest population globally, and while lifting Covid restrictions would boost growth prospects domestically, and for other economies, it could also lead to an increase in Covid-19 cases. The coming months will be the true test as we will see in real-time if China has turned the page or reverts to its previous stances.
The commodity-centered news out of China is bullish for demand. The largest oil trader in China and the trading unit of state-held refiner Sinopec, Unipec, has purchased 9 million barrels of Abu Dhabi's Upper Zakum crude grade for March loadings. Saudi Aramco expects the Chinese reopening and a pick-up in jet fuel demand to lead to a rebound in global oil demand in 2023. The International Energy Agency ((IEA)) sees China's reopening driving global oil demand to a record high of 101.7 million bpd in 2023, which is an increase of 1.9 million bpd YoY. This is an increase of 200,000 bpd from the IEA's demand growth estimate for 2023. Within the IEA's Oil Market Report the IEA stated that almost 50% of the oil demand growth this year would come from China after Beijing lifted its Covid restrictions.
China's Covid-19 policies, which included lockdowns and travel restrictions, had a significant impact on the oil and gas markets. The ramifications of the pandemic correlated to decreased economic activity, which directly impacted the demand for oil and gas. China's reopening is likely to increase demand across the board in the commodity markets as the need for increased oil, gas, and refined products should rise. China is a major consumer of traditional fuels, and as businesses and factories resume operations at normal levels, it should correlate to higher utilization rates in oil and gas.
China has the world's largest population, with 1.44 billion people, and is the world's second-largest economy. Prior to Covid, China was projected to become the world's largest economy by 2028, and while this timeline may have changed, there is still a good chance that China will accomplish this in the next decade. As China's economy grows, so does its demand for energy, and natural gas has become a critical component of China's energy mix. China's rising natural gas imports have led to the construction of new LNG import terminals and pipelines to facilitate its economic growth, and this sets up well for ET.
China's reopening could bring an opportunity to investors of energy infrastructure companies and specifically Energy Transfer
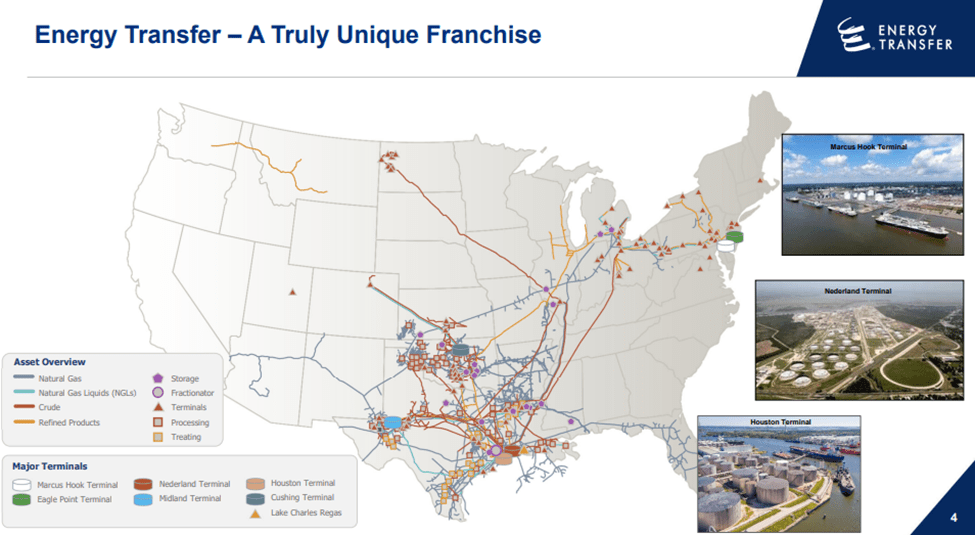
ET has nearly 120,000 miles of pipelines across the U.S., with its services spanning natural gas midstream, intrastate, and interstate transportation and storage, crude oil transportation, terminalling and acquisition and marketing services, natural gas liquids (NGLs) transportation, storage, and fractionation, refined products transportation and terminalling, and liquified natural gas ((LNG)) storage, regasification, liquefaction, and exporting. In the TTM, ET has generated $88.03 billion in revenue, $12.10 billion in EBITDA, and $8.36 billion in distributable cash flow ((DCF)). ET has one of the largest energy infrastructure networks in the U.S., which can't be replicated.
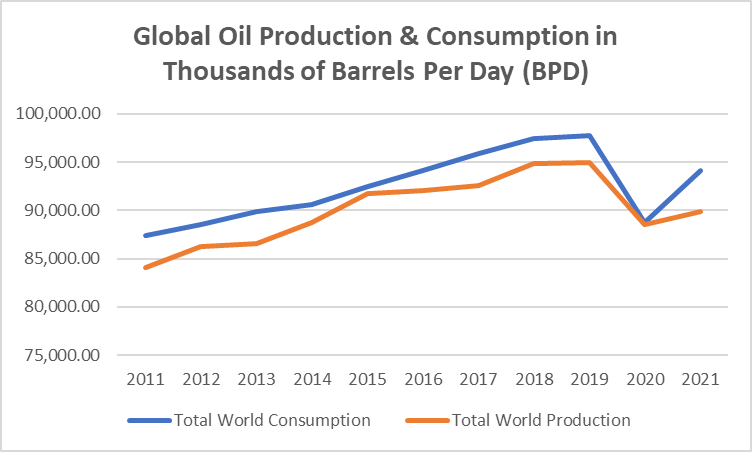
The combination of China's reopening and life normalizing in other countries should increase the utilization of all forms of energy, including traditional fuels and renewable resources. I still feel that BP ( BP ) puts out some of the most comprehensive research about the energy sector, and their annual Statistical Review of World Energy provides phenomenal insights into the industry. I went through all of the drilling data and will correlate how the energy landscape is setting up well for ET. The data I use can be found on page 15 (oil production), page 20 (oil consumption), page 29 (natural gas production), and page 31 (natural gas consumption). To be clear, all the data has been compiled by BP; these are not my numbers. BP has listed all of the data from 2011 thru 2021, and I am excited to see the updated report with 2022's finalized numbers.
The spread between global oil production and consumption has been in a deficit annually over the past decade. In 2021, the global economy consumed 4.69% more BPD of oil than it consumed in 2020. 2020 was the tightest spread in a decade when economies came to a screeching halt for a period of time, but even with an economic standstill, there was more oil consumed than produced.
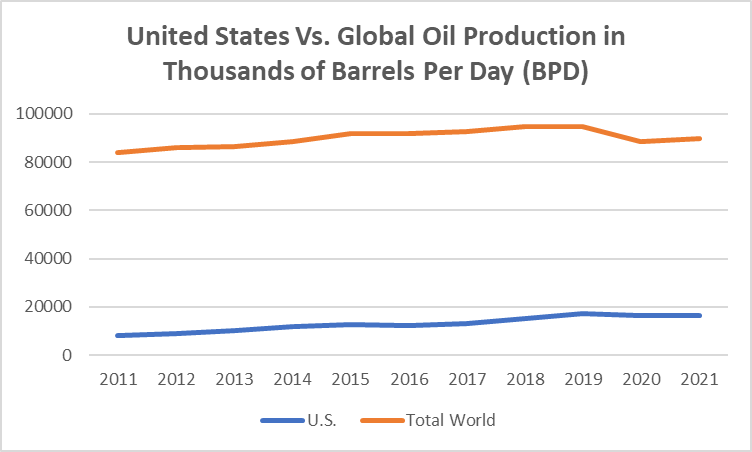
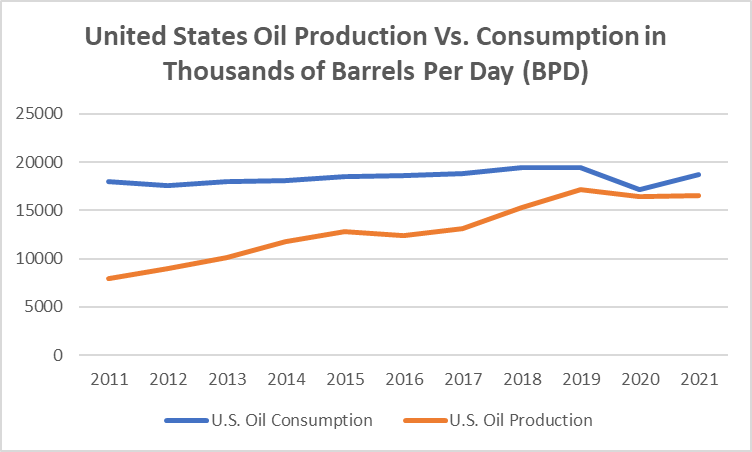
The U.S. is the largest oil-producing nation globally. In 2021, the U.S. accounted for 18.45% of global oil production. There hasn't been a single year where the U.S. produced more oil than it consumed. In 2011, the U.S. consumed an additional 128.05% of the oil it produced, and this spread tightened into 2020. During the economic slowdown of 2020, the U.S. only consumed 4.41% more oil than it produced, but in 2021, the spread increased as the U.S. consumed 12.66% more oil than it produced.
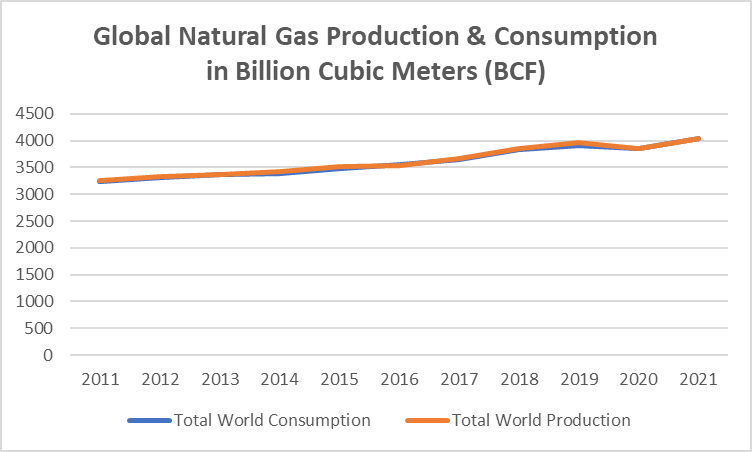
The spread between production and consumption of natural gas has been much tighter globally, and domestically the U.S. is a net positive producer. Since 2011, there have only been 3 years where consumption was larger than production, and in 2021 the deficit was so small that it would be a small fraction of a percent.
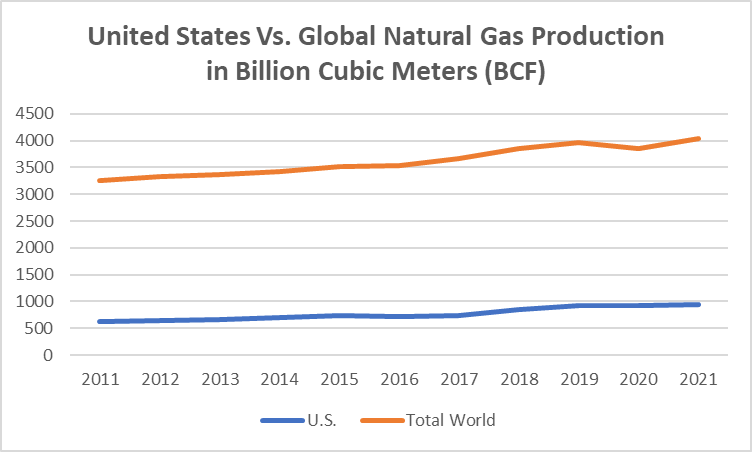
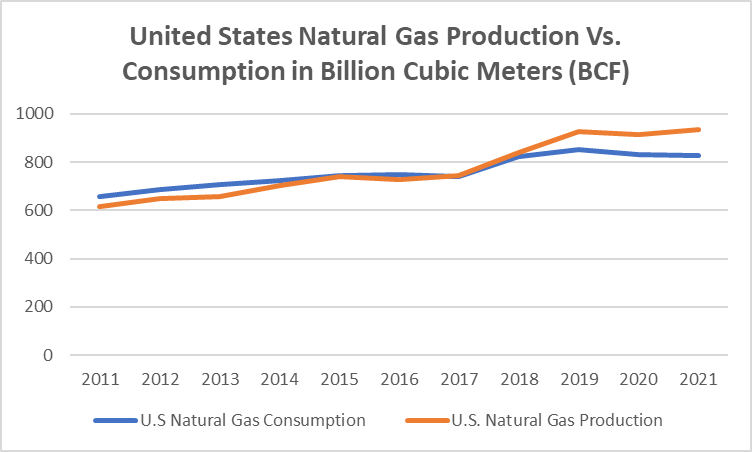
The U.S. is the largest natural gas-producing nation globally and accounts for 23.14% of worldwide natural gas production. The U.S. has been a net positive producer of natural gas since 2017, and the annual surplus has grown YoY. The U.S. saw the largest surplus increase YoY by percentage in 2019 when the annual surplus between production and consumption grew by 58.2 Bcf (303.13%). In 2021, the U.S. produced 107.5 Bcf more than it consumed, which was the largest YoY surplus increase by volume and a 27.97% YoY percentage increase in the gap between production and consumption.
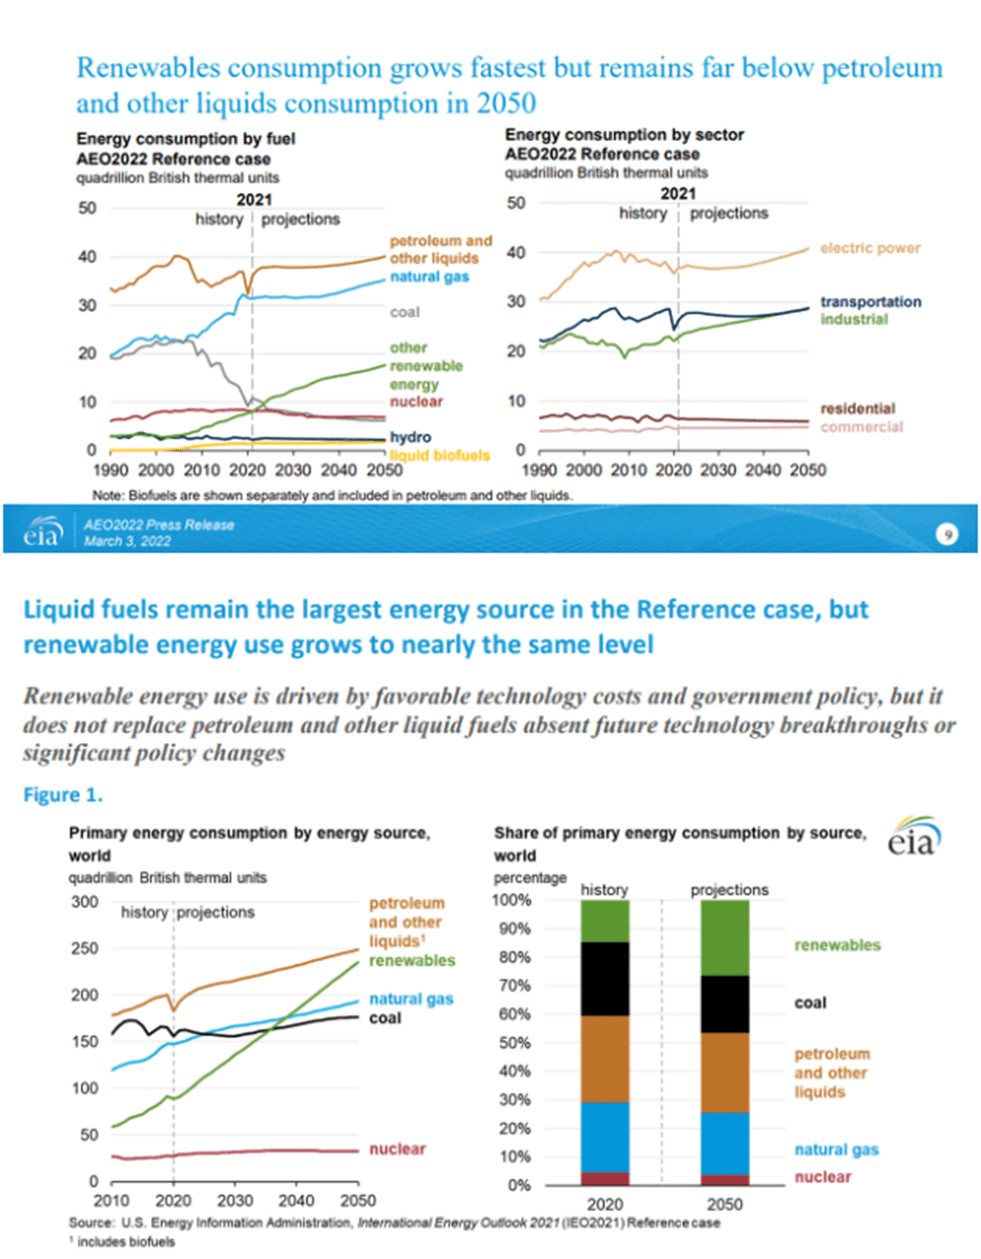
Natural gas production in the United States has increased by 51.31% over the past decade, as it increased by 316.8 billion cubic meters. According to the EIA, we have seen the most production increase come out of the Marcellus shale and Permian Basin. On 3/3/22, the EIA released its 2022 Annual Energy Outlook and concluded that petroleum and natural gas remain the most consumed sources of energy in the United States through 2050 (1st slide below). The EIA publishes its international energy outlook every 2 years, and the last one was published prior to the war in Ukraine. In 2021, on a global scale, the natural gas consumption rate will increase by roughly 18% by 2050 per the EIA's projections (2nd slide below). Their next report is slated for 2023, and it will be interesting to see how things have changed due to the growing demand for natural gas overseas.
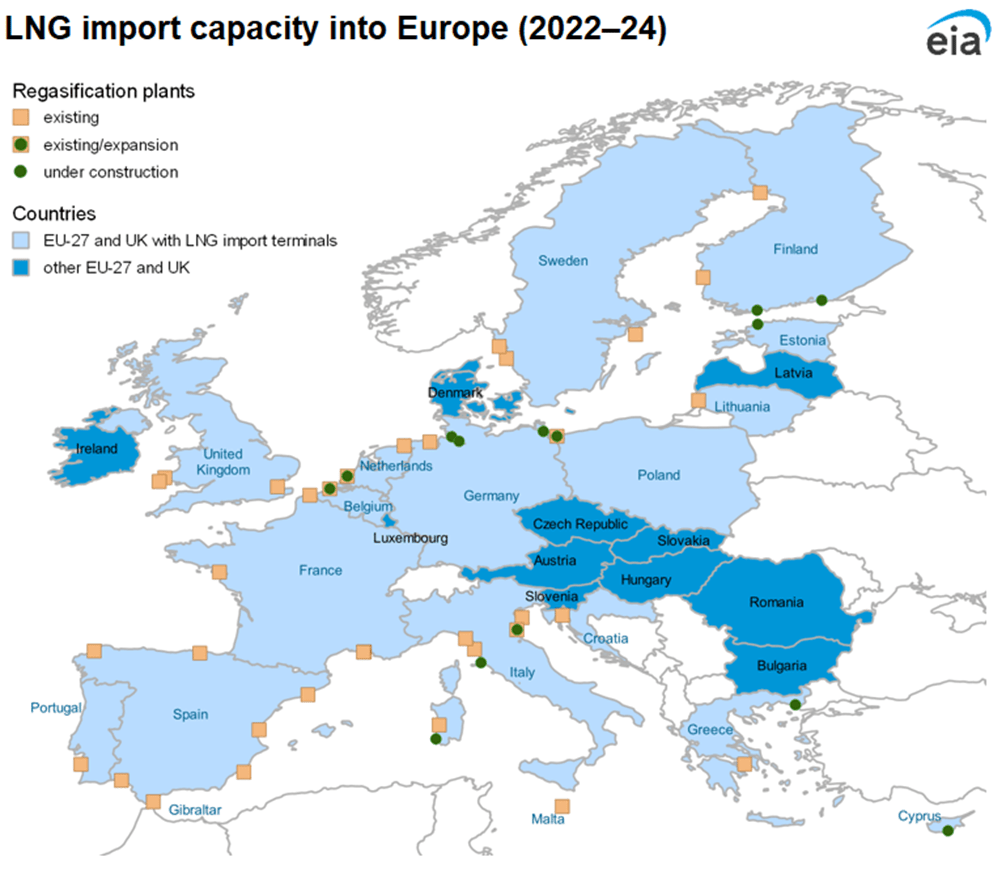
Oil and gas aren't going away, in fact, the consumption projections domestically and globally are expected to increase. The U.S. is the largest oil and gas producing nation, yet we operate at an oil deficit and at a surplus on the natural gas side annually. To maintain global stability, energy production will need to increase to meet the energy demands of the future. While renewable energy was constantly in the headlines, we have seen in real-time how dependent the world really is on traditional fuels in 2022. The United States Energy Information Administration is projecting that liquified natural gas (or LNG) terminals across the European Union will expand their capacity by 5.3 billion cubic feet per day (Bcf/d) by the end of 2023. In 2024, this capacity will expand by another 1.5 Bcf/d for a total of 6.8 Bcf/d of new LNG regasification capacity added in the region (34% expansion) compared with 2021. Between January and November 2022, an estimated 1.7 Bcf/d of new and expanded LNG regasification capacity was added in Poland, Italy, the Netherlands, Finland, and Germany. By the end of 2023, LNG regasification terminals that are currently under construction in Germany, Poland, France, Finland, Estonia, Italy, and Greece will add 3.5 Bcf/d of new capacity.
ET is a major player in the LNG space as it will be one of the only companies to have export facilities on both the Gulf and East Coast. ET will have the sixth largest exporting capacity out of the Lake Charles facility from the publicly traded companies that have approved LNG export facilities. The Lake Charles facility has 2 existing deep-water docks on a 152-acre site with 4 LNG storage tanks with a capacity of 425,000 m3. Its estimated exporting capacity is roughly 16.5 million tonnes per year. ET has executed 7.9 million tonnes per year of sale and purchase agreements to 6 companies. The purchase price for these agreements is indexed to the spot price based on the Henry Hub benchmark, and ET will generate a fixed liquefaction charge. ET has the following agreements in place:
- Shell LNG 2.1 million tonnes per annum for 20 years
- China Gas 0.7 million tonnes per annum for 25 years
- SK Gas 0.4 million tonnes per annum for 18 years
- Gunvor Group 2.0 million tonnes per annum for 20 years
- ENN Energy 0.9 million tonnes per annum for 20 years
- ENN Natural Gas 1.8 million tonnes per annum for 20 years
It just so happens that China Gas, EEN Energy, and EEN Natural Gas are all Chinese companies that have signed dedicated contracts for LNG through ET's facilities. The domestic and global landscape is set up well for ET, and as the largest oil and gas-producing nation, the U.S. will need to continue its global production dominance. An increased amount of production domestically means that more fuel will be stored, refined, and transported through energy infrastructure landscapes across the U.S., and ET is the largest in the group. In addition to domestic production, American exports will be needed to meet the global demand, which means traditional fuel will need to be transported, treated, and exported through the same energy infrastructure companies. I believe that this sector still trades at depressed levels, and the barriers to entry are almost impenetrable for additional competition.
After units increased by 33.89% over the past year, is there still room for units of ET to grind higher?
I am looking forward to the Q4 earnings reports and updating all of my figures. I track the market cap, enterprise value, revenue, Adjusted EBITDA, distributable cash flow ((DCF)), and total debt so I can compare the following ratios, Adjusted EBITDA to market cap, EV to Adjusted EBITDA, DCF to Market Cap, Debt to Adjusted EBITDA, and Price to Sales. Here is how ET stacks up to the midstream operators I track going into earnings season.
- Energy Transfer ( ET )
- Enterprise Products Partners ( EPD )
- MPLX LP ( MPLX )
- Kinder Morgan ( KMI )
- Plains All American Pipeline ( PAA )
- Williams Companies ( WMB )
- Targa Resources ( TRGP )
- Magellan Midstream Partners ( MMP )
- ONEOK ( OKE )
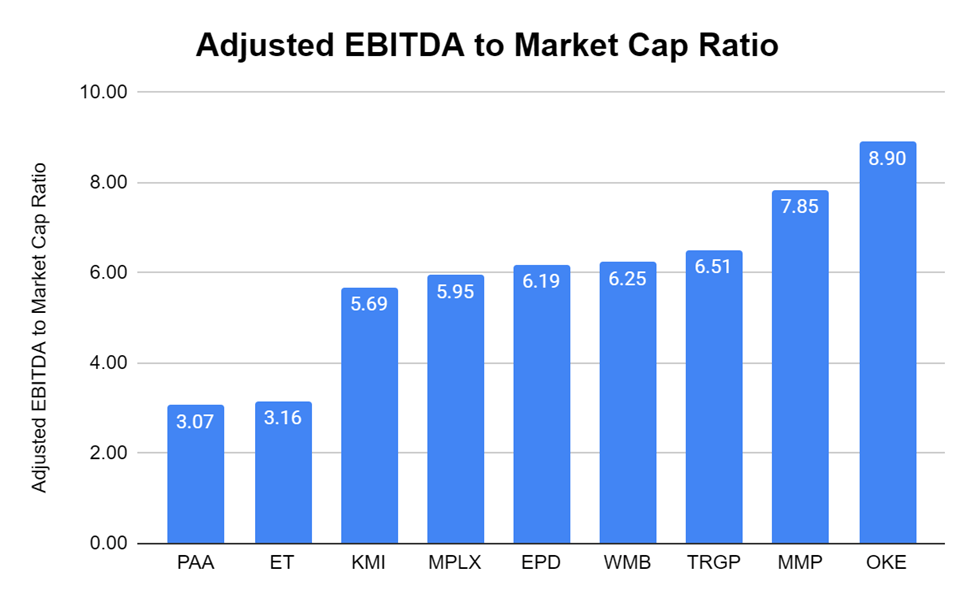
ET is currently trading at a 3.16x Adjusted EBITDA to Market Cap Ratio, which is significantly below the 5.95x peer group average.
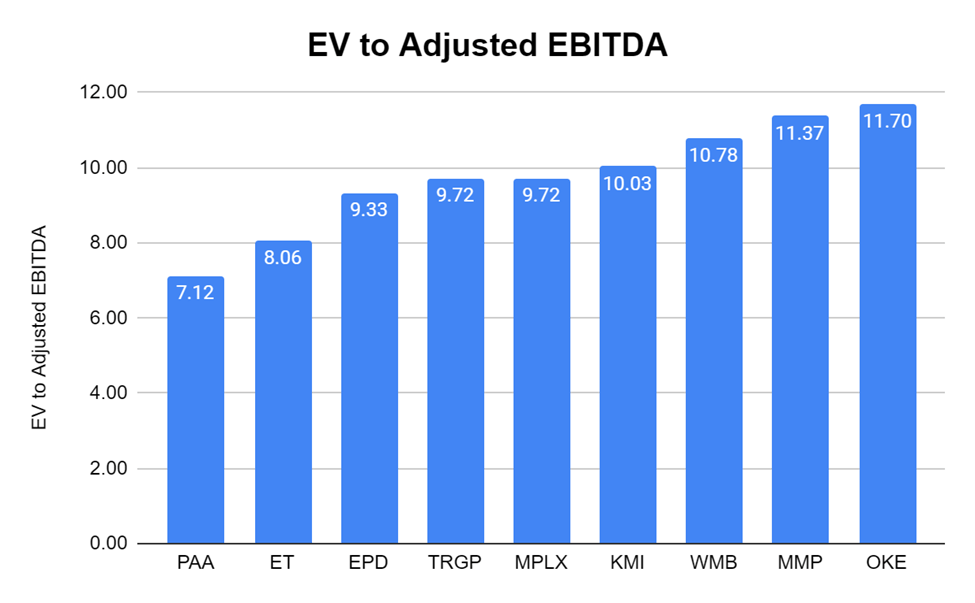
ET has an Enterprise Value to Adjusted EBITDA level of 8.06x, which is a tighter spread than the peer group average of 9.76x.
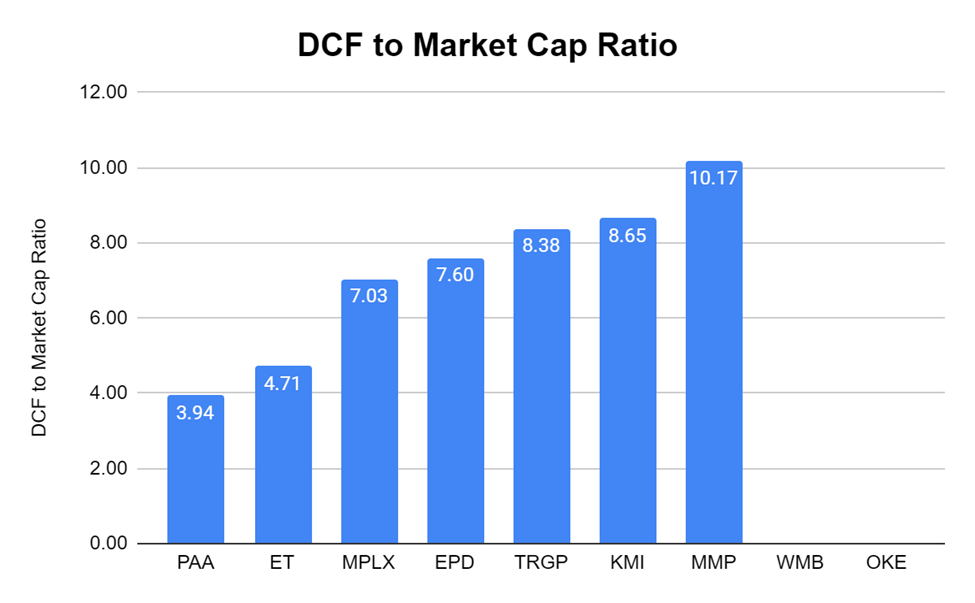
ET trades at a DCF to market cap ratio of 4.71x compared to the peer group average of 7.21x. OKE and WMB do not break out DCF metrics in the quarterly reports, so they were excluded from this data set.
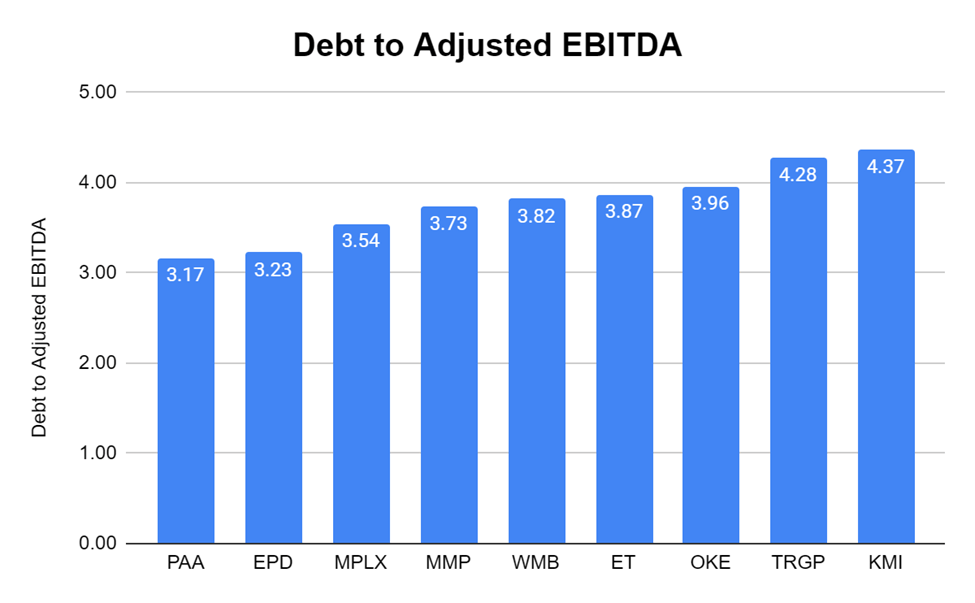
ET has a debt to Adjusted EBITDA ratio of 3.87x, which is a fractional difference from the peer group average of 3.77x.
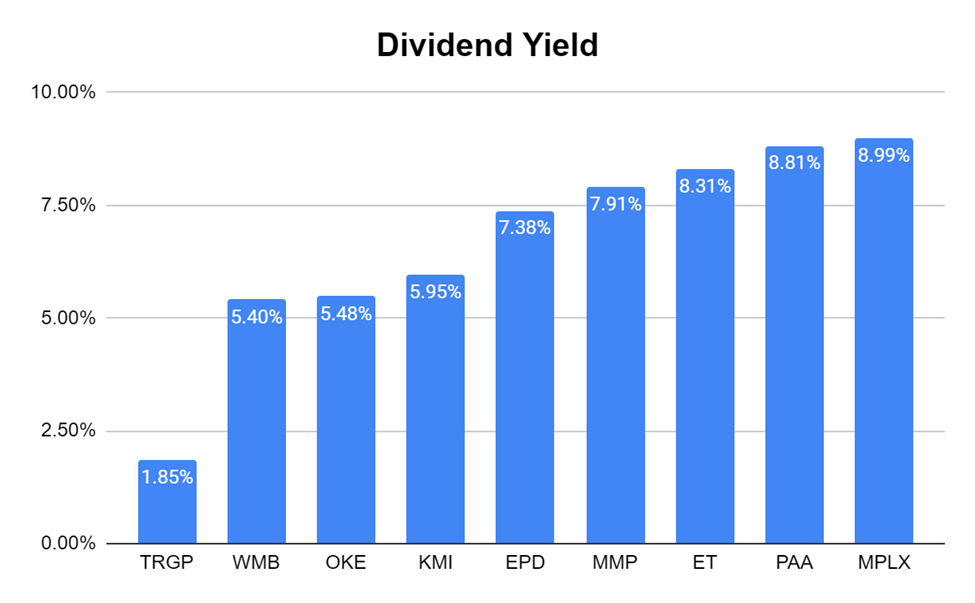
ET also delivers the 3rd largest distribution yield in the group as its current yield is 8.31% compared to the peer group average of 6.68%.
Based on how ET trades compared to its peers, I feel it's still undervalued. ET is trading at a very low multiple on its DCF and Adjusted EBITDA to its market cap. At a $60 billion market cap, ET would trade at a 4.81x Adjusted EBITDA to market cap ratio compared to the peer group average of 5.95x, and a 7.18x DCF to market cap ratio compared to the peer group average of 7.21x. In both cases, ET would trade below the peer group average, and this would be a 52.25% increase to ET's current market cap. This would place units at $19.43 per share. I don't feel this would be an unreasonable valuation by any means.
Conclusion
Q4 results are less than a month away, as ET is scheduled to report on 2/15 after the close. Units of ET have continued to grind higher in 2022, but I still believe there is a lot of room to climb higher. Looking at the peer group, there is no reason why units of ET shouldn't trade above $19, and I feel shares have at least another 52.25% upside from here. The global energy landscape is a powerful tailwind for ET, and as China reopens, the commodity market will pressure exploration and production companies to increase the production of traditional fuels. Renewables will play a role in the global energy mix, but they won't replace oil and gas. ET is still one of my favorite picks for 2023 and beyond, and investors can grab a yield that exceeds 8% while ET works its way to a higher valuation.
For further details see:
Energy Transfer: Undervaluation And China's Reopening Should Help ET Grind Higher