META - ESGU Chooses Ethics Without Adding Risk
2023-12-19 12:00:00 ET
Summary
- iShares ESG Aware MSCI USA ETF is a passively managed fund that follows an ethical investing approach.
- The sector breakdown is very close to the S&P 500 index, as well as valuation and growth metrics. Quality looks better.
- The fund has shown similar performance and risk metrics to the S&P 500 since inception. It has moderately lagged other ESG ETFs in the last 3 years.
ESGU Strategy
iShares ESG Aware MSCI USA ETF ( ESGU ) is a passively managed exchange-traded fund, or ETF, launched on 12/1/2016 that tracks the MSCI USA Extended ESG Focus Index. It implements an environmental, social, and corporate governance ("ESG") investing approach. It has 286 holdings, a 12-month trailing yield of 1.51% and a total expense ratio of 0.15%. Distributions are paid quarterly.
As described in the prospectus by iShares, the starting universe is the MSCI USA Index. The index excludes:
companies involved in the business of tobacco, companies involved with controversial weapons, producers and retailers of civilian firearms, and companies included in certain fossil fuels-related activities such as the production of thermal coal, thermal coal-based power generation and extraction of oil sands based on revenue or percentage of revenue thresholds for certain categories (e.g., $20 million or 5%) and categorical exclusions for others (e.g., controversial weapons) .
Companies are rated and ranked regarding ESG characteristics in comparison to their industry peers. The weighting process aims at maximizing exposure to companies with higher ESG ratings, while maintaining risk and return characteristics similar to the parent index (MSCI USA). The portfolio turnover rate in the most recent fiscal year was 22%.
ESGU Portfolio
The fund is almost exclusively invested in U.S. companies (about 99% of asset value), mostly in large and mega caps (75%). The sector breakdown is very close to the S&P 500 index (SP500), represented in the next chart by SPDR® S&P 500 ETF Trust ( SPY ). The heaviest sector is technology, with 30.4% of assets (vs. 29.1% in SPY).
ESGU sector breakdown (chart: author; data: iShares, SSGA)
ESGU doesn't show a significant difference with the S&P 500 regarding valuations and growth metrics, except a lower cash flow growth, as reported below.
| ESGU |
| SPY |
| Price/Earnings |
| 23.15 |
| 22.64 |
| Price/Book |
| 4.19 |
| 4 |
| Price/Sales |
| 2.45 |
| 2.58 |
| Price/Cash Flow |
| 16.18 |
| 15.71 |
| Earnings growth % |
| 16.12% |
| 17.47% |
| Sales growth % |
| 12.06% |
| 11.41% |
| Cash flow growth % |
| 5.08% |
| 7.99% |
Source: Fidelity.
The next table lists the top 10 issuers with fundamental ratios. They represent 30.3% of assets. For convenience, the two share series of Alphabet Inc. ( GOOGL , GOOG ) have been grouped. Apple and Microsoft Corporation (MSFT) weigh about 14% together, like in the S&P 500. Risks related to other individual companies are low to moderate.
| Ticker |
| Name |
| Weight % |
| EPS growth % TTM |
| P/E ttm |
| P/E fwd |
| Yield % |
| Apple, Inc. |
| 7.14 |
| 0.45 |
| 32.23 |
| 30.24 |
| 0.49 |
| Microsoft Corporation |
| 6.47 |
| 11.28 |
| 35.90 |
| 33.01 |
| 0.81 |
| GOOGL |
| Alphabet Inc. |
| 3.46 |
| 3.56 |
| 25.42 |
| 23.09 |
| 0 |
| Amazon.com, Inc. |
| 3.25 |
| 75.88 |
| 78.30 |
| 56.02 |
| 0 |
| NVIDIA Corporation |
| 2.98 |
| 222.20 |
| 64.55 |
| 39.89 |
| 0.03 |
| Tesla, Inc. |
| 1.73 |
| -4.04 |
| 81.63 |
| 82.57 |
| 0 |
| Meta Platforms, Inc. |
| 1.63 |
| 7.92 |
| 29.56 |
| 23.33 |
| 0 |
| UnitedHealth Group Incorporated |
| 1.33 |
| 12.84 |
| 23.05 |
| 21.28 |
| 1.42 |
| Broadcom Inc. |
| 1.15 |
| 25.65 |
| 34.30 |
| 24.03 |
| 1.86 |
| JPMorgan Chase & Co. |
| 1.15 |
| 41.43 |
| 9.86 |
| 9.91 |
| 2.54 |
Quality
ESGU currently holds about 280 stocks, which I have scanned for quality. In my ETF reviews, risky stocks are companies with at least 2 red flags among: bad Piotroski score, negative ROA, unsustainable payout ratio, bad or dubious Altman Z-score, excluding financials and real estate where these metrics are unreliable. Here, risky stocks weigh 8.74% of asset value, which is rather a good point. According to my calculation of aggregate metrics reported in the next table, the portfolio quality is significantly superior to the benchmark. The return on assets is especially good.
| ESGU |
| SPY |
| Altman Z-score |
| 6.75 |
| 3.59 |
| Piotroski F-score |
| 6.06 |
| 5.73 |
| ROA % TTM |
| 11.64 |
| 7.24 |
Historical Performance
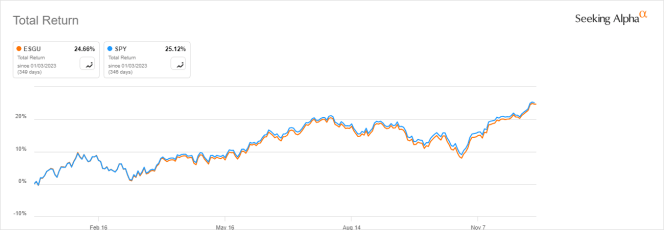
Since inception, the differences with the S&P 500 in performance and risk metrics are insignificant: 17 bps in annualized return, 15 bps in maximum drawdown, and 39 bps in the standard deviation of monthly return ("volatility" in the next table).
| Total Return |
| Annual.Return |
| Drawdown |
| Sharpe ratio |
| Volatility |
| ESGU |
| 138.93% |
| 13.20% |
| -33.87% |
| 0.67 |
| 17.27% |
| SPY |
| 136.36% |
| 13.03% |
| -33.72% |
| 0.69 |
| 16.89% |
In 2023 to date, ESGU is also very close to the benchmark:
ESGU vs. SPY, year-to-date (Seeking Alpha)
ESGU vs. Competitors
The next table compares the characteristics of ESGU and three ESG ETFs.
- iShares MSCI KLD 400 Social ETF ( DSI ).
- SPDR S&P 500 ESG ETF ( EFIV ).
- Nuveen ESG Mid-Cap Growth ETF ( NUMG ).
| ESGU |
| DSI |
| EFIV |
| NUMG |
| Inception |
| 12/1/2016 |
| 11/14/2006 |
| 7/27/2020 |
| 12/13/2016 |
| Expense Ratio |
| 0.15% |
| 0.25% |
| 0.10% |
| 0.31% |
| AUM |
| $12.68B |
| $3.92B |
| $1.06B |
| $427.20M |
| Average Daily Dollar Volume |
| $63.68M |
| $11.60M |
| $2.32M |
| $1.34M |
| Number of Holdings |
| 286 |
| 401 |
| 321 |
| 62 |
| Assets in the Top 10 |
| 30.3% |
| 35.7% |
| 40.9% |
| 25.7% |
| Turnover |
| 22.00% |
| 4.00% |
| 12.00% |
| 84.00% |
ESGU is the largest (in assets under management) and most liquid fund in the list, and it has the second-cheapest expense ratio behind EFIV.
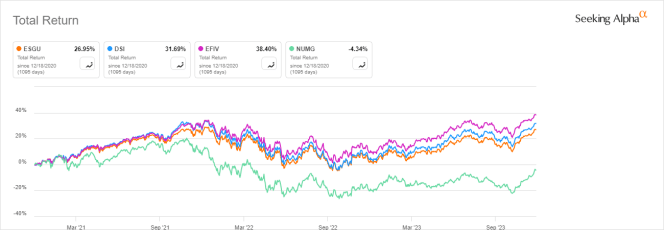
It has moderately lagged EFIV and DSI in 3-year total return, as reported on the next chart. The mid-cap fund NUMG has underperformed by a wider margin, mostly due to the underperformance of its size segment during the period.
ESGU vs. competitors, 3-year total returns (Seeking Alpha)
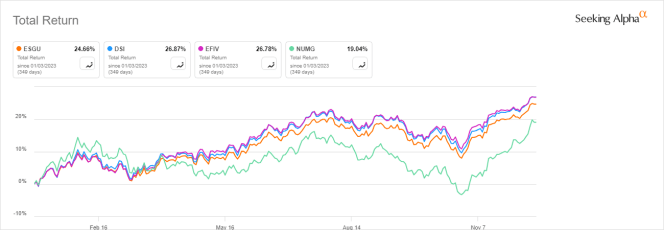
The ranking is the same in 2023 to date:
ESGU vs. competitors, 12-month total returns (Seeking Alpha)
Takeaway
iShares ESG Aware MSCI USA ETF invests in a large-cap universe with an environmental, social, and corporate governance approach. The sector breakdown is very close to the S&P 500 index, as well as valuation and growth metrics. However, quality is significantly superior to the benchmark.
For further details see:
ESGU Chooses Ethics Without Adding Risk