MSFT - ETG: Discounted Global Exposure
2023-07-06 17:59:56 ET
Summary
- The Eaton Vance Tax-Advantaged Global Dividend Income Fund offers investors exposure to a range of global positions, with the majority of the fund invested in common stocks.
- Despite a distribution cut last year, the fund has shown decent returns and is currently traded at an attractive discount due to the fund's net asset value rising faster than the share price.
- The fund is leveraged which can lead to greater volatility and risks, but can also produce better returns over the long term; however, rising borrowing costs have increased the fund's total expense ratio.
Written by Nick Ackerman, co-produced by Stanford Chemist. This article was originally published to members of the CEF/ETF Income Laboratory on June 22nd, 2023.
Eaton Vance Tax-Advantaged Global Dividend Income Fund ( ETG ) exposes investors to a basket of global equity positions. While the fund is technically a hybrid fund that can allocate portions of its portfolio to fixed-income assets, the majority of the fund is consistently invested in common stocks.
The fund is currently traded at an attractive discount that has opened up in the best way possible for closed-end funds. That's through the fund's net asset value rising faster than the fund's share price. Some of this discount widening was promoted by a distribution cut last year, which we previously discussed.
Since that update, the fund has put up some decent returns this time despite lagging behind its NAV performance. Additionally, a new semi-annual report is available, making it a perfect time for an updated look.
ETG Performance Since Prior Update (Seeking Alpha)
The Basics
- 1-Year Z-score: -1.00
- Discount: -9.27%
- Distribution Yield: 7.27%
- Expense Ratio: 1.18%
- Leverage: 20.89%
- Managed Assets: $1.771 billion
- Structure: Perpetual
ETG invests "primarily in global dividend-paying common and preferred stocks and seeks to distribute a high level of dividend income that qualifies for favorable federal income tax treatment." This means they are looking for companies whose dividends are considered to be qualified dividend income. Of course, that is good for investors who might hold this in a taxable account. It would reduce the tax obligation for an investor, which is where the "tax-advantaged" portion of its name comes from.
ETG is leveraged, and that means greater volatility and risks; however, it's fairly moderately leveraged, and it can also help produce better returns over the longer term. The biggest negative for leverage right now is the cost of leverage has exploded higher, and this is something we've been looking at closely. The higher cost of borrowings are likely a contributor to why the fund cut its distribution last year, as well as just being a bad year for investments, so they had to readjust to a more appropriate level.
Rising borrowing costs have pushed up the fund's total expense ratio. The total expenses ratio, when including the fund's leverage, comes to 2.64%. That was an increase from 1.58% reported on October 31st, 2022. That's one way to measure just how much interest rates have risen to see such a larger change from the fiscal year-end period. Compared to other CEFs, ETG's operating expenses have generally been fairly competitive in the space.
Performance - Attractive Discount
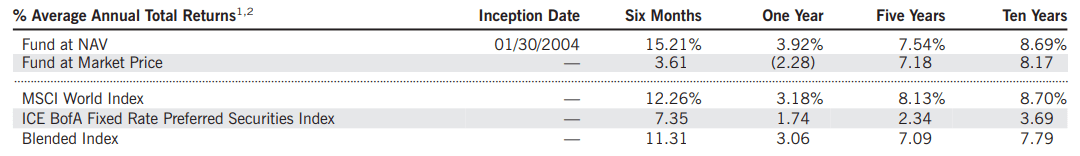
This fund has provided strong historical results that have been quite comparable to its benchmark. They utilize a blended benchmark of the MSCI World Index and the ICE BofA Fixed Rate Preferred Securities Index. However, looking at the comparisons between the MSCI World Index and ETG could be the more appropriate mark due to its heavy weighting to equity investments.
2022 was rough for the fund, which wasn't helped by its leverage. However, results in 2023 have been providing some of the rebound. This is reflected in the six-month report above as it's for the period ending April 30th, 2023. The start of the period would have been the end of October, right when the whole market was taking a turn higher.
In looking at the performance since the fund's distribution cut, we can see exactly when the latest discount began to open up to a significant level. This is a pretty ideal move that we want to see when we are looking for new capital to work in a CEF - strong NAV performance while the share price lags behind.
YCharts
For a brief period, ETG was even trading at a premium before the cut was put into place. The fund is now trading back at its longer-term average. In fact, it's trading a bit below its average, making it still a consideration for adding today.
YCharts
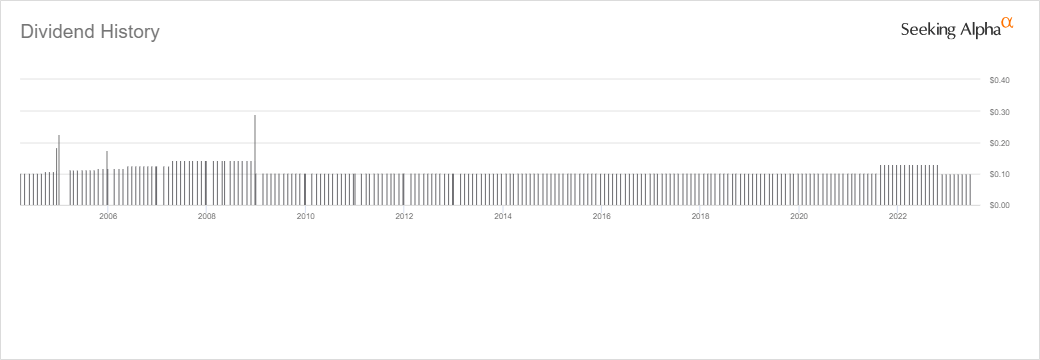
Distribution - Cut Put It At A Sustainable Level
Before the fund cut its distribution last year, it had actually raised it in the prior year. 2020 and 2021 showed such strong results they were probably very comfortable as the distribution rate came down substantially. Of course, they probably regret that now as they perhaps could have just continued to maintain that previous rate.
Either way that is history now, and today's distribution rate is quite reasonable and should be sustainable, with the NAV rate at a modest 6.55%. That even includes the big cost increase of the borrowings for the fund. Stronger equity performance this year should also keep them from cutting for the foreseeable future.
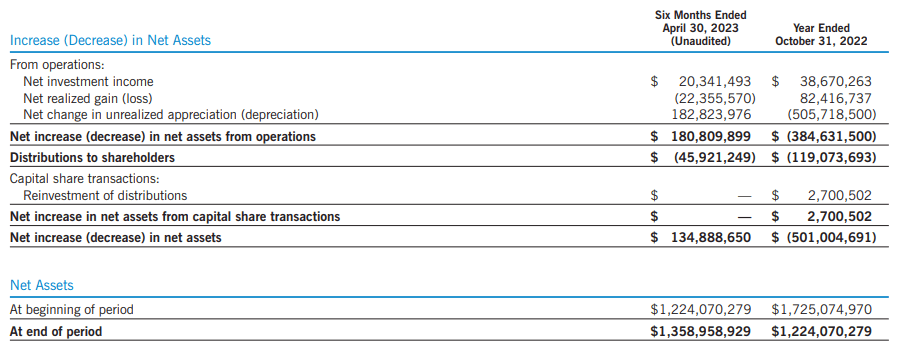
One thing that might be interesting is that despite the fund's significant increase in leverage costs, net investment income has actually moved higher in the latest report. If we annualized the latest figure out, we'd come to roughly $40.683 million or around a 5.2% increase from the prior year.
When looking at the borrowing costs from the same reporting period a year earlier, interest expenses and fees came to $1.366 million. The latest report now shows those at $9.479 million without adding any additional leverage; they've maintained the same $370 million in borrowings in both periods.
Instead, it seems that portfolio positioning has increased total investment income. That went from $33.15 million to $37.523 million. That help offset the significant increase in borrowing costs. As the fund's managed assets fell from the prior period, the investment adviser fees also declined from $8.418 million to $7.075 million. That also took some pressure off to produce higher NII at a run-rate above the last fiscal year.
However, it should be noted that if we compare NII in this latest report to the same period year-over-year, it was a decline. At the end of April 30th, 2020, they reported $22.763 million for NII.
On a per-share basis, the fund's NII came to $0.266 in the last six-month period. That puts NII coverage at 44.29%, not exactly terrible for an equity CEF as they will regularly rely on significant capital gains to fund their distribution. NII is still important to track, as whatever the fund can produce in recurring cash flows will help make the distribution more sustainable over the long run.
If they can continue to shift their portfolio and see portfolio positions increase their dividends, that could provide more stable coverage going forward. However, we have dealt with a couple more rate increases, and there are two more expected by the Fed. That could put further pressure on the fund as borrowing costs rise even further. That being said, we should be at least much closer to the end of the rate hiking cycle than the beginning. Some stabilization in that could provide for better predictability of coverage for ETG going forward. If we get rate cuts in 2024 as anticipated, the reverse will also be true, and we could see some of the higher interest rate costs reverse and see higher coverage for ETG return.
ETG's Portfolio
ETG has tended to be quite an active fund in terms of buying and selling. In the last six months, they reported a turnover of 49%. That puts it on pace to be more active than last year when it reported a 59% turnover. However, those figures were both down from the 111% turnover in fiscal 2021 and the feverish turnover pace of 224% shown in 2020.
So the portfolio is constantly evolving somewhere in the portfolio. In terms of the top holdings, they tend to show some regulars that have been holdings for years. Additionally, the overall weightings of the fund have stayed fairly consistent, too, with equity positions dominating the majority of their asset class positioning. Total equities were previously ~90% of the portfolio, so we have seen this decrease a touch. However, it isn't an overly drastic change either.
ETG Asset Mix (Eaton Vance)
The fund invests about 50% of its portfolio outside of North America - which I take to presume the vast majority of the rest is going to be inside the U.S. This presents a sizeable allocation to investments outside the U.S., which could help an investor with diversification. Global securities have actually started to outperform more recently, according to JPMorgan . At the same time, valuations have also stayed relatively cheaper outside the U.S. as well.
ETG Geographic Breakdown (Eaton Vance)
With a new fact sheet format, the Eaton Vance funds now show a sector breakdown of their portfolio. These previously were only to be found in the annual and semi-annual reports. With fact sheets coming quarterly, we should get a better idea of how the fund is positioned between these reports. Of course, this first one is for the same reporting period as their semi-annual report, but if they maintain this template going forward, it'll be helpful.
The breakdown also includes how the fund is positioned relative to its benchmark. This can be helpful for trying to figure out why a fund is potentially outperforming or why a fund is potentially underperforming. If we know how they are positioned relative to their respective index, this can be a place to check.
In the case of ETG, we see and have known that they take a more value-oriented approach. In the last decade or so, that really limited the fund's upside potential while something like SPY sped higher. ETG didn't provide bad performance, but if we were to compare it to SPY, it would be weaker. Not to mention the whole ETG being a global fund too. The MSCI World Index favors tech, whereas ETG's heaviest weighting is financials.
ETG Sector Weighting (Eaton Vance)
Financials have generally been the highest weighting in the fund. The last time we covered the fund, it also carried an overweight exposure to tech but not too significantly. However, it was that previous weighting that showed tech as the largest weighting that was the anomaly. With this latest update, they've pushed further into financials and really cut down tech. The allocation for tech previously was 19.7%, and financials were at 18.5%.
Some of the more regular names we see in ETG are tech positions. Those include Microsoft ( MSFT ), Alphabet ( GOOG ) (GOOGL), Amazon ( AMZN ) and Apple ( AAPL ).
ETG Top Ten Holdings (Eaton Vance)
However, Nestle ( OTCPK:NSRGY ) and Coca-Cola ( KO ) are also positions that are seemingly becoming pretty consistent between updates, showing up regularly in our last several updates.
Of course, these are all well-known large-cap names in ETG's portfolio. Most of them provide a dividend, as is the fund's main focus. That doesn't mean all of them do, as we know GOOG and AMZN don't. DIS suspended its dividend in 2019. So for these positions, ETG is looking for potential capital gains to contribute to the fund's success. However, it could be a place where management trims to invest in more income-oriented investments to provide better coverage of its distribution going forward.
Conclusion
ETG has delivered solid returns and is back to a solid start in 2023 after diving with the rest of the market in 2022. The fund is leveraged, and those costs have been exploding, but the performance this year shows why holding onto leverage can still pay off. The costs of borrowings are now well above the portfolio's dividend yield, but hanging onto leverage also means further upside potential in a strong equity market. With the Fed nearing the end of rate hikes and potentially cutting in 2024 and 2025, that could also offer some relief for the fund. They cut their distribution last year, which sparked a significant discount opening up and presenting an opportunity to long-term patient investors.
For further details see:
ETG: Discounted Global Exposure