FSLR - First Solar: Pro Investors' Hedging Says Buy It Now
2023-03-28 04:00:19 ET
Summary
- Here we tell why First Solar, Inc. investors need Risk/Reward ratio comparisons in 2022 far more than Price/Earnings ratios in 2025. The R~R ratios tell today’s gains sooner, better.
- P/E ratios don’t provide risk measures comparable between stocks of different multiples, yet choices between stocks identified by Yahoo traffic as alternatives must be made.
- Further, odds on achievements of P/E ratios are never presented, while recorded odds of achieving R~R price targets always are.
- That makes the comparables table below a much better investing scale because what is being compared can always be matched and measured directly.
- This article is a market-expectancy near-term comparison report, not some guess about a years-from-now outcome of corporate competitive capabilities. Whether or not they could happen.
The primary focus of this article is First Solar, Inc. ( FSLR ).
Investment Thesis
Yes, the Market-Makers must have such forecasts, adjusted minute-by-minute each trading day by their upstairs desks' direct-wire connections to trading desks at billion-$ institutional portfolios.
Those forecasts are integral to hedging protections for MMs who must short shares for assembly and delivery in institutionally-ordered volume block-trades.
Daily we also collect those forecasts for stocks identified by Yahoo traffic as public investor investment alternatives to FSLR, plus over 4,000 others. Then we keep score on how well the MMs' forecasts compare to market price outcomes, following a standard, rigid, active investment portfolio management risk discipline,
Every investment involves a forecast of the future. Those forecasts must encompass the uncertainty of the future. The more future time is involved the larger the risk potential and the reward prospects. Both aspects should be compared to one another, and that balance accepted/rejected by the investor's need and purpose.
Description of Primary Investment Subject
First Solar, Inc. provides photovoltaic (PV) solar energy solutions in the United State, Chile, France, Japan, India, Canada, and internationally. The company also engages in manufacturing PV solar thin film semiconductor module technology. It serves developers and operators of systems, utilities, independent power producers, commercial and industrial companies, and other system owners. First Solar, Inc. was founded in 1999 and is headquartered in Tempe, Arizona."
Source: Yahoo Finance
Yahoo Finance
These growth estimates have been made by and are collected from Wall Street analysts to suggest what conventional methodology currently produces. The typical variations across forecast horizons of different time periods illustrate the difficulty of making value comparisons when the forecast horizon is not clearly defined
Comparison of Alternative Investments Risks & Rewards
Risk and Reward Balances
MM forecasts are of reasonable-to-expect price limits, both higher and lower. Their range, split by current market price, defines the balance of gain vs. loss prospects. Figure 1 shows those upper and lower limits of price change on the given date for each of the stocks identified by reader traffic on Yahoo and other internet services.
Figure 1
blockdesk.com
Upside price rewards are from the behavioral analysis (of what to do right, not of errors) by Market-Makers [MMs] as they protect their at-risk capital from possible damaging future price moves. Their potential reward forecasts are measured by the green horizontal scale.
The risk dimension is of actual price drawdowns at their most extreme point while being held in previous pursuit of upside rewards similar to the ones currently being seen. They are measured on the red vertical scale.
Both scales are of percent change from zero to 25%. Any stock or ETF whose present risk exposure exceeds its reward prospect will be above the dotted diagonal line. Capital-gain attractive to-buy issues are in the directions down and to the right.
Our principal interest is in FSLR at location [8]. A "market index" norm of reward~risk tradeoffs is offered by SPY at [10]. Most appealing by this Figure 1 view is FSLR.
This map provides a good visual comparison of the two most important aspects of every equity investment. There are other aspects of comparison which this map sometimes does not communicate well, particularly when general market perspectives like those of SPY are involved. Where questions of "how likely' are present other comparative tables, like Figure 2, may be useful.
Comparing Alternative Investment Expectations
Figure 2
Column headers for Figure 2 define investment-choice preference elements for each row stock whose symbol appears at the left in column [A]. The elements are derived or calculated separately for each stock, based on the specifics of its situation and current-day MM price-range forecasts. Data in red numerals are negative, usually undesirable to "long" holding positions. Table cells with yellow fills are of data for the stock of principal interest and of all issues at the ranking column, [R].
Readers familiar with our analysis methods may wish to skip to the next section viewing price range forecast trends for FSLR.
Why do all this math?
Figure 2's purpose is to attempt universally comparable answers, stock by stock, of a) How BIG the prospective price gain payoff may be, b) how LIKELY the payoff will be a profitable experience, c) how SOON it may happen, and d) what price drawdown RISK may be encountered during its holding period.
The price-range forecast limits of columns [B] and [C] get defined by MM hedging actions to protect firm capital required to be put at risk of price changes from volume trade orders placed by big-$ "institutional" clients.
[E] measures potential upside risks for MM short positions created to fill such orders, and reward potentials for the buy-side positions so created. Prior forecasts like the present provide a history of relevant price draw-down risks for buyers. The most severe ones actually encountered are in [F], during holding periods in effort to reach [E] gains. Those are where buyers are most likely to accept losses.
The Range Index [G] tells where today's price lies relative to the MM community's forecast of upper and lower limits of coming prices. Its numeric is the percentage proportion of the full low to high forecast seen below the current market price.
[H] tells what proportion of the [L] sample of prior like-balance forecasts have earned gains by either having price reach its [B] target or be above its [D] entry cost at the end of a 3-month max-patience holding period limit. [ I ] gives the net gains-losses of those [L] experiences.
What makes FSLR most attractive in the group at this point in time is its ability to produce earnings most consistently at its present operating balance between share price risk and reward. Credibility of the [E] upside prospect as evidenced in the [I] payoff is shown in [N]. Where for these stocks the most fatal (pink-fill) deficiencies lie.
Further Reward~Risk tradeoffs involve using the [H] odds for gains with the 100 - H loss odds as weights for N-conditioned [E] and for [F], for a combined-return score [Q]. The typical position holding period [J] on [Q] provides a figure of merit [ fom ] ranking measure [R] useful in portfolio position preferencing. Figure 2 is row-ranked on [R] among alternative candidate securities, with FSLR in top rank.
Along with the candidate-specific stocks these selection considerations are provided for the averages of some 3300 stocks for which MM price-range forecasts are available today, and 20 of the best-ranked (by fom ) of those forecasts, as well as the forecast for S&P 500 Index ETF ( SPY ) as an equity-market proxy.
As shown in column [T] of figure 2, those levels vary significantly between stocks. What matters is the net gain between investment gains and losses actually achieved following the forecasts, shown in column [I]. The Win Odds of [H] tells what proportion of the Sample RIs of each stock were profitable.
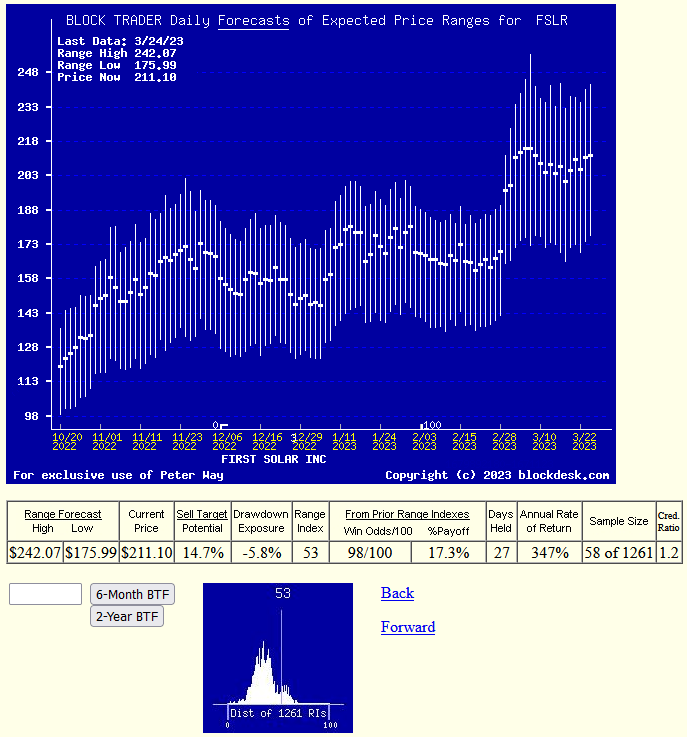
Recent Trends of Primary Subject Forecast FSLR
Figure 3
This is NOT a typical "technical analysis CHART" of PAST stock price history. Instead its vertical lines are a daily-updated visual forecast record of price range limits expected in the coming few weeks and months. The heavy dot in each vertical is the stock's closing price on the day the forecast was made.
From that market price point an explicit definition is made of the price reward and risk expectations which were being made at the time, with visual support of the balance between risk and reward. The measure of that balance is the Range Index. Here the RI indicates that about 1/2 of the full forecast range from $211 to $176 is downside, leaving a similar proportion to the upside.
Having such precise price expectation measures makes it much easier to make direct comparisons between all securities at each point in time, as was done in Figure 1.
The recorded histories of price range forecasts make it possible to understand how well each security performed in subsequent markets. It also reinforces under what Risk~Reward balance circumstances better forecasts were able to be made in the past and
Conclusion
The notion of which investment today?" is being answered in Figure 2 by Institutional Investor circles saying that First Solar, Inc. is the best capital gain opportunity in the Energy Stocks set. Its high odds of profitability in the next 3-5 months following prior price range forecasts like the present (58 of them, with 57 gains), net realizations having exceeded the +14.7% now seen likely, and average holding periods of a month and a week, all produce a triple-digit CAGR rate of return far beyond normal equity investment. Buy it now or you likely will soon wish you had.
For further details see:
First Solar: Pro Investors' Hedging Says Buy It Now