FSLR - First Solar: Shift To Solar Modules Supports Double-Digit Growth
2023-11-05 22:33:26 ET
Summary
- First Solar is a dominant player in the renewable energy sector with a strong order book and improving profit margins.
- The global solar power system market is valued at $113.22 billion with a forecast CAGR of 11%, presenting growth opportunities for solar panel manufacturers.
- FSLR's shift from Solar Power Systems to Solar Modules is positive for its profitability and growth outlook, as the solar modules market is larger and has higher growth potential.
- With the share price declining heavily over the past quarter, this provides a good entry opportunity to buy the stock.
In our previous analysis of First Solar, Inc. ( FSLR ), we compared the company to Sun Power and highlighted First Solar's dominant position in the renewable energy sector. We emphasized its strong order book, improving profit margins, and effective balance sheet management, which appeared promising for the company's future. However, it's worth noting that First Solar's total revenue showed minimal growth over the past decade, with an average 10-year revenue growth rate of only 0.49%. Despite this, there are high growth expectations, as the average analyst consensus projects a forward 3-year average growth rate of 29.4%. Therefore, we delved into the reasons behind the company's slow growth, examining its business segments, and assessed its growth prospects in the solar panel market while projecting its future growth potential.
Solar Power Market Outlook
| Market |
| Market Size ($ bln) |
| CAGR (2027) |
| Solar Power Systems |
| 113.22 |
| 11.0% |
| Solar PV Modules |
| 231.11 |
| 17.7% |
Source: Sky Quest , 360 Research Reports , Khaveen Investments
The global solar power system market is valued at $113.22 bln and has a forecast CAGR of 11% while the solar PV modules market is valued at $231.11 bln and has a higher forecast CAGR of 17.7%. One of the drivers of the higher market growth for Solar Modules is the increasing number of solar modules needed within a solar power system to generate higher electricity production. According to Energy Sage , the higher the amount of solar electricity production, the higher the number of solar panels needed. Based on data from Energy Sage, we calculated for a solar power system that generates 1,000 kWh of electricity, around 1.7 panels are required. On the other hand, to generate 10,000 kWh of electricity, around 17 panels in a system are required.
Market Growth Drivers
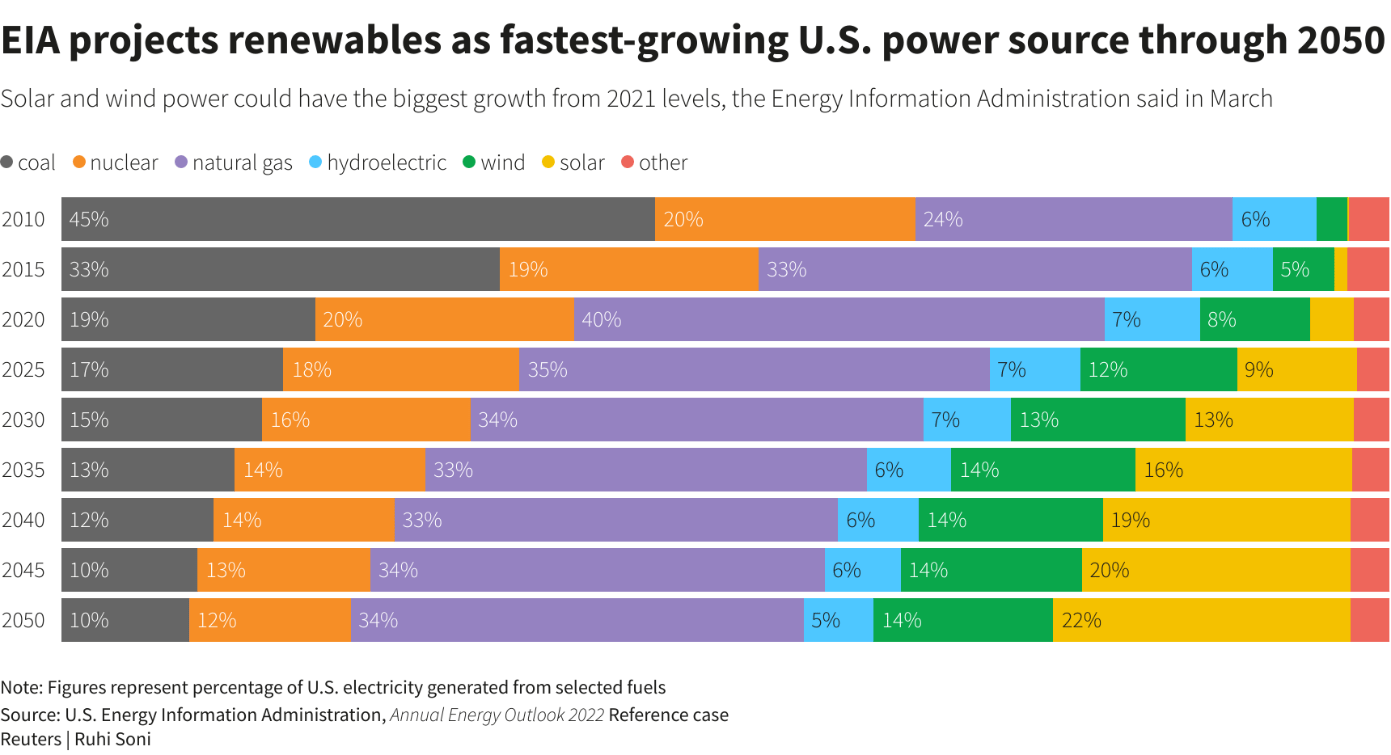
Based on the chart above, the share of solar US power sources is expected to increase the highest through 2025, reaching a projected share of 22% from 9% in 2025 according to the US EIA. In our previous analysis of the renewables energy industry, some of the market growth drivers that we identified were:
- Government-Imposed Regulatory Policies : Globally, 165 countries and over 600 cities are committed to increasing their use of renewable energy sources. In the US, 24 states have implemented Renewable Portfolio Standards (RPS) with diverse clean energy goals. For example, New York's Climate Leadership and Community Protection Act (CLCPA) sets an ambitious target of 70% renewable electricity by 2030 and additional offshore wind and solar projects by 2025.
- Government Incentives : Incentives like tax credits and subsidies that serve to lower costs and promote the adoption of solar energy. For example, the US introduced the IRA Act in 2022 including "tax incentives worth a total of $259 bln for 9 years from 2023 through 2032".
- Increasing Efficiency : According to JA Solar, solar panel efficiency is expected to increase through 2025, with their average efficiency rising from 25.4% to 26.2% at a CAGR of 1.04%.
- Decreasing Cost : Solar PV costs declined at a CAGR of -28.5% between 2010 and 2020 according to IRENA. Additionally, IRENA forecasts a CAGR of -1.4% for solar PV costs to continue decreasing by 41% from 2018 to reach $0.05 per kWh by 2050.
Industry Tariffs
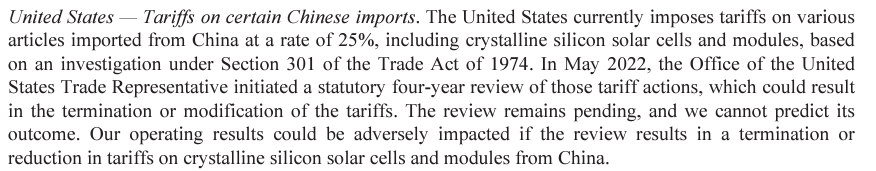
According to its annual report , the US had placed tariffs on Chinese imports of solar cells and modules into the US at a rate of 25%. According to Reuters , "anti-dumping duties" had been imposed on Chinese solar panels "after a Commerce probe found Chinese companies were receiving unfair government subsidies that kept their prices artificially low."
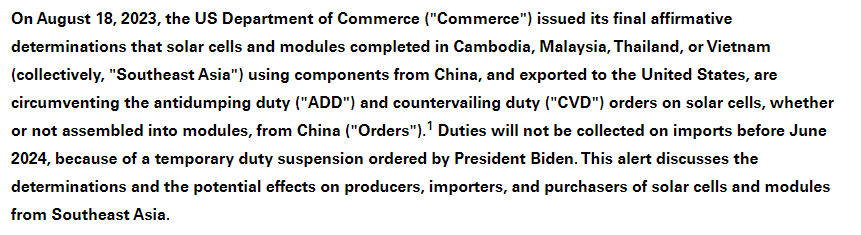
In 2023, the US government introduced stricter measures to prevent Chinese companies from bypassing tariffs on Chinese solar panels. The new decision followed the Commerce Department's findings that companies in these Southeast Asian nations were evading established tariffs. As reported by Bloomberg , solar cells and modules exported from Southeast Asian countries like Cambodia, Malaysia, Thailand, and Vietnam may be subjected to tariffs as high as 254% in June 2024. However, the new regulation allows Southeast Asian manufacturers to avoid the tariffs if they prove that only limited components are used in manufacturing.
Market Share
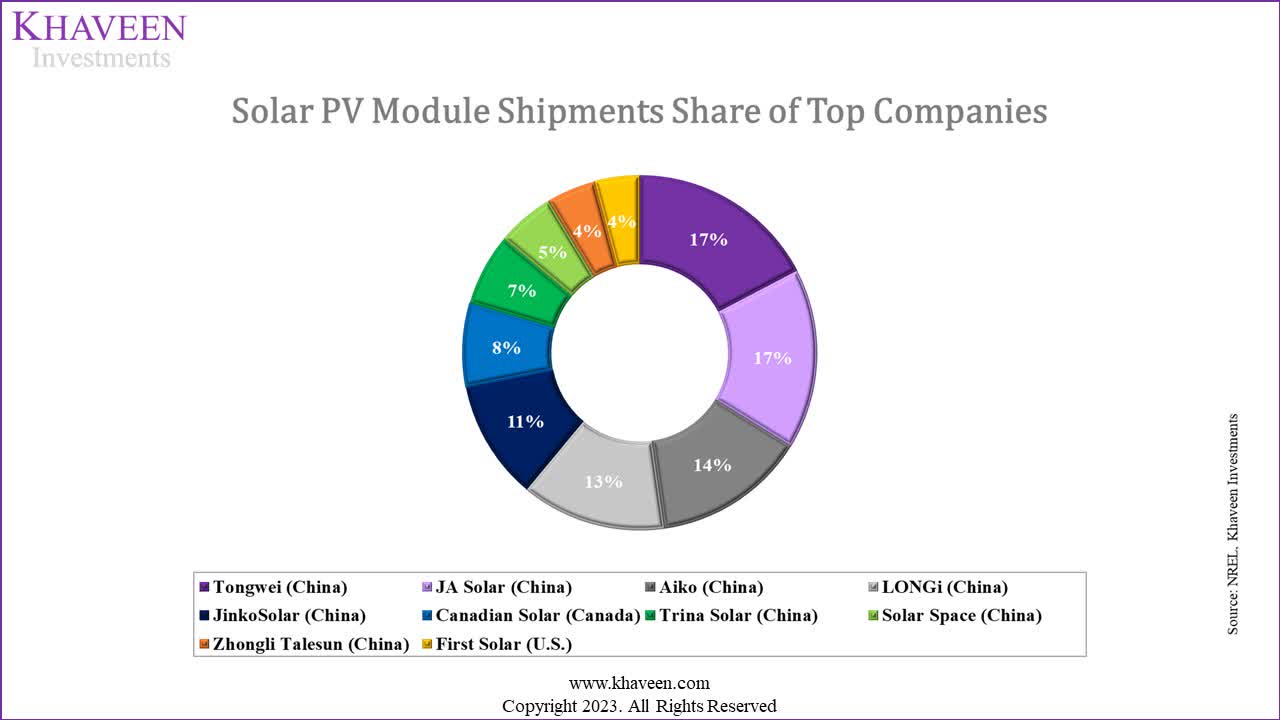
Furthermore, the company claimed that it is "the world's largest thin film PV solar module manufacturer and the largest PV solar module manufacturer in the Western Hemisphere". We examined its market positioning by compiling the share of the top 10 companies' module shipments by NREL below.
As seen in the chart , First Solar only has a share of 4% in the Solar Module manufacturing market in terms of PV shipments. Most of the market is dominated by Chinese companies, as China has the highest share of PV module manufacturing as seen below. In North America, First Solar's total shipment is lower than Canadian Solar's. Therefore, we find First Solar is smaller than other competitors in terms of solar PV shipments but still among one of the notable players in the market.
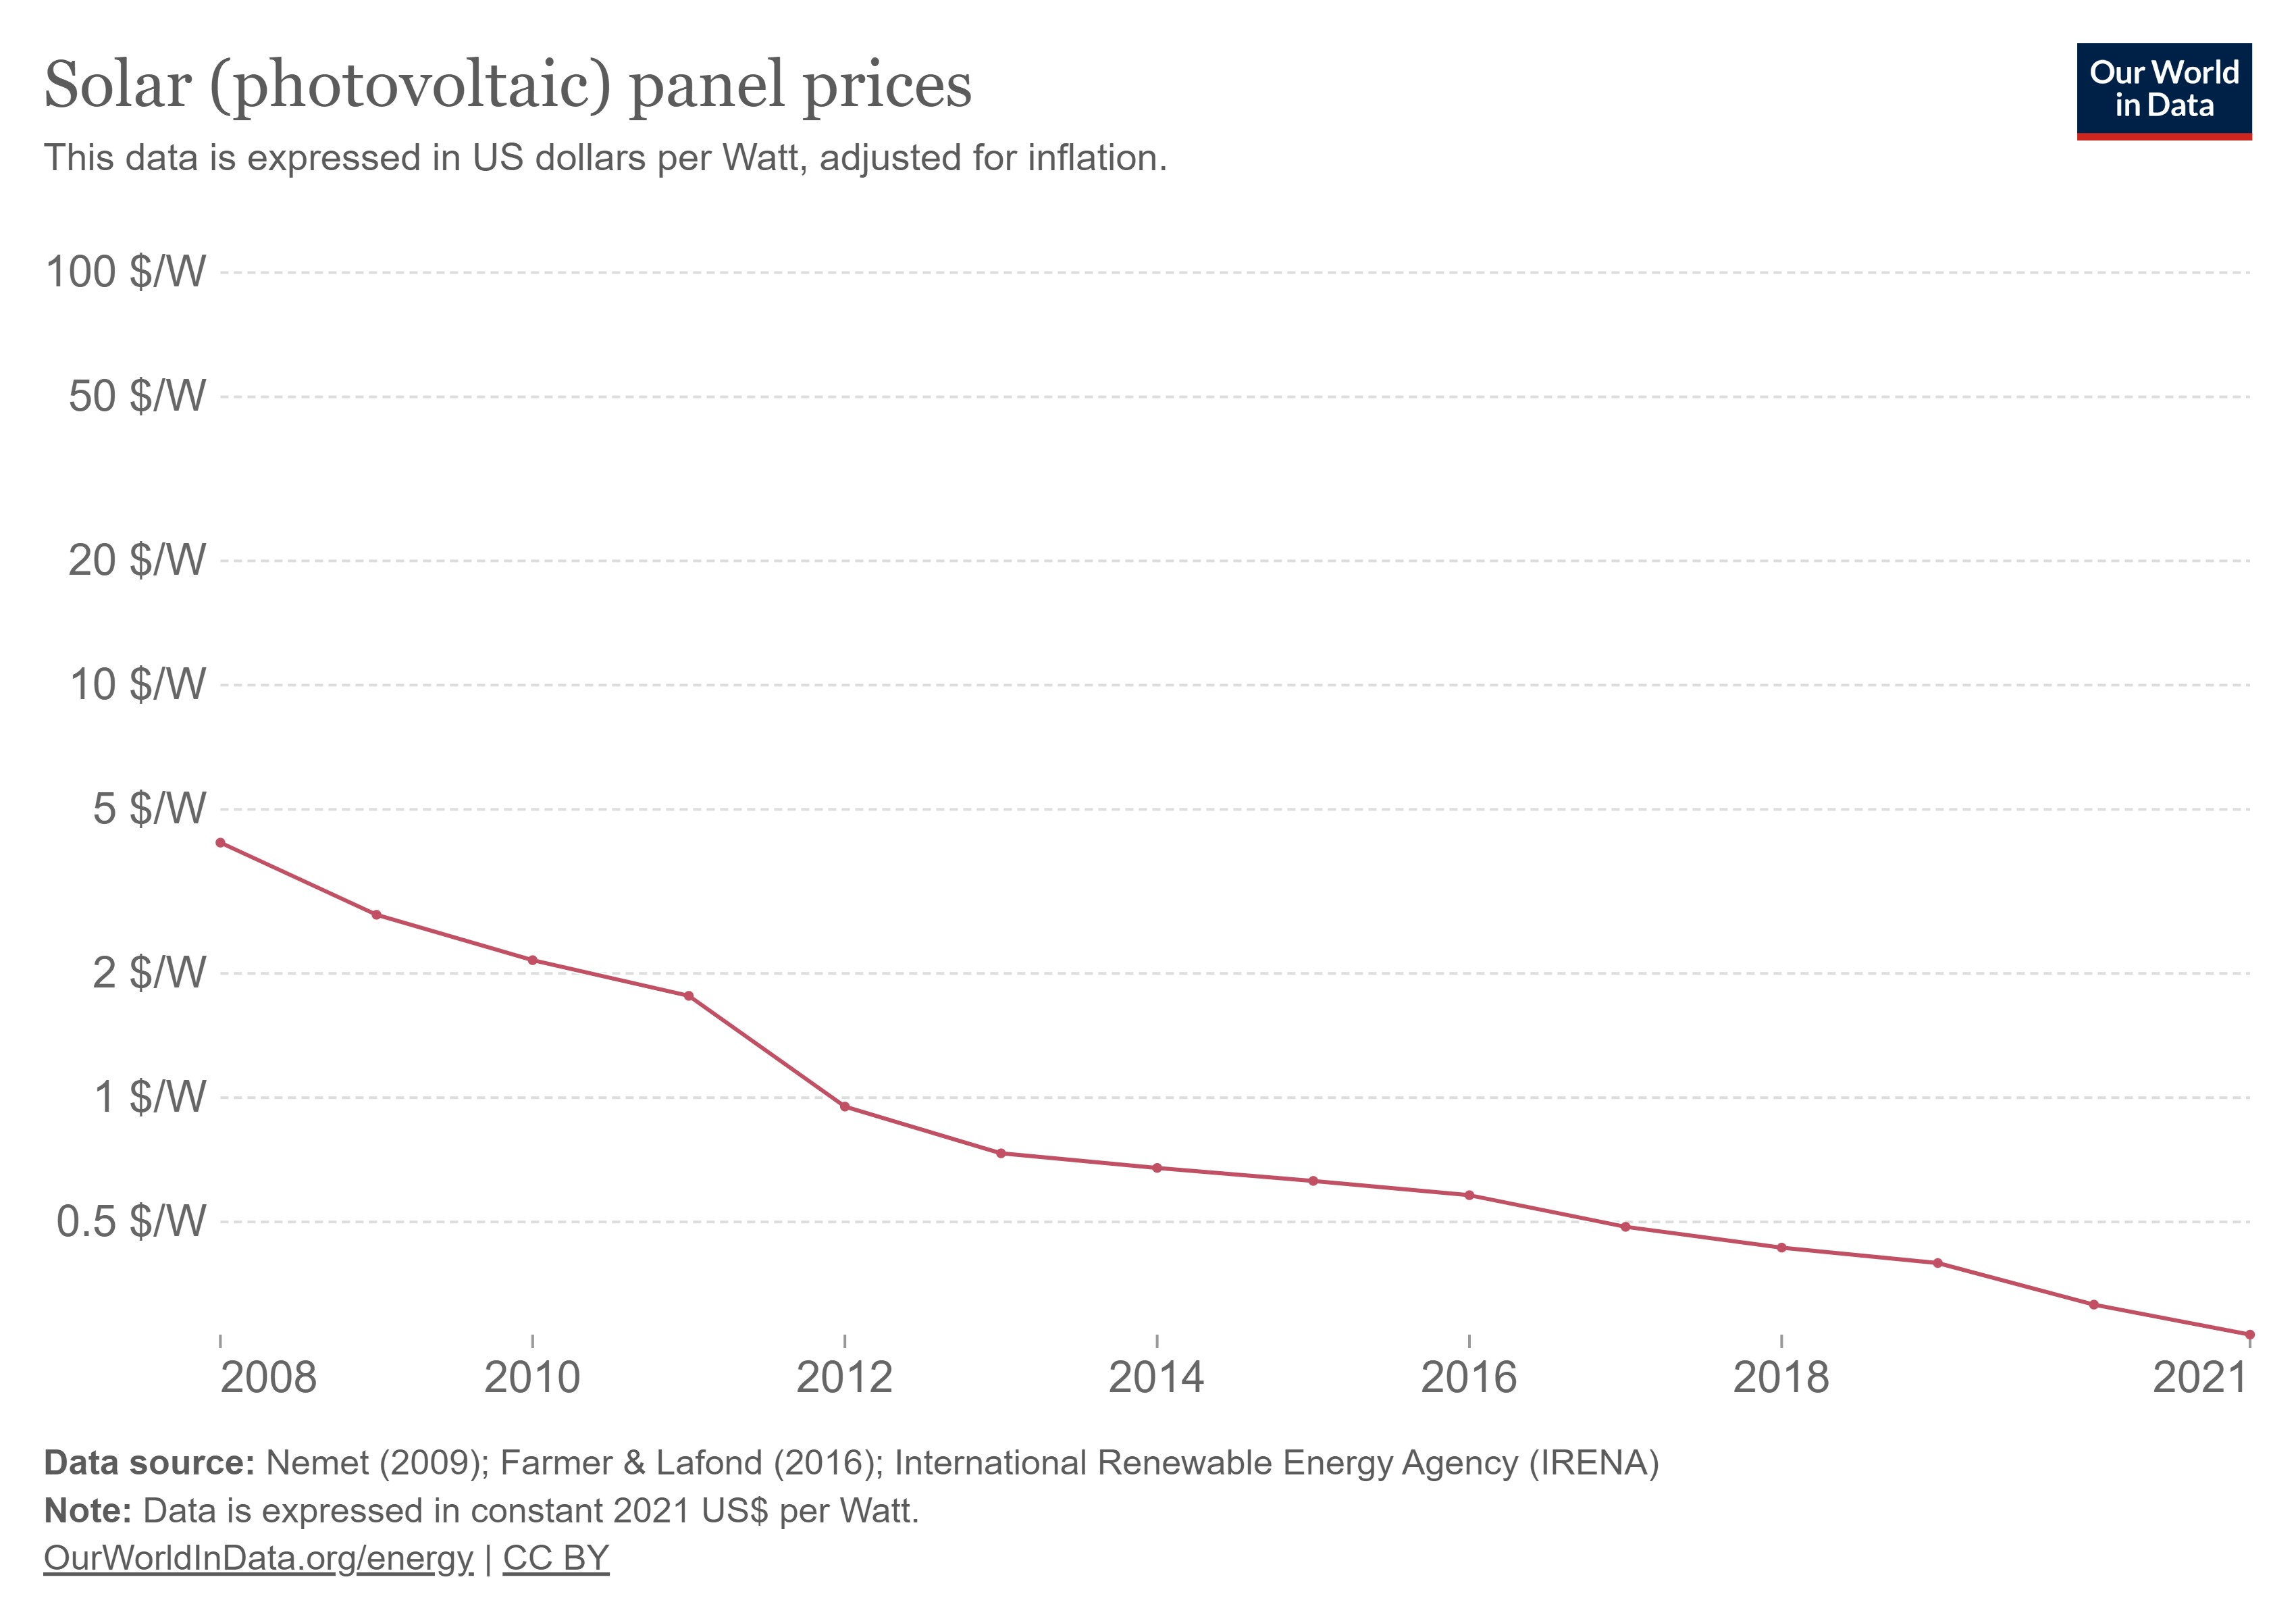
According to Scientific American , China's dominance in the solar panel manufacturing market is attributed to its vast scale and efficient production capabilities which allowed it to produce solar products at a significantly lower cost . From 2008 to 2013, China's solar panel industry reduced world prices by 82% as seen in the chart from $4.15 to $0.73 per watt. Beyond 2013, the price further declined by 63% by 2021. A reason for this is China's position as one of the lowest cost regions in the world as evidenced by KPMG's Primary Cost Index .
| Company |
| Shipments ((GW)) |
| Solar PV Revenue ($ mln) 2022 |
| Revenue/GW ($ mln per GW) |
| Tongwei |
| 38.1 |
| 16,303 |
| 428 |
| JA Solar |
| 36.2 |
| 10,700 |
| 296 |
| Aiko |
| 30.7 |
| 5,207 |
| 170 |
| LONGi |
| 29.2 |
| 3,190 |
| 109 |
| JinkoSolar ( JKS ) |
| 23.9 |
| 11,630 |
| 487 |
| Canadian Solar |
| 16.8 |
| 6,976 |
| 415 |
| Trina Solar |
| 14.5 |
| 12,645 |
| 872 |
| Solar Space |
| 11.6 |
| 1,862 |
| 161 |
| Zhongli Talesun |
| 9.8 |
| N/A |
| N/A |
| First Solar |
| 9.1 |
| 2,428 |
| 267 |
Source: Company Data, Khaveen Investments
Furthermore, in terms of pricing comparison, we compared the top companies by dividing their revenue in 2022 with their shipments to determine whether the Chinese competitors have lower pricing compared to Canadian Solar and First Solar. From the table, the company with the highest revenue per GW is Trina Solar at $872, an outlier that could be due to its revenue including its other business segments such as PV systems. On average, the Chinese company's revenue per GW is $275 excluding Trina Solar. This average is fairly close to First Solar's revenue per GW of $267. On the other hand, Canadian Solar's revenue per GW of $415 is significantly higher than First Solar's and the Chinese average. Overall, the average revenue per GW of the Chinese companies is lower ($275) compared to non-Chinese companies (First Solar and Canadian Solar) at $341. However, Canadian Solar's revenue per GW is significantly higher at $415, which we believe could be due to US tariffs as 73% of its long-lived assets are in China. In comparison, First Solar does not manufacture in China but instead depends heavily on other Asian regions such as Malaysia and Vietnam which are tied with China in KPMG's Primary Cost Index as the most competitive regions.
Summary
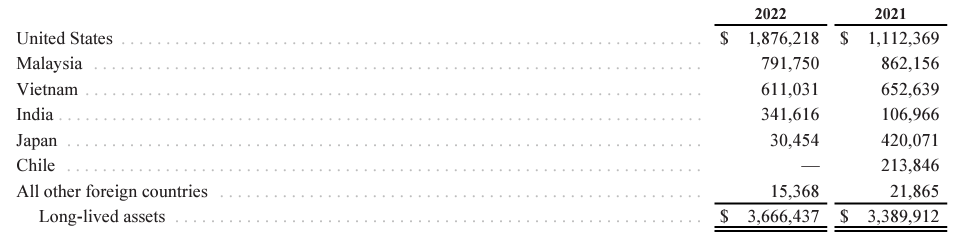
Overall, we believe the solar market growth outlook is positive due to market growth drivers such as government policies, incentives, increasing efficiency and decreasing costs which bodes well for companies including First Solar which is one of the top solar companies in the world and is more competitive than its larger competitor Canadian Solar in North America with a lower revenue per GW, indicating cost advantages with production in Southeast Asia. Based on the company's long-lived assets breakdown, the company's majority of assets are in the US (49%), followed by several Southeast Asian countries where it has manufacturing plants such as Malaysia and Vietnam. From its investor presentation, 64% of its total capacity is planned to be derived from Malaysia, Vietnam and India in 2023. Importantly, the company does not have any manufacturing capacity in China. Nonetheless, according to the KPMG Primary Cost Index, China is tied with Malaysia and Vietnam at the top of the rankings with the lowest costs, while India trailed behind these countries closely. Therefore, we believe that in contrast to Chinese competitors, First Solar stands to benefit from expanded regulations and tariffs targeting Chinese companies producing in Southeast Asia to circumvent US tariffs.
Shift from Solar Power Systems to Solar Modules
According to its annual report, its revenue segments consist of two main segments which are Solar Modules and Solar Power Systems. The Solar Modules segment involves solar modules manufacturing for solar power systems. Whereas its Solar Power Systems segment develops and sells solar power systems, offering maintenance services, using the modules they produce. These solar modules, also known as solar panels or PV modules, convert sunlight into electricity using interconnected solar cells within a protective layer. Solar power systems incorporate these modules, along with inverters, batteries, and mounting structures to convert solar energy into electricity.
| First Solar Revenue by Segments ($ mln) |
| 2016 |
| 2017 |
| 2018 |
| 2019 |
| 2020 |
| 2021 |
| 2022 |
| 2023F |
| Average |
| Solar Modules |
| 675 |
| 806 |
| 502 |
| 1,460 |
| 1,736 |
| 2,331 |
| 2,428 |
| 3,283 |
| Growth % |
| 197.0% |
| 19.4% |
| -37.7% |
| 190.9% |
| 18.9% |
| 34.3% |
| 4.2% |
| 35.2% |
| 61.0% |
| Solar Power Systems |
| 1,132 |
| 1,927 |
| 1,244 |
| 1,149 |
| 795 |
| 513 |
| 153 |
| 26 |
| Growth % |
| -44.8% |
| 70.2% |
| -35.4% |
| -7.7% |
| -30.8% |
| -35.4% |
| -70.1% |
| -83.1% |
| -22.0% |
| Others |
| 1,097 |
| 208 |
| 498 |
| 454 |
| 180 |
| 79 |
| 38 |
| 2 |
| Growth % |
| -40.1% |
| -81.1% |
| 139.6% |
| -8.8% |
| -60.3% |
| -56.4% |
| -52.0% |
| -94.4% |
| -22.7% |
| Total |
| 2,905 |
| 2,941 |
| 2,244 |
| 3,063 |
| 2,711 |
| 2,923 |
| 2,619 |
| 3,311 |
| Growth % |
| -29.4% |
| 1.3% |
| -23.7% |
| 36.5% |
| -11.5% |
| 7.8% |
| -10.4% |
| 26.4% |
| -4.2% |
Source: Company Data, Khaveen Investments
Based on the table of the company's segment revenues in the past 7 years, its two main segments displayed different growth trends. Its Solar Modules segment performed better with an average growth in the period of 61%, significantly higher than the company's total revenue growth. Based on its annual report, its revenue growth was mainly driven by strong volume growth while ASPs declined.
| First Solar Module Revenue Growth % |
| 2017 |
| 2018 |
| 2019 |
| 2020 |
| 2021 |
| 2022 |
| Volume |
| 68% |
| -34% |
| 180% |
| 21% |
| 48% |
| 20% |
| ASP |
| -29% |
| -6% |
| 4% |
| -2% |
| -10% |
| -13% |
| Module Revenue |
| 19.4% |
| -37.7% |
| 190.9% |
| 18.9% |
| 34.3% |
| 4.2% |
Source: Company Data, Khaveen Investments
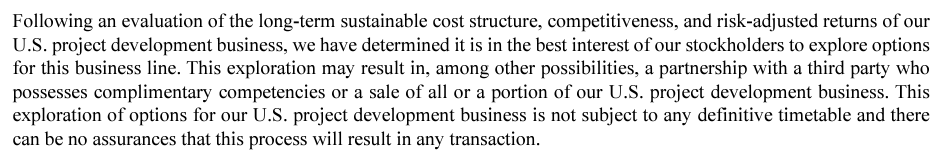
On the other hand, its Solar Power Systems segment underperformed with an average growth rate of -22% in the period. It had negative growth in all years except in 2017. Based on its annual reports , we identified that the company explained the decrease in the segment's results primarily due to divestitures of its project development business as well as the completion of existing projects between 2016 and 2019. For example, of its divestitures, in 2022, the company completed the sale of its Japan project development business and operations to PAG and other international O&M operations to Clairvest Group. In 2021, the company sold its project development operations in the US to Leeward Renewable Energy Development.
Overall, the decline of its Solar Power Systems and the rise of its Solar Modules business highlights the shift from Solar Power Systems to Solar Modules. The share of revenues from Solar Modules increased from 34% in 2016 to 94% in 2022. Based on its 2019 annual report, the company highlighted that the company was looking to exit its project development business due to cost and competitiveness factors as shown below.
In terms of competitiveness, we find this to be true as according to Solar Builder, the US solar power systems market has become increasingly competitive with smaller players entering the market and gaining share between 2017 and 2021. Furthermore, in terms of cost structure, compared to the top 2 publicly listed solar power systems companies, First Solar's 5-year gross and net margins are higher at 18.3% vs 16.09% and 6.34% vs -1.47%. Thus, we believe this indicates the higher profitability of the solar modules business segment.
Furthermore, we believe other reasons for the company's decision to focus on solar modules are the larger market size (2x larger) and higher growth outlook (7% higher) of the solar modules market in comparison with the solar power systems market as explained in the previous point. By focusing on solar module manufacturing, the company is narrowing its involvement in the value chain to solar PV manufacturers only and selling its modules to solar system installers.
To conclude, we believe that the company's shift from Solar Power Systems to the Solar Modules segment is positive for its outlook as it is already one of the top companies in the Solar Modules market in North America, trailing only behind Canadian Solar compared to the solar power systems market in the US which has been increasingly competitive with the entrants of small companies gaining market share. Additionally, we also believe its shift to the Solar Modules segment is positive for its profitability with higher gross and net margins compared to solar power systems. Also, we believe the company focuses on solar modules due to the larger and higher growth outlook of the solar modules market. We forecast its full-year 2023 revenues to increase by 26.4%, driven mainly by its Solar Modules segment based on its Q3 YTD YoY growth of 35.2%. In comparison, this is fairly close to management's guidance at a midpoint of $3.5 bln.
Positive Growth Outlook
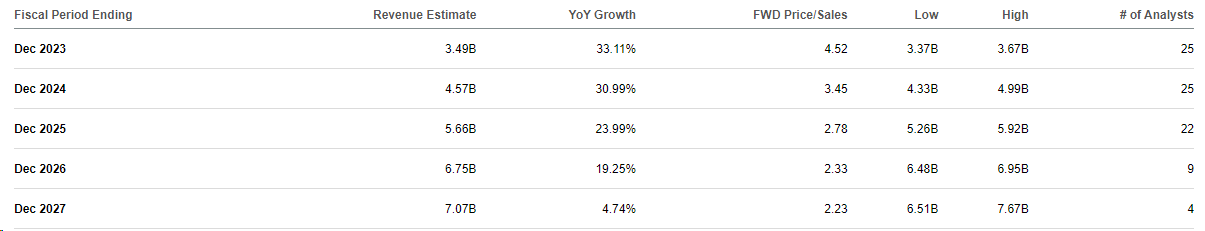
Furthermore, according to analyst consensus for its revenue estimates, the company has a strong forward 3-year average growth of 29.4%.
We examined whether its growth outlook could be achievable and sustainable. Firstly, we analyzed its manufacturing capacity growth projection from the company.
Capacity Expansions
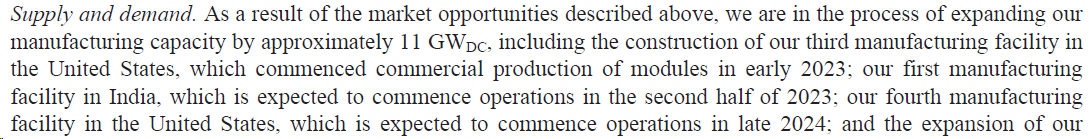
From its annual report, the company highlighted its manufacturing capacity expansion plans across the US and India. Based on its latest earnings briefing , the company has completed its expansion in India and is proceeding with its US expansions in Louisiana, Ohio and Alabama.
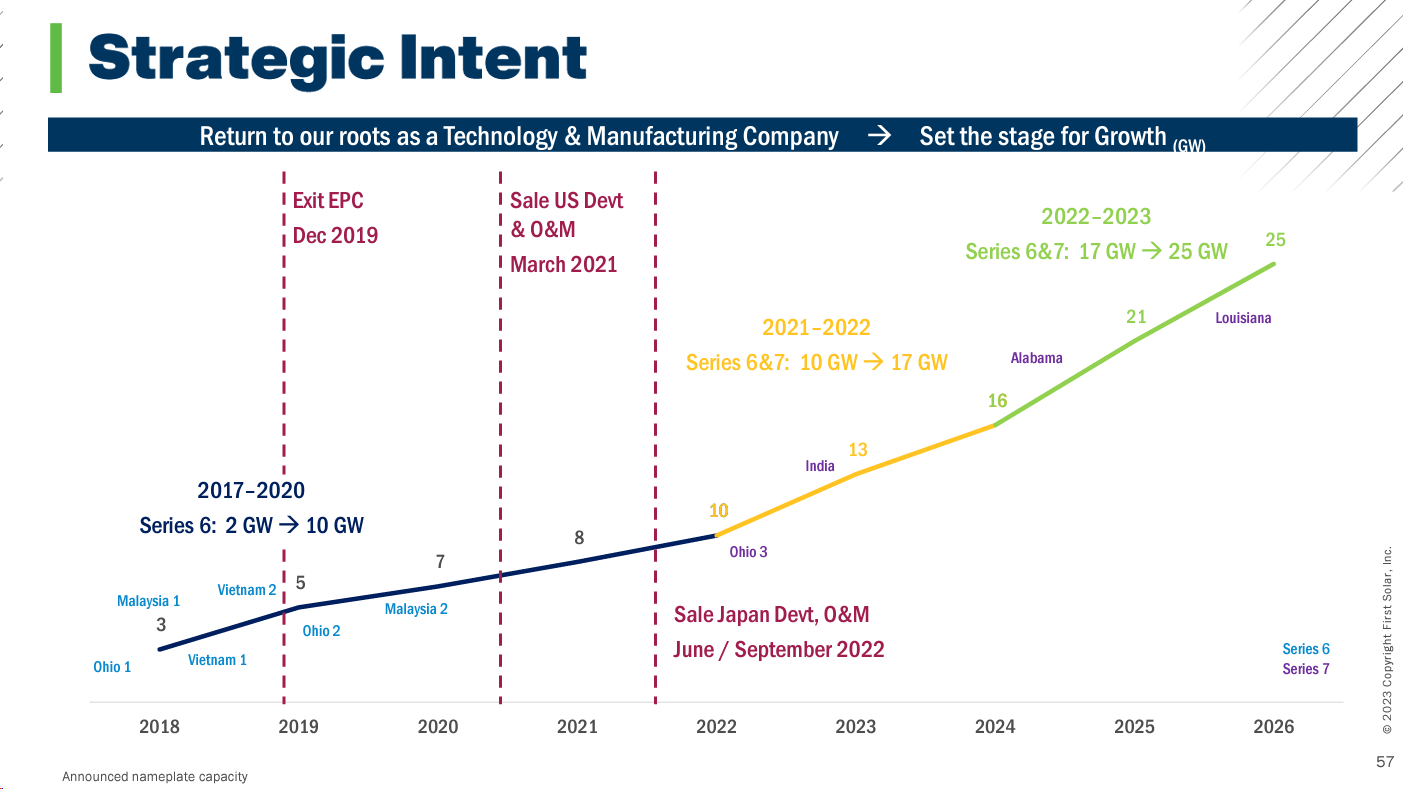
Furthermore, according to the company's Analyst Day presentation , First Solar plans to increase its manufacturing capacity to 25GW by 2026 from 10GW in 2022, which translates to a CAGR of 25.7%. Overall, we believe its planned expansion is positive to support its growth. From its earnings briefing, management stated that its backlog was 81.8GW, which is 6.3x its planned total capacity in 2023.
Revenue Breakdown
Company Data, Khaveen Investments
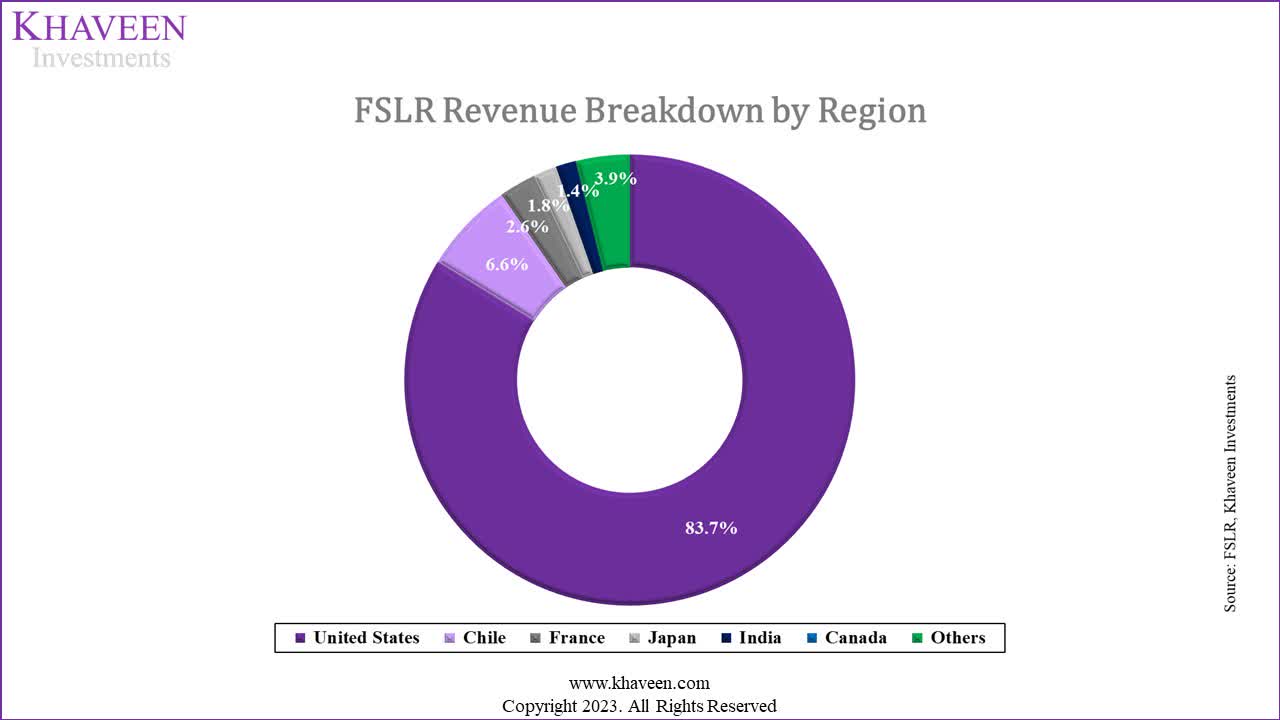
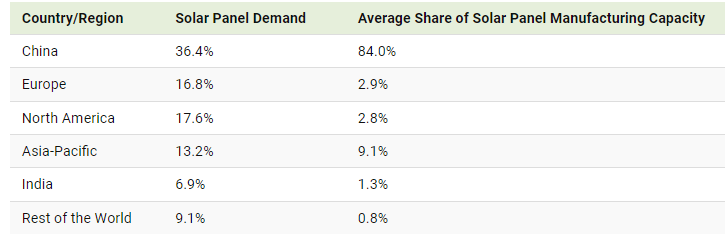
Based on its revenue breakdown by region, its largest market is the US accounting for 83% of its revenues. According to its website , the company highlighted that its "Series 7 T1 is Made in America exclusively for the US utility-scale market" which indicates its focus on the geographic region. Based on the chart below, North America is the second largest region in terms of solar panel demand behind China, though, the share of manufacturing capacity in North America is only 2.8%, which highlights the huge demand-supply gap in the region in which the company could try to capitalize on.
Revenue Projections
| First Solar Revenue Projections ($ mln) |
| 2022 |
| 2023F |
| 2024F |
| 2025F |
| 2026F |
| 2027F |
| Solar Modules |
| 2,428 |
| 3,283 |
| 4,069 |
| 5,043 |
| 6,251 |
| 7,747 |
| Growth % |
| 35.2% |
| 23.9% |
| 23.9% |
| 23.9% |
| 23.9% |
| Solar Power Systems |
| 153 |
| 26 |
| 20 |
| 16 |
| 12 |
| 10 |
| Growth % |
| -22.0% |
| -22.0% |
| -22.0% |
| -22.0% |
| -22.0% |
| Others |
| 38 |
| 2 |
| 2 |
| 2 |
| 2 |
| 2 |
| Total |
| 2,619 |
| 3,311 |
| 4,092 |
| 5,061 |
| 6,265 |
| 7,759 |
| Growth % |
| 26.4% |
| 23.6% |
| 23.7% |
| 23.8% |
| 23.8% |
Source: Company Data, Khaveen Investments
Overall, we believe the main reason the company's forward growth could be higher than in the past is due to its shift from Solar Power Systems to Solar Modules having completed as Solar Power Systems now represents an insignificant portion of revenues in 2023. We projected the company's revenue growth based on its Solar Modules in 2023 based on its Q3 2023 YTD performance and Solar Power Systems based on its prorated Q1 to Q3 results. Beyond 2023, for its Solar Modules segment, we derived a growth rate of 23.9% factoring in volume growth of 25.7% based on its planned expansion CAGR through 2026 and ASP decline of -1.7% per year based on the decreasing cost driver in the first point. For its Solar Power Systems segment, we based its growth on its past 5-year average of -22% as it shifts its focus to Solar Modules. In total, we forecasted a forward 5-year average growth rate of 24.3% and a forward 3-year average growth rate of 24.7%, which is in line with analyst consensus (29.4%).
Risk: Stricter Regulations and Tariffs
While we mentioned that the company could benefit from the expansion of the US government's tariffs on Chinese companies producing in Southeast Asia with exemptions for manufacturers with limited use of Chinese components in production, we believe the company could be impacted if the US government decides to impose stricter restrictions on Southeast Asia exports.
Verdict
We are optimistic about the solar market's growth outlook, driven by factors like government policies, incentives, increased efficiency, and reduced costs, benefiting companies like First Solar. It's more competitive than Canadian Solar in North America, with lower revenue per GW, indicating cost advantages in Southeast Asia production. Moreover, we believe First Solar stands to gain from regulations and tariffs targeting Chinese firms producing in Southeast Asia, bypassing US tariffs.
Additionally, we believe the company's shift to the Solar Modules segment is positive, as it is a top player in North America, second only to Canadian Solar. This contrasts with the increasingly competitive US solar power systems market. Additionally, this shift enhances profitability due to higher gross and net margins compared to solar power systems. Furthermore, we believe the main reason for the company's forward growth could be higher than its the past is due to its shift from Solar Power Systems to Solar Modules having completed as Solar Power Systems represent only a minor portion of revenues. We anticipate a forward 3-year average revenue growth rate of 24.7%, slightly below the analyst's consensus.
| Valuation ($ mln) |
| 2024 |
| Revenue |
| 4,092 |
| Growth % |
| 23.6% |
| P/S |
| 4.39 |
| Valuation |
| 17,962 |
| Shares Outstanding |
| 107 |
| Price Target ($) |
| 168.11 |
| Current Price ($) |
| 147.59 |
| Upside |
| 13.9% |
Source: Khaveen Investments
We valued the company based on a P/S valuation as the company has negative FCF margins despite its profitability due to capex for expansion. Based on its 3-year average P/S of 4.39x, we derived an upside of 13.9% from our 2024 revenue forecasts, thus we rate the company as a Buy. Important to note that the valuation is a result of the company's stock price having declined by 25% in the past 3 months, which provides an opportunity to pick up the company shares.
For further details see:
First Solar: Shift To Solar Modules Supports Double-Digit Growth