CA - Freeport-McMoRan: Copper Giant With Potential For The Energy Transition
2023-06-28 09:00:35 ET
Summary
- Freeport-McMoRan is a leading international mining company specializing in copper, gold, and molybdenum, with operations spanning multiple continents.
- Despite fluctuating copper prices, FCX has shown resilience and profitability, benefiting from elevated copper prices in recent years and increased copper production.
- The company's long-term growth potential remains promising, especially if China's economy shows signs of recovery, making FCX an attractive investment option.
- The potential for a new stimulus package and revitalized economic growth in China presents a significant catalyst for copper futures and companies like FCX, offering further upside potential.
- We believe FCX stock is a buy for the long term at its current valuation.
Introduction
Freeport-McMoRan ( FCX ) is a leading international mining company specializing in the exploration, development, and production of copper, gold, and molybdenum.
With operations spanning multiple continents, including North and South America, Indonesia, and Africa, Freeport-McMoRan is renowned for its mining expertise and vast reserves of valuable metals.
The company has strategically placed its mining assets and ongoing exploration to contribute significantly to the global supply of copper and other essential resources, making Freeport-McMoRan a key player in the mining industry.
In this article, we will delve into the future trends of copper prices and their probable impact on FCXs profitability. Additionally, we will discuss the potential influence China's economy, which has yet to show real signs of recovery after Beijing ended its COVID restrictions, will have on the demand for copper.
Copper might have found its footing
Copper futures came down after the highs at the beginning of 2022 and dropped significantly by the end of Q2 that same year as the global economic outlook worsened. It is crucial to be aware that copper is typically seen as a leading indicator of economic health and growth due to its wide array of uses within several key industries. For that reason, global economic sentiment can move copper prices quite significantly.
We have already outlined this in one of our previous articles , which we highly suggest you read as we outline our arguments for elevated copper prices in the long term in greater detail there.
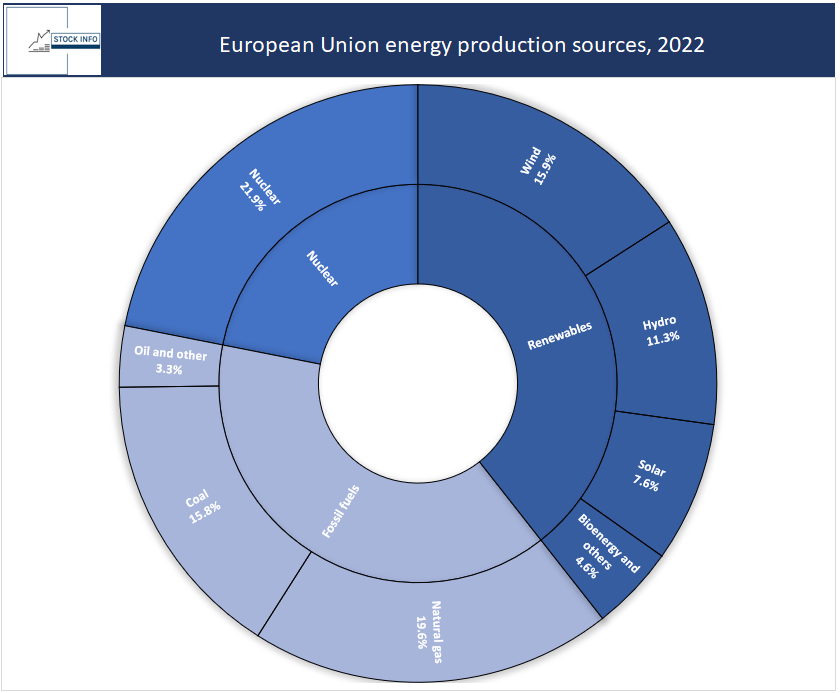
One of the critical arguments, however, is that the EU and many other countries have pledged to reach net-zero CO2 emissions by 2050, which will require a significant restructuring of the energy infrastructure. As of 2022, 39.4% of Europe’s energy production came from renewable sources, while 38.7% came from fossil fuels and 21.9% from nuclear energy, as seen in the figure below.
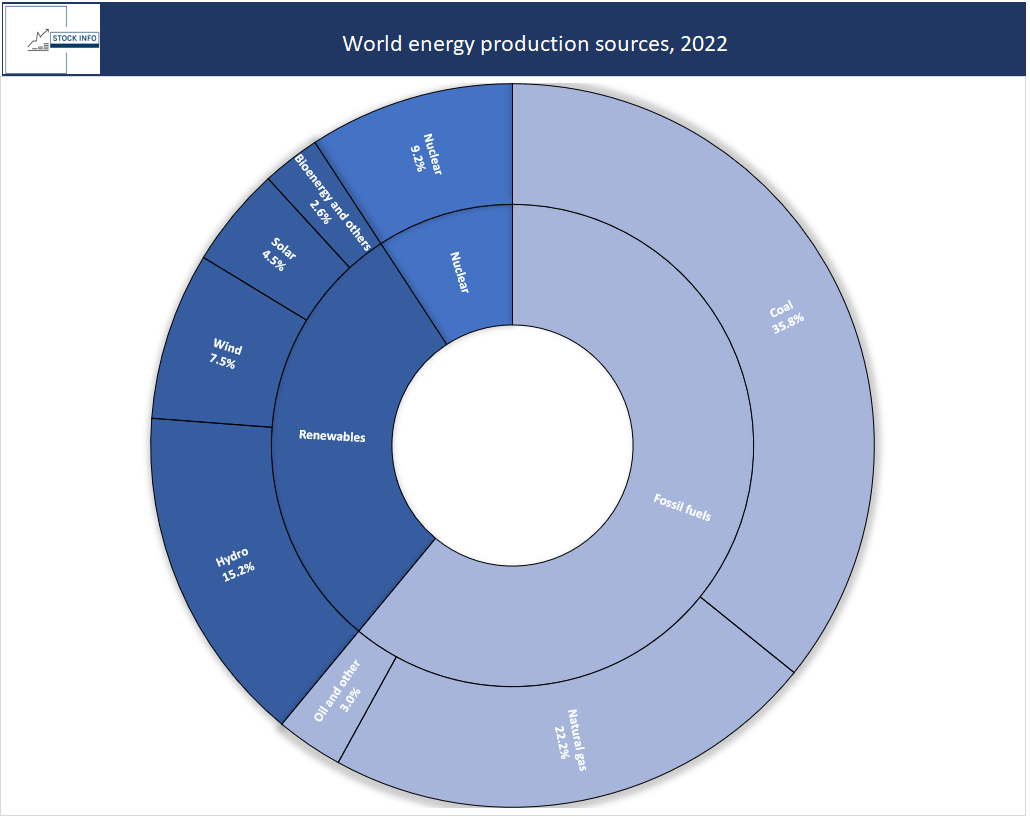
While Europe is well underway to more sustainable energy production, the world is far from near the levels required to uphold the goal of neutral CO2 emissions, as seen in the figure below.
The green transition towards more renewable energy relies heavily on copper due to its high usage in electronic components for windmills, solar panels, electric vehicles, etc.
In addition, we also laid out a possible scenario for a significant supply shortage in the near future, as many of the biggest copper-producing countries have either slowed down their investments into new copper mining facilities or are facing civil unrest that disrupts the supply chain.
In summary, we see a real possibility of supply not being able to follow the demand for copper that will come from several global infrastructure projects.
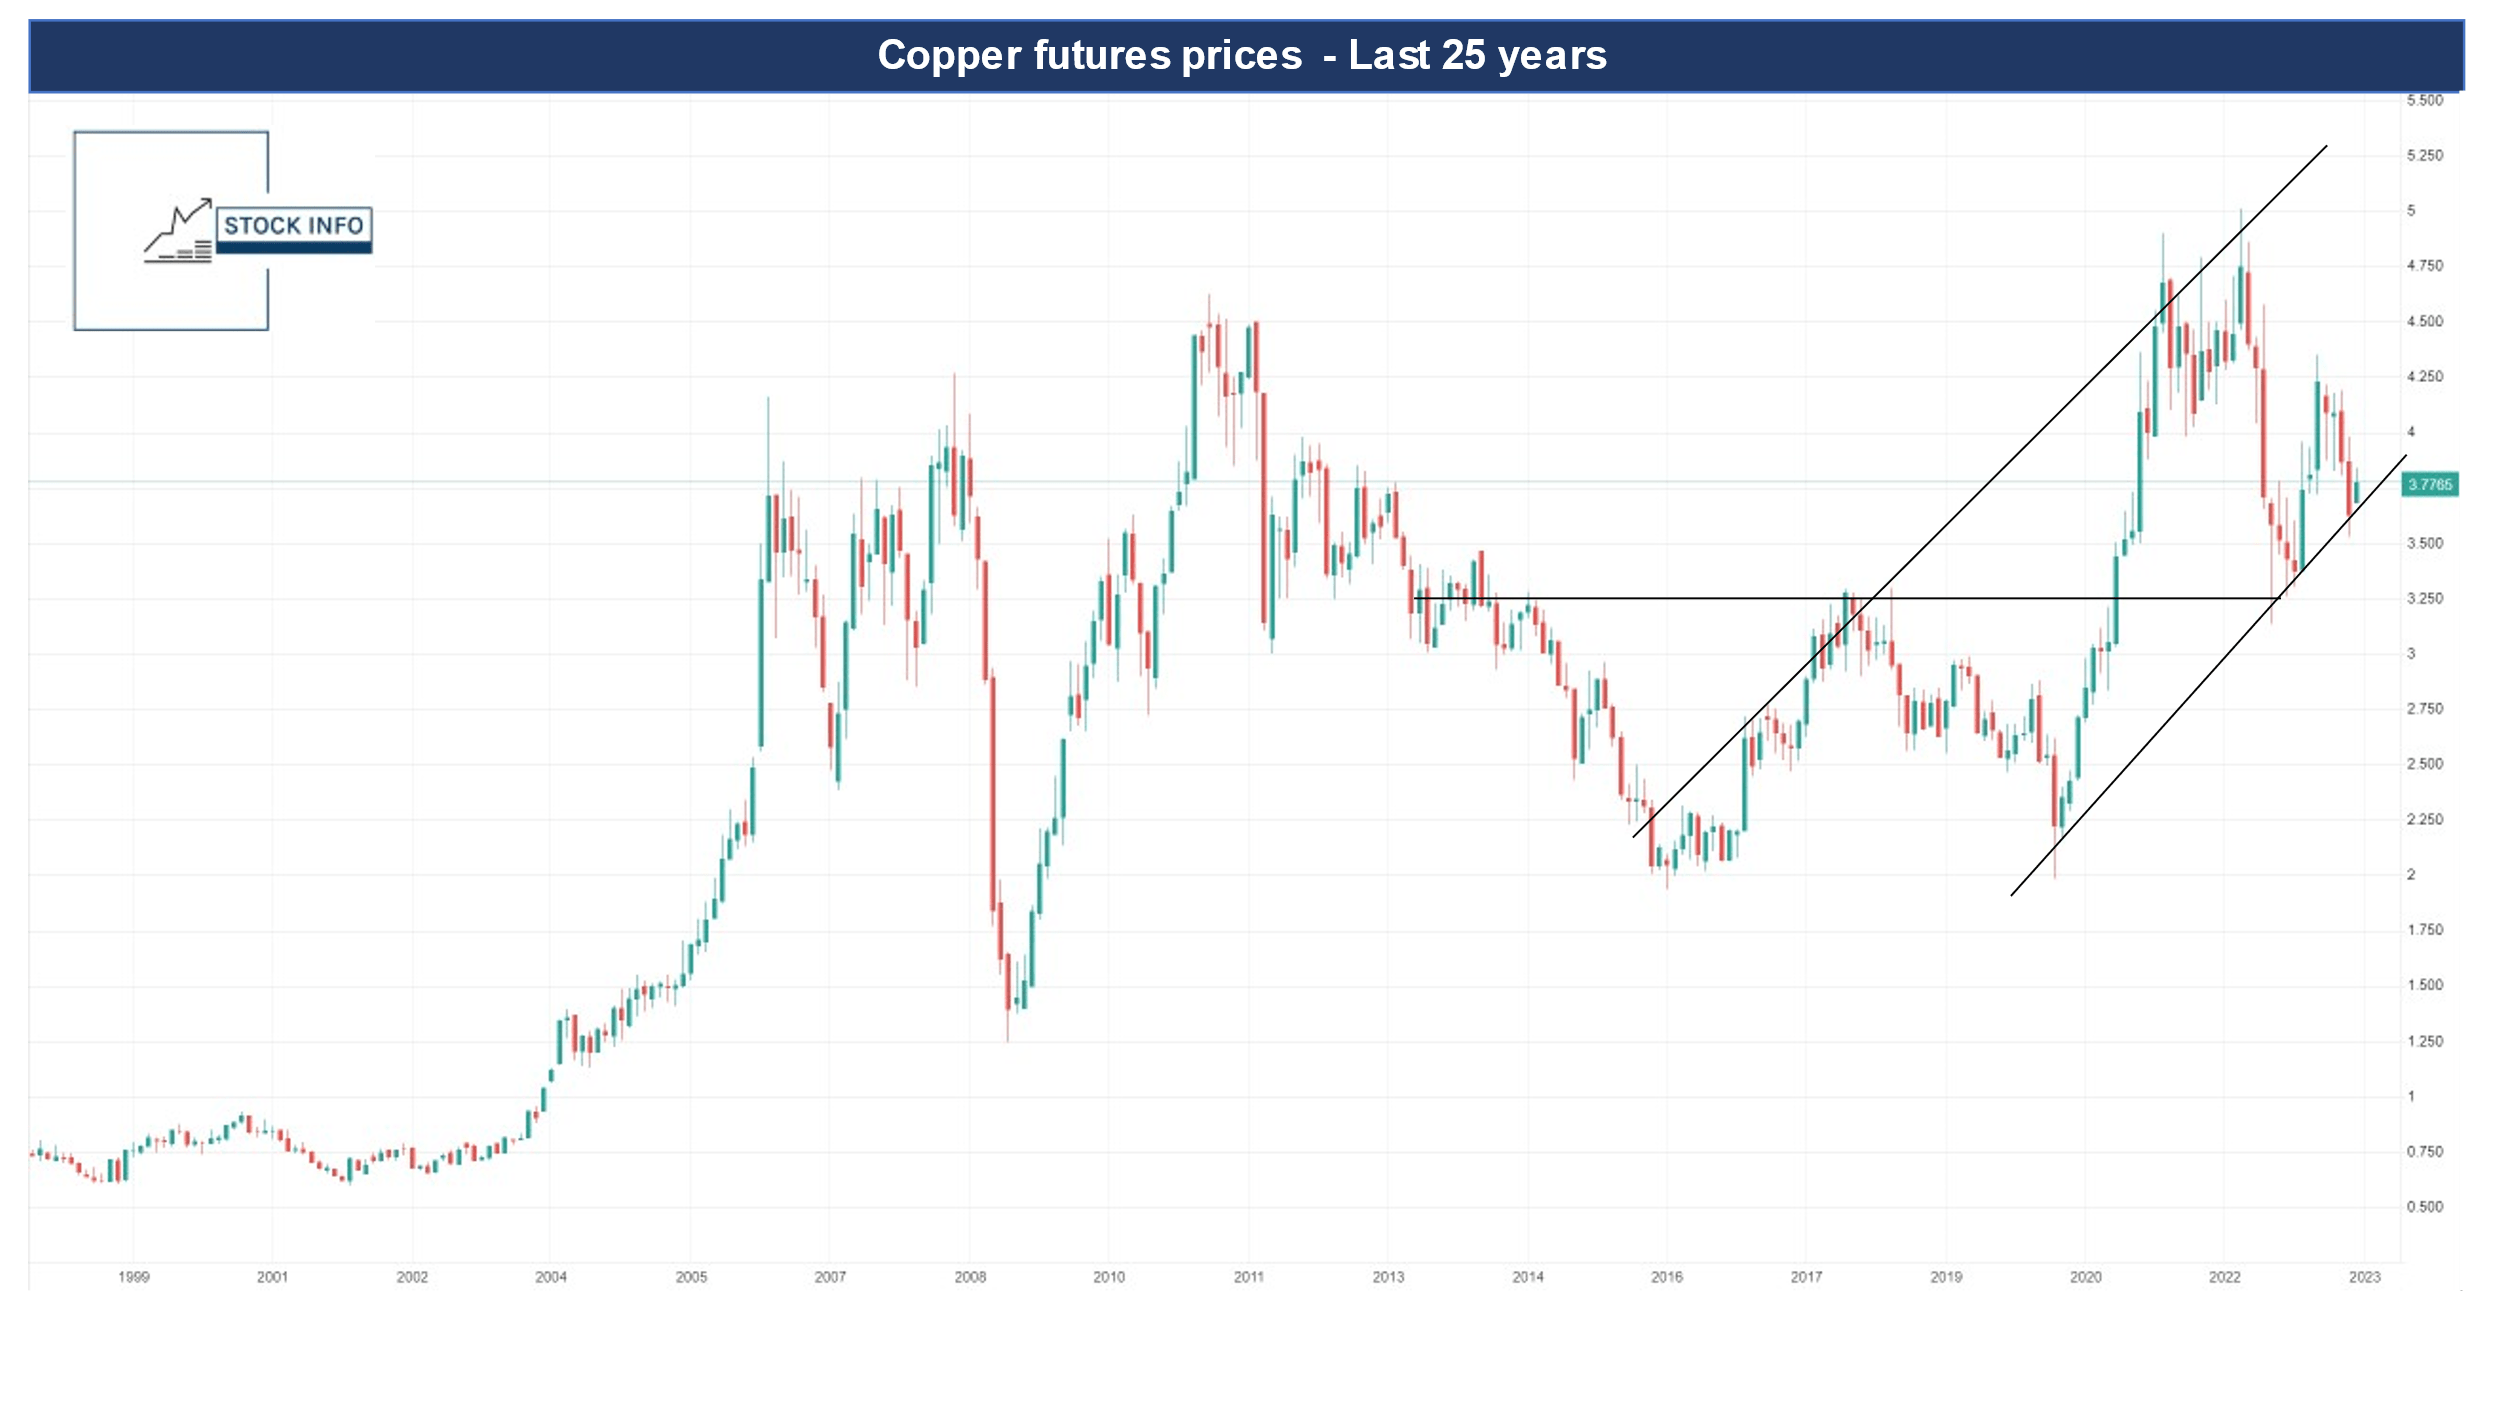
Next, if we look at how the price of copper futures has moved in the 25 years, it is evident that we are currently in a relatively elevated price regime, historically speaking.
In addition, prices have established some level of support and a minor uptrend after the recent price fall in June of last year. As we see it, copper currently trades in a channel that can be drawn back to 2016, and the most recent price drop bounced off the support level of this channel.
For this reason, and the ones mentioned above, we see an attractive upside to copper. Furthermore, China’s economy has yet to recover after their strict lockdowns in 2022 fully and is yet another catalyst that could see copper futures rise significantly in price.
Although the prices will stay within this channel, investors should carefully watch for a potential break out of the channel to the downside, which could further drop copper prices to the $3.25 per pound level. Once again, we highly recommend you read our article about our long-term look at copper, which provides much more detail than outlined here.
China Is Still A Slumbering Dragon
As of 2021, China was the biggest consumer of refined copper , accounting for 52% of the global copper volume. Economic conditions in China are vital for how the price of copper moves.
Lately, however, China's economic recovery has shown signs of weakening in May this year, causing concerns about future growth prospects and calls for central bank intervention.
Official data revealed a contraction in manufacturing activity for May, worse than in April, while the expansion of the services sector slowed down slightly. This indicates a loss of momentum in the post-Covid rebound . Investors responded by selling Chinese shares, the yuan, copper, and iron ore.
The recovery in China has been driven by consumer spending on services , while the manufacturing sector has lagged. These latest figures highlight the uneven nature of the recovery and raise questions about the strength of consumption in the economy.
Economists have noted the risk of a downward spiral , particularly in the manufacturing sector, and have also suggested that the central bank take action in the form of interest rate cuts and reductions in the reserve requirement ratio for banks. A turnaround in the property market, which constitutes a significant portion of the Chinese economy, is crucial for a more robust recovery, but it is currently showing warning signs . In addition, home sales have slowed, and real estate developers face financial challenges.
The faltering recovery in China has also significantly impacted financial markets. Chinese equities listed in Hong Kong experienced a decline, the offshore yuan weakened against the dollar , and copper futures in London slid, as seen in our graph above. The contraction in China's steel PMI and the drop in iron ore prices further reflect the economic challenges.
The situation has raised concerns among investors and prompted calls for decisive policy actions to restore confidence in the Chinese economy. Recently the Chinese state banks have cut the interest rate and reduced the reserve requirement ratio for banks to help incentivize economic activity, which economists had called for.
China's government has set a conservative growth target of around 5% for the year, indicating limited scope for significant stimulus. Sluggish domestic demand could hinder China's sustainable growth without efficient and effective policy moves to drive a broad-based recovery.
Chinese exports faced a downturn in May, marking the first decline in three months and raising concerns about the country's economy amidst weakening global demand. Official data revealed a 7.5% drop in overseas shipments to $284 billion , surpassing the expected 1.8% decline. Major destinations, including the US, Japan, Southeast Asia, France, and Italy, experienced double-digit decreases in imports from China.
Imports also contracted by 4.5% to $218 billion , performing better than the anticipated 8% decline. However, imports from various regions, notably Taiwan and South Korea, recorded a significant drop of over 20%, signaling a slump in global electronics demand. A positive aspect for Chinese exporters has been the continued robust demand for Chinese cars worldwide, as total vehicle shipments reached a record-breaking $9 billion in a single month. The popularity of Chinese electric vehicles overseas has been a significant driving force, although shipments of other vehicle types have also increased.
To summarize, China’s economy has not experienced the recovery expected after its reopening, and copper futures took a slide. However, this also leaves a great deal of potential upside for prices to rise, as a possible new stimulus package could help revitalize economic growth in China, providing a potential catalyst for copper futures, which will benefit companies like FCX.
Freeport-McMoRan: The copper juggernaut
FCX released its Q1 2023 earnings on April 21st and revealed exciting information about its operations, which we will look at here.
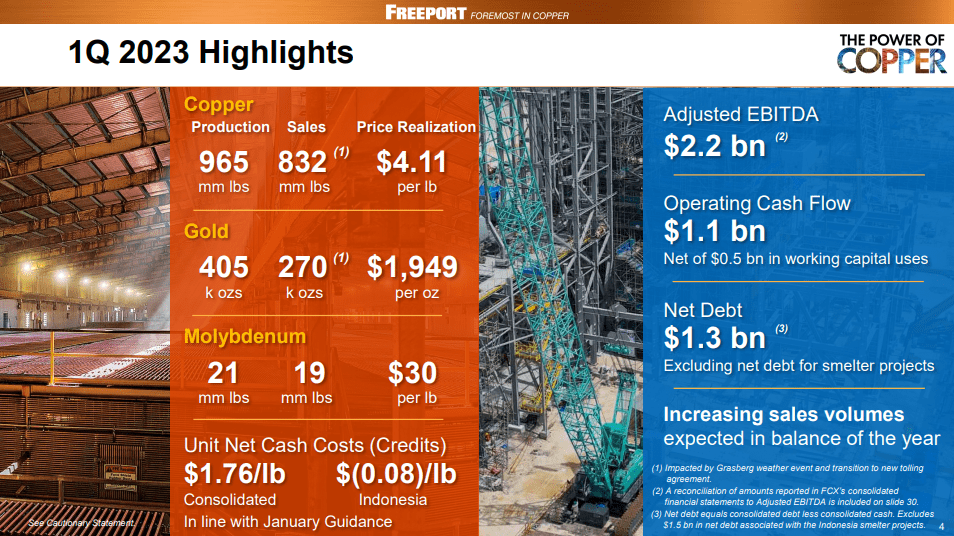
To begin with, the Q1 highlights show substantial profits primarily supported by the elevated copper prices we discussed previously. The company was able to sell 832 million pounds of copper at a realized price of $4.11/pound, which led to $2.2B in EBITDA and $1.1B in operating cash flow. Their net cash costs per pound were also relatively low consolidated and even negative in their Indonesian division. Furthermore, FCX has navigated the previously highlighted obstacles well enough to see their copper production increase, as highlighted in the slide below.
In their presentation, which can be found here , FCX also highlights how they have overcome some of the challenges outlined in our article on the future of copper demand. If you wish to delve deeper into their earnings presentation, we highly suggest you do. The main point here is that price realization on copper is a crucial parameter for their earnings, and with the potential for prices close to the $4.0 mark and even higher in the future, we believe FCX’s profits could grow even more.
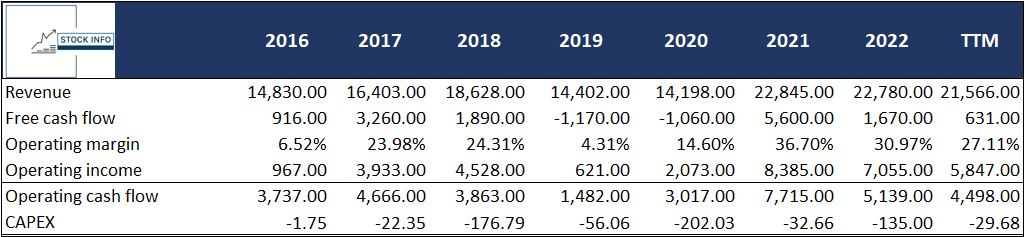
If we look at FCX’s financial history, we see a business with a solid foundation that has grown its margins in recent years.
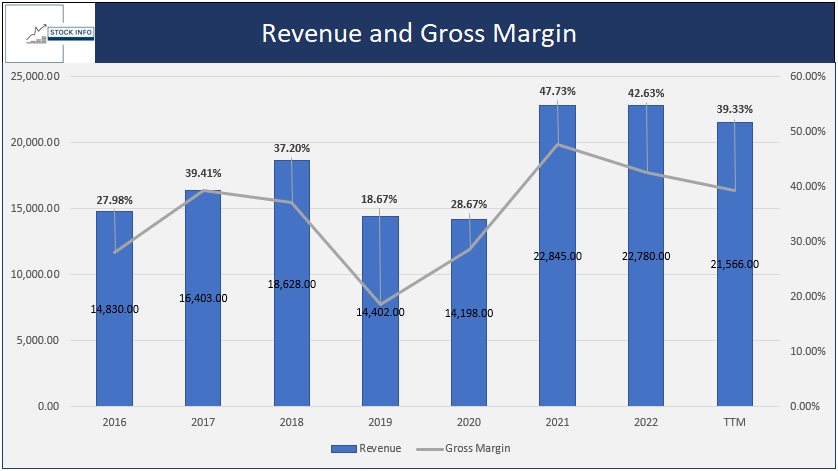
Their revenues have shown a fluctuating yet upwards trend over the years, starting at $14,830 million in 2016 and reaching its peak at $22,845 million in 2021.
However, in TTM, it slightly declined to $22,780 million, but very stable. The gross margin varied from 27.98% in 2016 to a high of 47.73% in 2021, which is a very satisfying margin for a business in this industry, although it declined to 39.33% in TTM.
If we compare FCX to its peers to gauge its attractiveness, FCX may be the cheaper option among copper-producing companies but not necessarily the most profitable.
We have provided tables containing various metrics for FCX, SCCO , FQVLF , and LUNMF. However, we will mainly focus on comparing FCX to SCCO, as they are the most similar in size and operations.
Prepared by Stock Info with data from Seeking Alpha
When comparing FCX and SCCO, the measures in the table above provide insights into the relative valuations between the two companies and FQVLF and LUNMF.
Regarding P/E ratios, both non-GAAP and GAAP, FCX generally exhibit lower ratios than SCCO, suggesting potentially more attractive FCX valuations than SCCO. Specifically, FCX shows lower non-GAAP P/E ratios across various timeframes, indicating potentially more optimistic earnings expectations than SCCO.
Turning to price/sales ((TTM)), FCX has a significantly lower ratio of 2.36 compared to SCCO's higher ratio of 5.27, indicating a more favorable pricing based on revenue for FCX.
Similarly, regarding price to book ((TTM)), FCX has a lower ratio than SCCO, suggesting more attractive valuations based on their book values.
FQVLF and LUNMF generally have more attractive P/E ratios as well as price-to-book, and price-to-cash flow. However, they become somewhat unattractive compared to FCX and SCCO when diving a bit deeper, which we will do below.
Prepared by Stock Info with data from Seeking Alpha
Looking at the table, SCCO exhibits a higher gross profit margin at 53.66% compared to FCX's margin of 39.33%, indicating more robust profitability in generating revenue after accounting for the cost of goods sold.
Similarly, SCCO outperforms FCX regarding EBIT margin, net income margin, and RoE, indicating that SCCO generates profit and utilizes shareholders’ equity more efficiently than FCX.
However, FCX performs better RoA with a margin of 7.54% compared to SCCO's margin of 16.21%, suggesting that FCX generates better returns from its total investments.
It is worth noting that FCX exhibits a higher cash flow from operations of $4.50 billion compared to SCCO's $3.17 billion, showing that their cash generation from core business activities is superior.
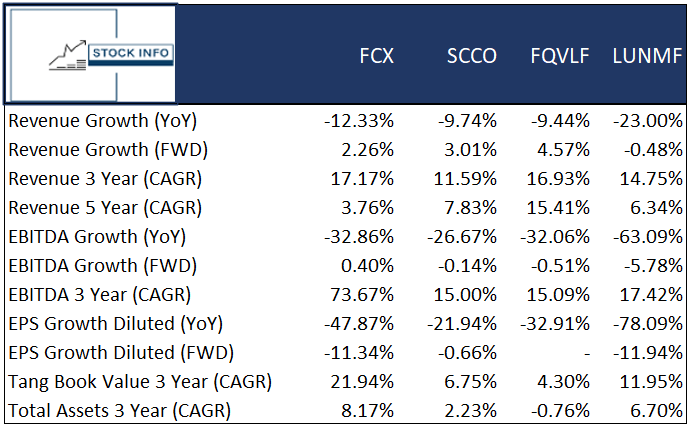
Valuable insights emerge when comparing the FCX and SCCO tickers based on revenue growth and other key financial measures. The higher 3-year revenue growth and the almost 74% EBITDA 3-year CAGR is where FCX becomes more attractive than SCCO.
In addition, FCX also has a nearly 22% 3-year CAGR in tangible book value, showing a bolstering of their balance sheet in the last three years. FCX’s YoY growths are disappointing compared to SCCO. However, as their historical growth suggests, they are better equipped to generate more profit than SCCO in the long run.
Technical Analysis
As seen on the chart below, the company is currently in a downtrend from its high back at the beginning of April 2022 and trading in a downward channel. The current price of $37.88 is 27% off its high of $51.85. When we look at the potential short-term movement for the stock, there is a possibility for a move up to $40, which was a consolidation zone back in April of this year. There is another resistance level at the 0.5 Fibonacci level; however, given that the stock is above the 20, 50, and 200 EMA, we see significant potential for the stock to break through this fib-level.
Prepared by Stock Info with data from Tradingview
The $40 level will likely be a rigid wall to break through; however, if it manages, we could see the price reach the mid-$40 level.
The RSI is currently hovering around 50, while the MACD has upwards momentum. Therefore, short-term investors can buy into the stock for smaller, short-term profits. On the other hand, there is also a sizable downside risk, as FCX is relatively sensitive to the price of copper. Given an adverse economic event, this stock can reach the low $30-handle, which is the bottom of the channel it is currently in.
The picture is very much the same in the long-term chart below. However, on the weekly chart, the stock is nearing the 20 EMA, which could be a point of rejection, especially as the MACD has yet to confirm upward momentum in this time frame. In addition, the RSI is at 50, demonstrating a relatively fair current price for the stock. Investors should therefore be wary of starting a position at these current levels.
Prepared by Stock Info with data from Tradingview
Conclusion
To conclude, despite the fluctuating trends in copper prices, FCX has shown resilience and profitability, benefiting from the elevated copper prices in recent years.
The company's Q1 2023 earnings highlighted substantial profits supported by the high copper prices, increased copper production, and low net cash costs.
Although some metrics have fluctuated, FCX's financial history demonstrates a solid foundation and growth in margins. Compared to its peers, FCX appears to have attractive valuations and a competitive position, particularly in revenue growth and EBITDA 3-year CAGR.
While short-term price movements and copper price sensitivity pose risks, FCX's long-term growth potential remains promising, especially if the initiatives in China pay off and their economy shows signs of growing.
Investors should consider the company's strong performance, future outlook, and industry position when evaluating FCX as an investment option. We rate this stock a buy for the long term.
For further details see:
Freeport-McMoRan: Copper Giant With Potential For The Energy Transition