AMZN - FTHI: Behind JEPI In Total Return Ahead Of It In Growth
2023-10-03 16:08:34 ET
Summary
- First Trust BuyWrite Income ETF is an actively managed exchange-traded fund that aims to provide current income and capital appreciation.
- The FTHI ETF holds 200+ stocks and sells call options on the S&P 500 index, for a 12-month distribution rate of 8.38% and a total expense ratio of 0.85%.
- FTHI has underperformed its main competitor JPMorgan Equity Premium Income ETF in total return and yield, but it beats it in capital and dividend growth.
This article series aims at evaluating ETFs (exchange-traded funds) regarding the relative past performance of their strategies and metrics of their current portfolios. Reviews with updated data are posted when necessary.
FTHI strategy and portfolio
First Trust BuyWrite Income ETF ( FTHI ) is an actively managed fund launched on 1/6/2014. It holds 216 stocks and shorts 5 call options on the S&P 500 Index (SP500). The 12-month distribution rate is 8.38% and the total expense ratio is 0.85%. Distributions are paid monthly.
As described by First Trust , " The Fund's primary investment objective is to provide current income. The Fund's secondary investment objective is to provide capital appreciation. " The fund invests in stocks listed on U.S. exchanges and sells call options on the S&P 500 Index to collect premiums that may be distributed to shareholders. The market value of the option strategy may be up to 20% of the Fund's overall net asset value. As of writing, held options expire in October and November with strike prices between SPX 4350 and 4525.
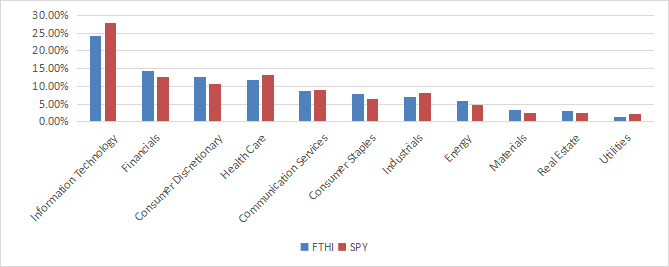
FTHI invests mostly in U.S.-based companies (93% of asset value). The sector breakdown is close to the S&P 500, but not identical. As plotted on the next chart, the fund slightly overweights financials, consumer discretionary, consumer staples, energy, materials and real estate. It underweights technology, healthcare, industrials and utilities.
Sector breakdown (Chart: author; data: First Trust, SSGA)
FTHI is cheaper than SPY regarding the usual valuation ratios, as reported in the next table. This difference is mostly due to a few percent less in technology and a few percent more in financials and energy, where these ratios are much lower.
| FTHI |
| SPY |
| Price/earnings TTM |
| 17.6 |
| 22.4 |
| Price/book |
| 3.43 |
| 3.99 |
| Price/sales |
| 2.31 |
| 2.55 |
| Price/cash flow |
| 11.97 |
| 15.81 |
Data: Fidelity.
The top 10 companies, listed below with fundamental metrics, represent 31.5% of asset value. For convenience, the two stock series of Alphabet are grouped in the same line of the table. The top two names, Apple and Microsoft, weigh about 13% together. Risks related to other individual companies are low to moderate.
| Ticker |
| Name |
| Weight |
| EPS growth %TTM |
| P/E TTM |
| P/E fwd |
| Yield% |
| Apple, Inc. |
| 6.74% |
| -1.68 |
| 29.20 |
| 28.68 |
| 0.55 |
| Microsoft Corp. |
| 6.43% |
| 0.42 |
| 33.23 |
| 29.28 |
| 0.93 |
| Alphabet, Inc. |
| 4.03% |
| -12.04 |
| 28.38 |
| 23.64 |
| 0 |
| Amazon.com, Inc. |
| 3.36% |
| 12.55 |
| 102.94 |
| 58.56 |
| 0 |
| NVIDIA Corp. |
| 2.92% |
| 35.76 |
| 108.18 |
| 42.10 |
| 0.04 |
| Berkshire Hathaway, Inc. |
| 1.85% |
| 694.81 |
| 8.74 |
| 21.00 |
| 0 |
| Meta Platforms, Inc. |
| 1.80% |
| -28.97 |
| 35.77 |
| 22.72 |
| 0 |
| Tesla, Inc. |
| 1.69% |
| 27.36 |
| 71.38 |
| 76.19 |
| 0 |
| Exxon Mobil Corp. |
| 1.36% |
| 36.57 |
| 9.25 |
| 12.36 |
| 3.15 |
| Eli Lilly & Co. |
| 1.35% |
| 13.03 |
| 75.95 |
| 55.25 |
| 0.84 |
Historical performance
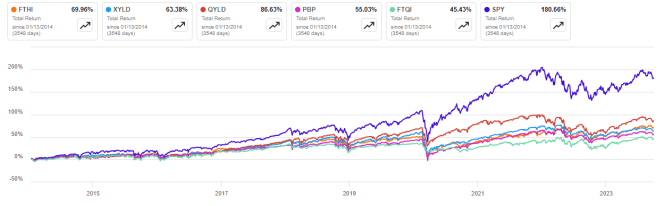
The next chart plots total returns since inception of FTHI, the S&P 500 index ( SPY ) and four other ETFs implementing buy-write strategies (buying stocks and selling call options):
- Global X S&P 500 Covered Call ETF ( XYLD ),
- Global X NASDAQ 100 Covered Call ETF ( QYLD ),
- Invesco S&P 500 BuyWrite ETF ( PBP ),
- First Trust Nasdaq BuyWrite Income ETF (FTQI).
FTHI is the best performer among S&P 500-based buy-write ETFs, but it is behind the S&P 500 index and the Nasdaq-100 (NDX) based QYLD.
FTHI vs competitors and SPY since 2014 (Seeking Alpha)
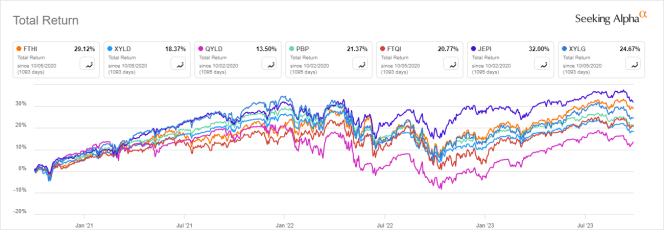
The next chart plots a shorter period of 3 years and adds two recent funds:
JEPI is ahead of FTHI, but the difference in annualized return is just under 1%.
FTHI vs competitors, last 3 years (Seeking Alpha)
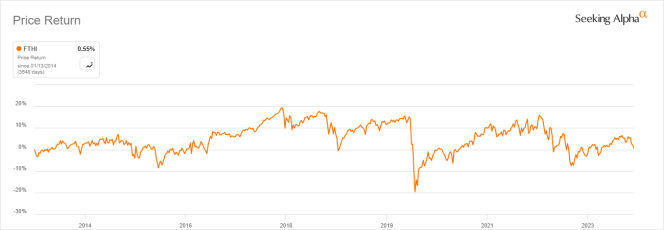
The chart below plots FTHI share price since inception: it is close to breakeven (+0.55%). At the same time, the cumulative inflation has been about 31% (based on CPI), meaning a significant loss in real value for shareholders.
FTHI price history (Seeking Alpha)
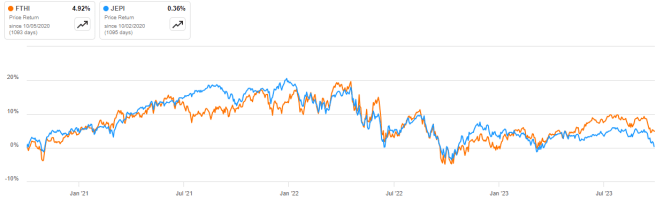
In the last 3 years, FTHI has beaten JEPI in capital growth, by a short margin (next chart). JEPI has outperformed in total return thanks to a higher distribution rate.
FTHI vs. JEPI, 3-year price return (Seeking Alpha)
FTHI distributions may vary depending on market conditions. It seems the management tries to keep them as constant as possible: they have been stable at about $0.08 per month between 2015 and 2021. Then, they jumped to an average of $0.15 in 2022, and they have been at $0.157 for 3 months. The annual dividend growth rate from 2021 to 2022 is 83%, whereas it is about 53% for JEPI. Based on historical data, the current yield looks like an outlier, and the future will tell how long it will be sustained, for FTHI and JEPI as well.
FTHI distribution history (Seeking Alpha)
Takeaway
First Trust BuyWrite Income ETF has a portfolio of 200+ stocks and generates income by selling call options on the S&P 500 index. Valuation is a bit better than for the large-cap benchmark, mostly due to a slightly modified sector breakdown.
FTHI has performed well among other buy-write ETFs existing since 2013, but it has lagged the S&P 500 by far. In the last 3 years, it is behind JEPI in total return and yield, but it looks better in price return and dividend growth. The fund has fulfilled its primary objective of providing income. As for the secondary objective of capital appreciation, the price is close to its value at inception and was unable to keep pace with inflation.
For further details see:
FTHI: Behind JEPI In Total Return, Ahead Of It In Growth