FTXN - FTXN: Oil & Gas ETF Based On Nasdaq's 'Smart Index'
Summary
- FTXN is an ETF based on a Nasdaq Oil & Gas Index.
- The Index construction is highly mechanical.
- There is over $1 billion invested in the ETF.
- The value of the ETF is highly dependent on oil prices.
- Future oil prices are being influenced by OPEC production cuts and Fed interest rate increases; I conclude oil prices will decline.
The First Trust Nasdaq Oil & Gas ETF ( FTXN ), the “Fund,” seeks investment results that correspond generally to the price and yield (before the Fund's fees and expenses) of an index called the Nasdaq US Smart Oil & Gas Index ( NQSSOG ), the "Index.” The methodology of the Index is discussed below.
Nasdaq
The following highlights of Nasdaq Index Methodology is available on this website :
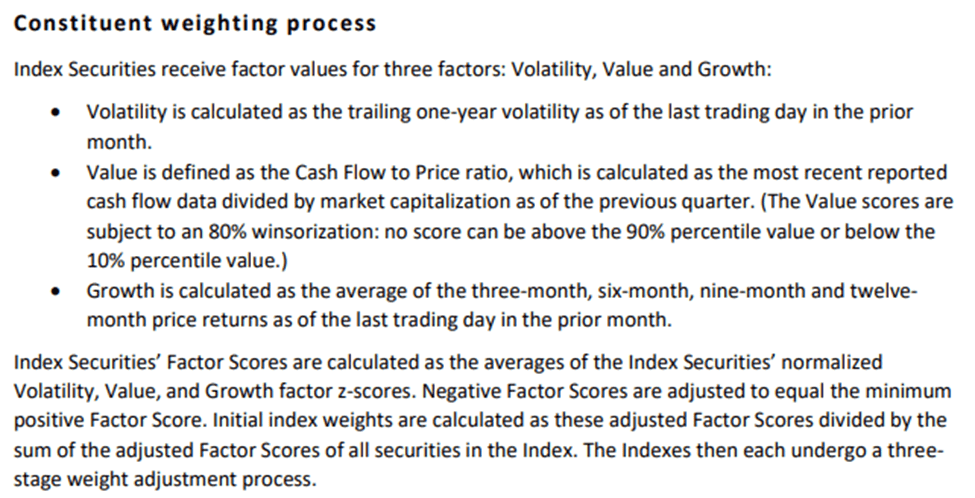
The Nasdaq US Smart Oil & Gas Index ( NQSSOG ) is designed to provide exposure to US companies within the Oil & Gas sector. The universe is screened by a series of three factors (Volatility, Value, and Growth). Securities are then selected and a modified factor weighted methodology is applied. The Index began on July 8, 2016 at a base value of 1000.00.”
Security Eligibility Criteria
Nasdaq
Index Calendar
End of February: Reconstitution schedule.
Early March: Index Reconstitutions announced.
March: Reconstitution schedule.
First trading day after the third Friday in March: Index Reconstitutions are effective.
December, March, June, and September Quarters: Index rebalances use value factor data.
February, May, August and November Months-End: Volatility and growth factor data.
Early March, June, September and December: Index Rebalance changes are announced.
The trading day following the third Friday in March, June, September and December: Index Rebalance changes become effective.
Constituent Selection Process
The top 50 securities are selected for the Oil & Gas ((NQSSOG)) indexes.
Constituent Weighting Scheme
The Index is a modified factor-weighted index.
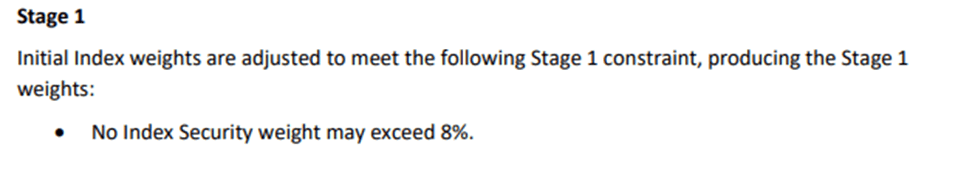
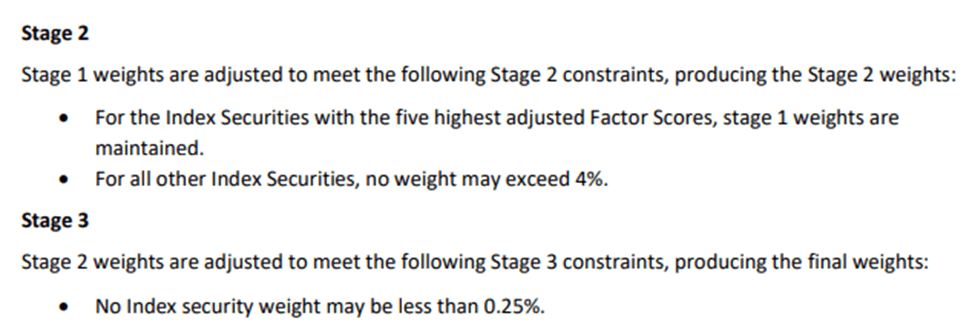
Constituent Weighting Process
Nasdaq
Nasdaq
Nasdaq
Nasdaq covers other details on its website, such as Index Maintenance, Additional Information, and Governance.
Holdings
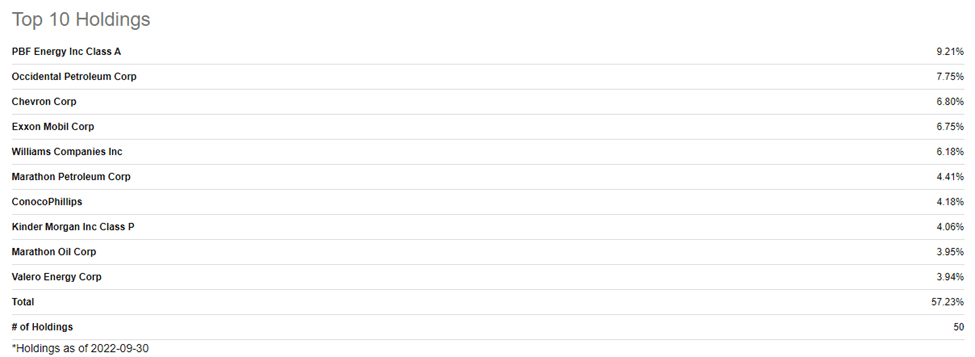
The top-ten current holdings as of end-September are as follows:
Seeking Alpha
Expenses and AUM
First Trust charges an expense ratio of 0.60%. The Assets Under Management (“AUM”) are about $1.03 billion.
Seeking Alpha
Seeking Alpha rates the expense ratio as a “D+” in its ETF Grades.
Seeking Alpha
Performance
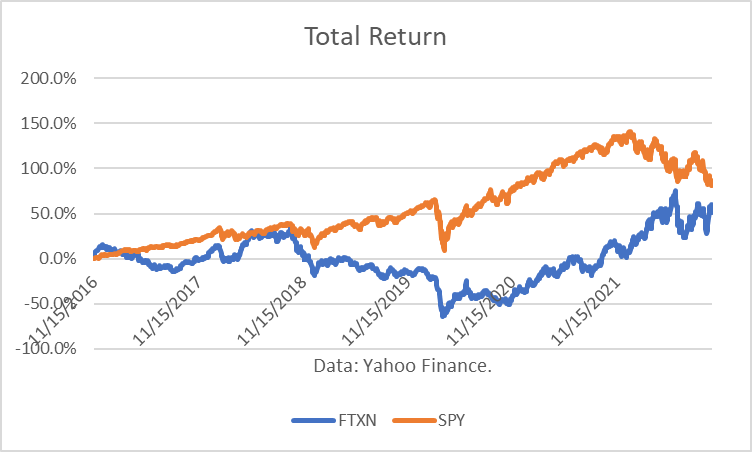
The first active trading day of the Fund was November 16, 2016. Since inception, FTXN has returned 52.6%. That compared unfavorably to a return of 82.2% for SPY.
Yahoo Finance data
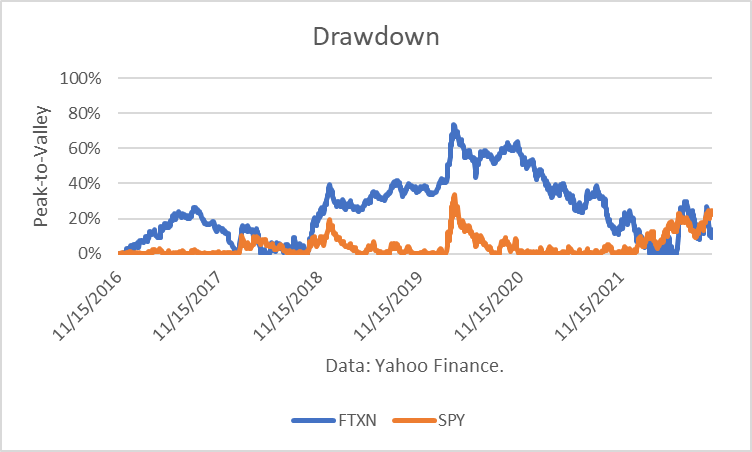
The Maximum Drawdown (“MD”) for FTXN was 73%. Over the same period, the MD for SPY was 34%. I consider the MD to be the key risk measurement because it shows how much an investor could have lost holding the investment over the long-term. It also represents how large the hurdle would have been to recovery of losses.
Yahoo Finance data
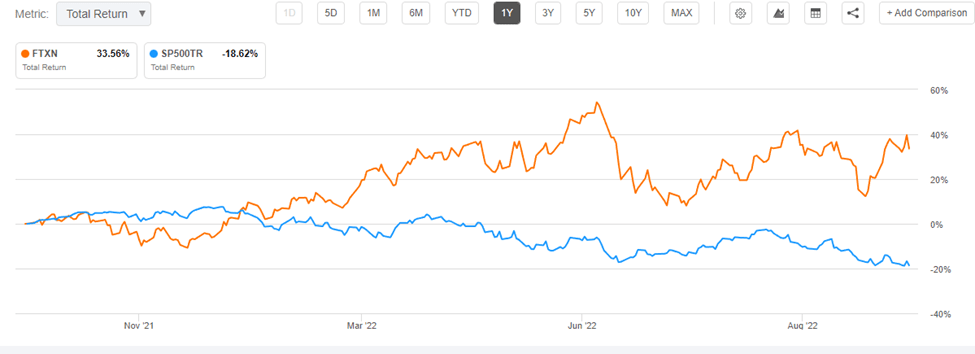
However, over the past year, FTXN had a total return of 33.56%. That compares favorably to the loss of 18.62% in the SP500TR.
Seeking Alpha
Market Outlook
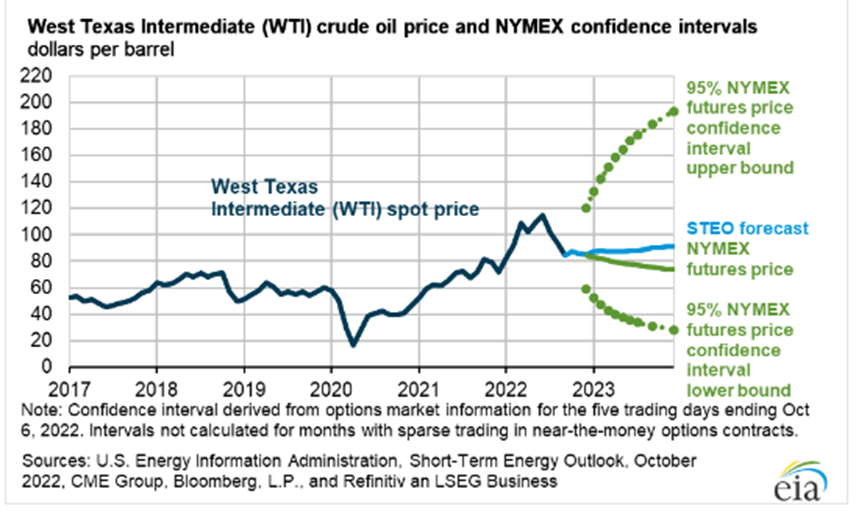
The oil and gas sector has been subject to high volatility in 2022. Russia’s invasion of Ukraine led to high levels of uncertainty about world supplies due, in part, to the reaction of NATO members to limit Russian oil imports and to Russia’s own targeting of cuts in exports and trade.
Crude oil prices spiked following the invasion in February but peaked in June. The range of possible future oil prices is large, but NYMEX futures prices imply oil prices will decline.
EIA
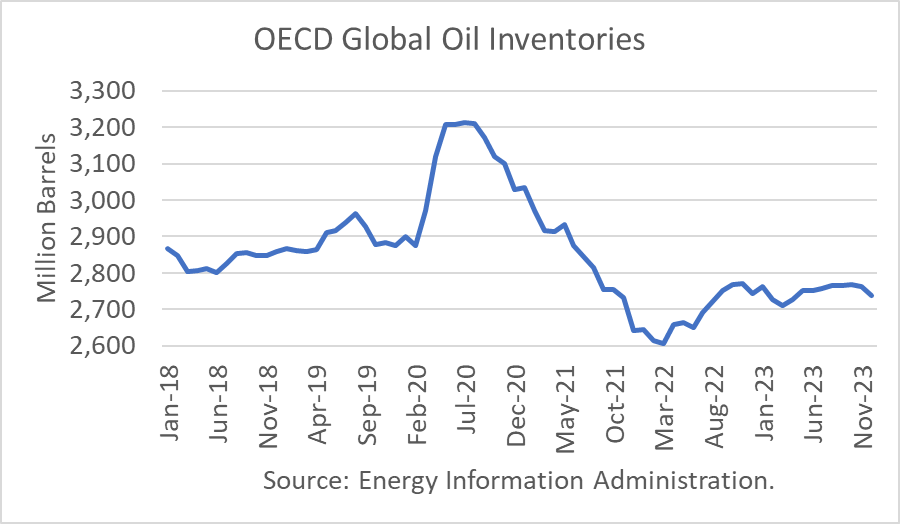
The release of Strategic Petroleum Reserves (“SPRs”) in the U.S. and among members of the International Energy Agency (“IEA”) enabled global OECD commercial oil inventories to begin to recover from their lows in March.
EIA
High inflation in the U.S. and abroad has led central banks, including the U.S. Federal Reserve, to ratchet-up interest rates. But those actions have raised the risks of economic recession, which would further soften oil consumption.
“The Federal Reserve is seen delivering another large interest-rate hike in three weeks' time and ultimately lifting rates to 4.75%-5% by early next year, if not further, after a government report showed inflation remained stubbornly hot last month,” Reuters reported .
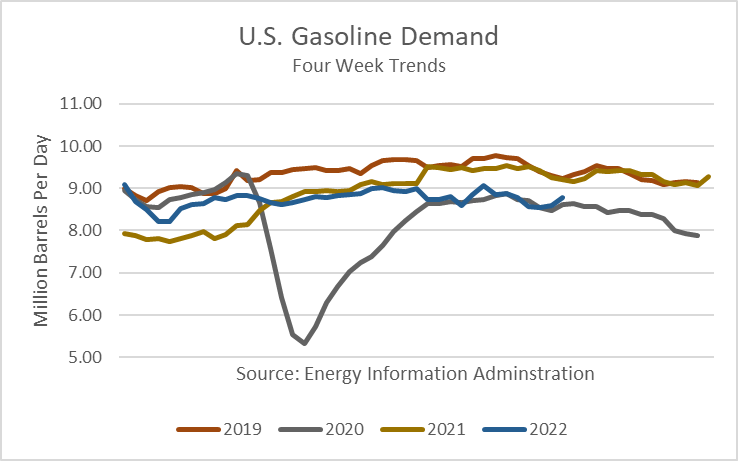
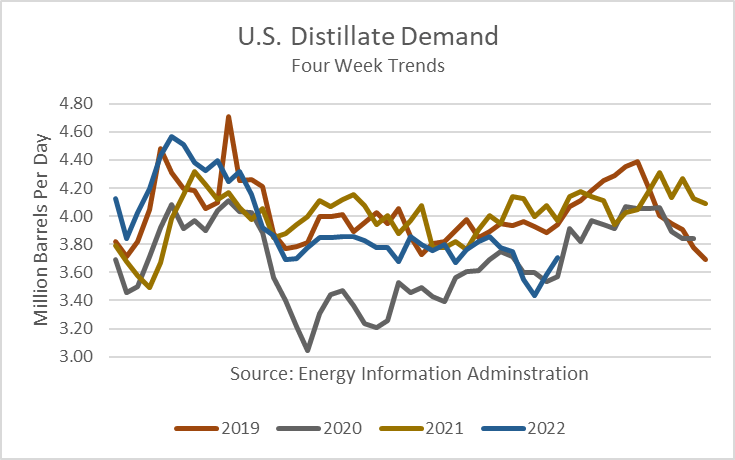
U.S. demand for the two main petroleum products, gasoline and distillate fuels, has dropped to near-pandemic levels for this time of year.
EIA
EIA
OPEC+ announced at their meeting on October 5 th a cut of 2 million barrels per day in their production quotas . But that does not translate into an actual reduction of that amount because numerous countries have not been meeting their quotas in the first place. The net effect of the new quotas would be a reduction of about one million barrels per day if three key producers—Saudi Arabia, the United Arab Emirates and Kuwait—actually reduce their production to quota and there are no increases in production among other producers.
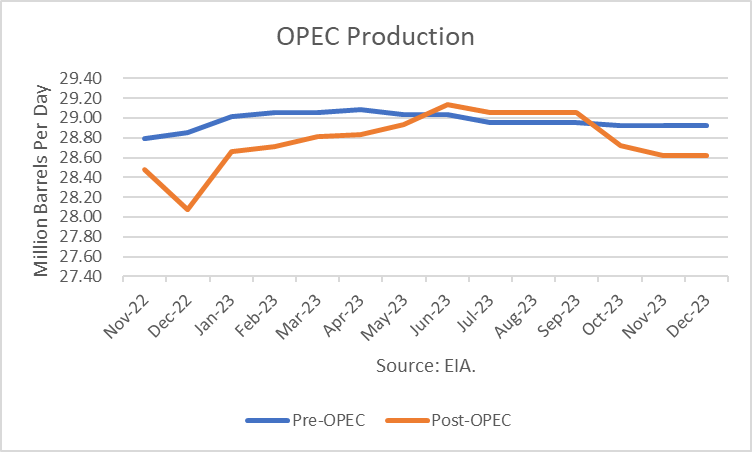
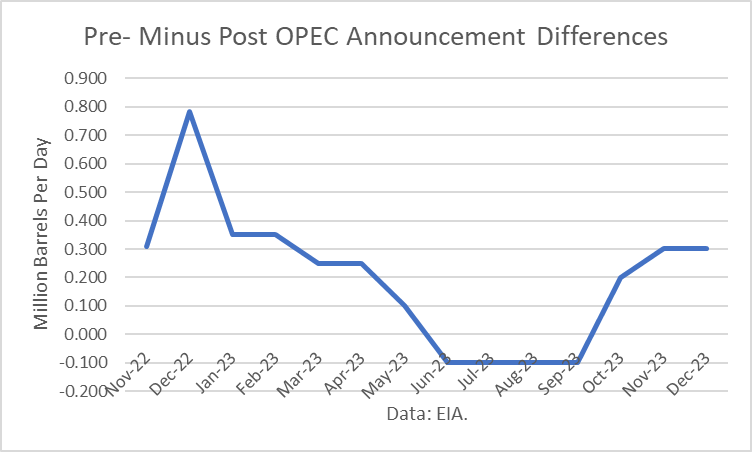
The EIA published its October Short-Term Oil Outlook (“STEO”) a week after the OPDEC+ announcement and made a less dramatic change in its projections of OPEC output (see graph below for pre- and post-OPEC announcement volumes).
EIA
On balance, the average reduction through December 2023 averages 200,000 barrels/day (see graph below for the pre- minus post-OPEC announced volumes).
EIA
IEA
The October 2022 IEA Oil Market Report stated :
Disruptive market forces are multiplying as the world struggles to navigate the worst global energy crisis in history. The OPEC+ bloc’s plan to sharply curtail oil supplies to the market has derailed the growth trajectory of oil supply through the remainder of this year and next, with the resulting higher price levels exacerbating market volatility and heightening energy security concerns. Benchmark crude oil prices spiked by around $14/bbl from a September low and Brent once again flirted with triple digits. With unrelenting inflationary pressures and interest rate hikes taking their toll, higher oil prices may prove the tipping point for a global economy already on the brink of recession.”
The U.S. Federal Open Market Committee (“FOMC”) is scheduled to meet November 1-2 and December 13=14 this year. As indicated above, additional interest rate increases are expected.
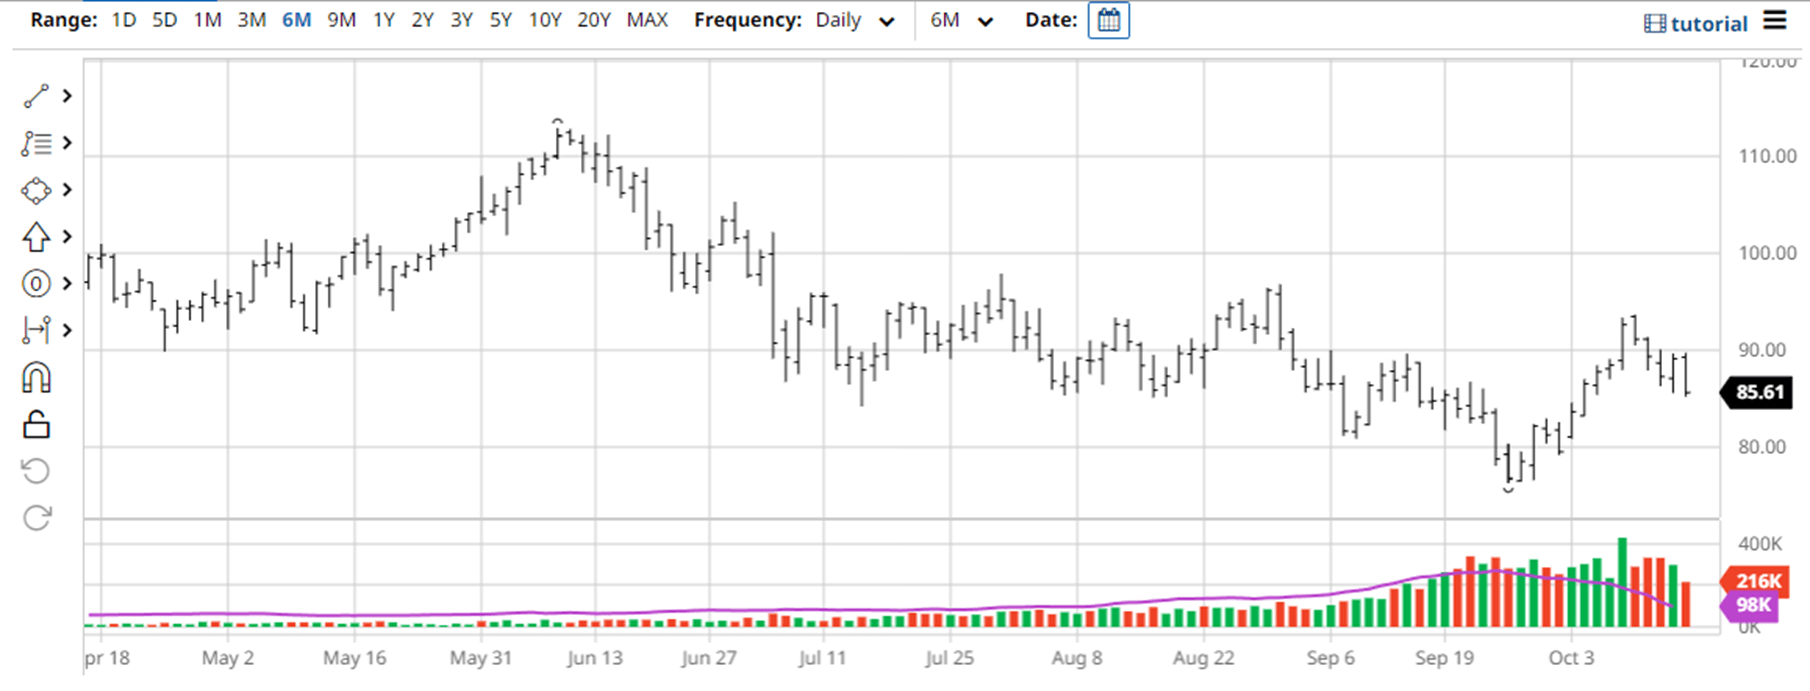
Following the run-up in prices before the October OPEC meeting and in its aftermath, the NYMEX November Crude Oil WTI contract has begun to ease due to recession fears in the U.S. “Barclays forecasts a eurozone recession in the fourth quarter that will persist until the second quarter of 2023, with a 1.7% contraction in real GDP,” Forbes reported .
Barchart
Barchart
“ JPMorgan Chase CEO Jamie Dimon on Monday warned that a ‘very, very serious’ mix of headwinds was likely to tip both the U.S. and global economy into recession by the middle of next year,” CNBC reported .
Conclusions
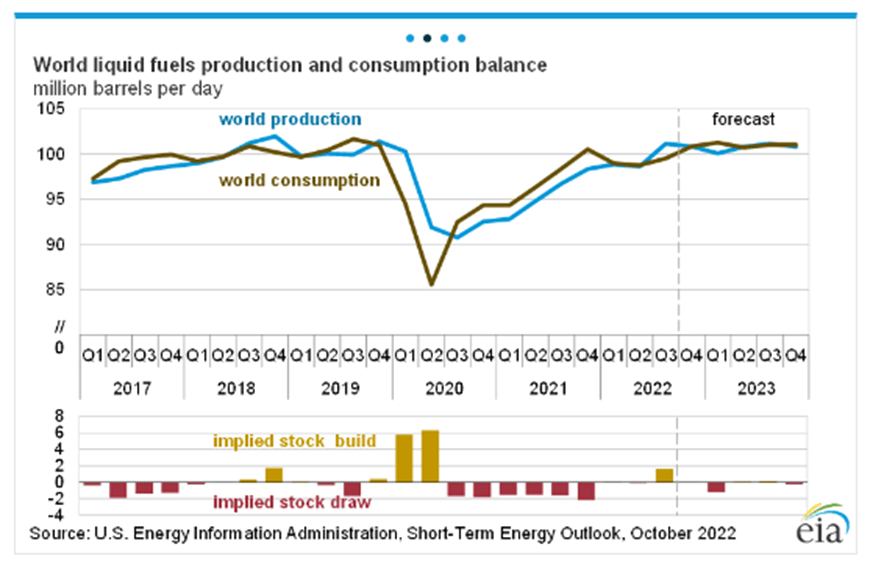
FTXN is an ETF linked to the fate of oil market prices because the oil equities in the underlying Nasdaq Index is heavily dependent on oil prices. There are two competing forces in the market right now: OPEC’s decision to reduce production and the inflation battle being waged by central banks by increasing interest rates. Together, they imply both lower production and consumption.
EIA
The balance of those factors determines inventory change, which directly impacts oil prices and price expectations. I believe the peak in oil prices is behind us, and so my outlook for oil prices in the months ahead is bearish. Therefore, I would not invest in FTXN, and FTXN has proven it’s a risky long-term asset, given the size of its Maximum Drawdown in the past.
For further details see:
FTXN: Oil & Gas ETF Based On Nasdaq's 'Smart Index'