META - FVAL: Smarter Than Most Value ETFs
2023-06-30 12:01:04 ET
Summary
- Fidelity® Value Factor ETF holds 126 stocks with value characteristics.
- FVAL has specific rules for the banking industry.
- As a result, financials are not overweight like in most value ETFs.
- It has outperformed a number of competitors since 2017 and in 2023.
This article series aims at evaluating exchange-traded funds (ETFs) regarding the relative past performance of their strategies and metrics of their current portfolios. As holdings change over time, updated reviews are posted from time to time.
FVAL strategy and portfolio
Fidelity® Value Factor ETF (FVAL) started investing operations on 09/12/2016 and tracks the Fidelity U.S. Value Factor Index. It has a portfolio of 126 stocks, an estimated distribution yield of 2.13%, a total expense ratio of 0.29% and a net asset value of $460.
According to Fidelity, the underlying index " is designed to reflect the performance of stocks of large and mid-capitalization U.S. companies that have attractive valuations. " It is based on a score combining four factors in equal weight:
- Free Cash Flow Yield
- EBITDA to Enterprise Value
- Tangible Book Value to Price
- Forward Estimated 12-month Earnings to Price.
For the banking industry, only the last two factors above are taken into account.
The turnover in the most recent fiscal year was quite high: 46% of average portfolio value. FVAL invests exclusively in U.S. companies and mostly in the large cap segment (72%). It is much cheaper than the S&P 500 index ( SPY ) regarding the usual valuation ratios, as reported in the next table.
| FVAL |
| SPY |
| Price / Earnings TTM |
| 13.44 |
| 21.5 |
| Price / Book |
| 2.36 |
| 3.75 |
| Price / Sales |
| 1.29 |
| 2.39 |
| Price / Cash Flow |
| 9.15 |
| 15.14 |
Source: Fidelity.
The top 10 holdings represent 34.5% of the portfolio value. The next table lists their weights and valuation ratios. Each of the top two names is over 7% (Apple and Microsoft). Exposure to risks related to other individual companies is moderate.
| Ticker |
| Name |
| Weight (%) |
| P/E TTM |
| P/E fwd |
| P/Sales TTM |
| P/Book |
| P/Net Free Cash Flow |
| Yield% |
| Apple, Inc. |
| 7.92 |
| 32.21 |
| 31.63 |
| 7.80 |
| 48.34 |
| 36.39 |
| 0.80 |
| Microsoft Corp. |
| 7.45 |
| 36.32 |
| 34.83 |
| 12.05 |
| 12.85 |
| 65.76 |
| 2.01 |
| Alphabet, Inc. |
| 4.09 |
| 26.48 |
| 22.05 |
| 5.40 |
| 5.85 |
| 24.67 |
| 0 |
| Amazon.com, Inc. |
| 3.44 |
| 310.21 |
| 80.06 |
| 2.52 |
| 8.56 |
| N/A |
| 0 |
| Meta Platforms, Inc. |
| 2.11 |
| 34.92 |
| 23.66 |
| 6.23 |
| 5.86 |
| 41.61 |
| 0 |
| Berkshire Hathaway, Inc. |
| 2.06 |
| 97.13 |
| 21.80 |
| 2.32 |
| 1.46 |
| 32.00 |
| 0 |
| Broadcom Inc. |
| 1.97 |
| 27.26 |
| 20.53 |
| 10.51 |
| 16.74 |
| 37.88 |
| 12.28 |
| UnitedHealth Group, Inc. |
| 1.93 |
| 21.79 |
| 19.13 |
| 1.34 |
| 5.53 |
| 16.02 |
| 4.88 |
| Visa, Inc. |
| 1.75 |
| 31.91 |
| 27.25 |
| 15.83 |
| 13.37 |
| 33.38 |
| 1.16 |
| Johnson & Johnson |
| 1.73 |
| 34.32 |
| 15.40 |
| 4.44 |
| 6.03 |
| 97.84 |
| 3.98 |
Ratios: Portfolio123.
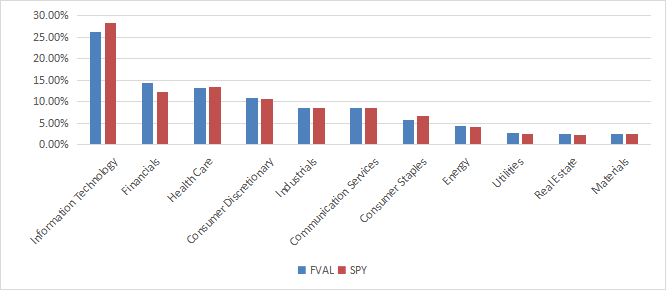
The sector breakdown is very close to the S&P 500 (SP500):
Since 10/1/2016, FVAL has underperformed the S&P 500 by about 11% in total return. The difference in annualized return is 84 bps, which is not very significant. A deeper maximum drawdown and higher volatility (measured as the standard deviation of monthly returns) point to a slightly higher risk.
| Total Return |
| Annual Return |
| Drawdown |
| Sharpe ratio |
| Volatility |
| FVAL |
| 117.31% |
| 12.21% |
| -37.26% |
| 0.62 |
| 18.04% |
| SPY |
| 128.48% |
| 13.05% |
| -33.72% |
| 0.72 |
| 16.67% |
Data calculated with Portfolio123.
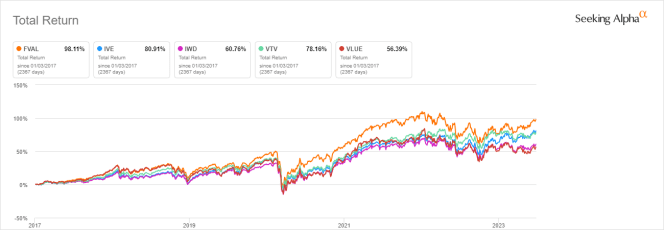
The next chart compares total returns since 1/1/2017 of FVAL and four other large and mid-cap value ETFs, by different issuers and tracking different underlying indexes:
- iShares S&P 500 Value ETF ( IVE ), reviewed here,
- iShares Russell 1000 Value ETF ( IWD ), reviewed here,
- Vanguard Value Index Fund ( VTV ),
- iShares MSCI USA Value Factor ETF ( VLUE ).
FVAL has outperformed its competitors by 17% to 43%. It is also the best performer in 2023 to date:
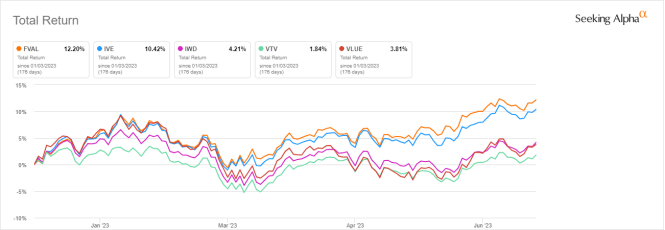
The differentiated ranking system may explain why FVAL beats its peers. Value indexes usually have two shortcomings. The first one is to classify all stocks on the same criteria. It means the valuation ratios are considered comparable across sectors and industries. Obviously, they are not: my monthly dashboard here shows how valuation and quality metrics may vary across sectors. A consequence is to privilege sectors where valuation ratios are naturally cheaper, especially financials. FVAL calculates the value score in a different way for banks. The bias is not fixed across all industries, but it is reduced in the most problematic one.
The second usual weakness of value funds is the price/book ratio (P/B), which adds some risk in the strategy. Historical data show that a large group of companies with low P/B has a higher volatility and deeper drawdowns than a same-size group with low price/earnings, price/sales or price/free cash flow. The next table shows the return and risk metrics of the cheapest quarter of the S&P 500 (i.e., 125 stocks) measured in price/book, price/earnings, price/sales and price/free cash flow. The sets are reconstituted annually between 1/1/2000 and 1/1/2023 with elements in equal weight.
| Annual Return |
| Drawdown |
| Sharpe ratio |
| Volatility |
| Cheapest quarter in P/B |
| 8.54% |
| -81.55% |
| 0.35 |
| 37.06% |
| Cheapest quarter in P/E |
| 10.71% |
| -73.62% |
| 0.48 |
| 25.01% |
| Cheapest quarter in P/S |
| 12.82% |
| -76.16% |
| 0.47 |
| 34.83% |
| Cheapest quarter in P/FCF |
| 15.32% |
| -74.77% |
| 0.61 |
| 27.03% |
Data calculated with Portfolio123.
FVAL uses an inverse P/B ratio (Tangible Book Value to Price), but it weights only 25% of the value score, which is less than in most value indexes.
Takeaway
Fidelity Value Factor ETF holds 126 stocks with value characteristics based on four ratios. The sector breakdown is very close to the S&P 500, whereas most value funds overweight financials. Since inception, it has underperformed the S&P 500 by a short margin. However, most value-oriented strategies and funds have lagged the benchmark in this period. FVAL has beaten a number of other value ETFs by a significant margin since 2017, and in 2023 as well. The underlying index implements a smarter concept of value by giving a lower weight to the price/book ratio and by calculating the value score in a different way for banks.
Fidelity® Value Factor ETF is one of the most attractive large cap value ETFs for long-term investors. It may also be useful in a tactical allocation strategy switching between value and growth styles. The main downside of this fund is liquidity: the average daily trading volume is only 44k shares.
For further details see:
FVAL: Smarter Than Most Value ETFs