KEX - Genesis Energy: Strong Outlook Despite Slight Q1 Miss Maintain Strong Buy
2023-07-21 16:17:24 ET
Summary
- Strong return opportunity: even assuming 6.5x-7.5x 2024E EBITDA (~1.9 to 2.9 std dev below 5-year avg), Genesis Energy, L.P. units value at $17-$24/unit, or ~73%-144% upside over the next 18 months.
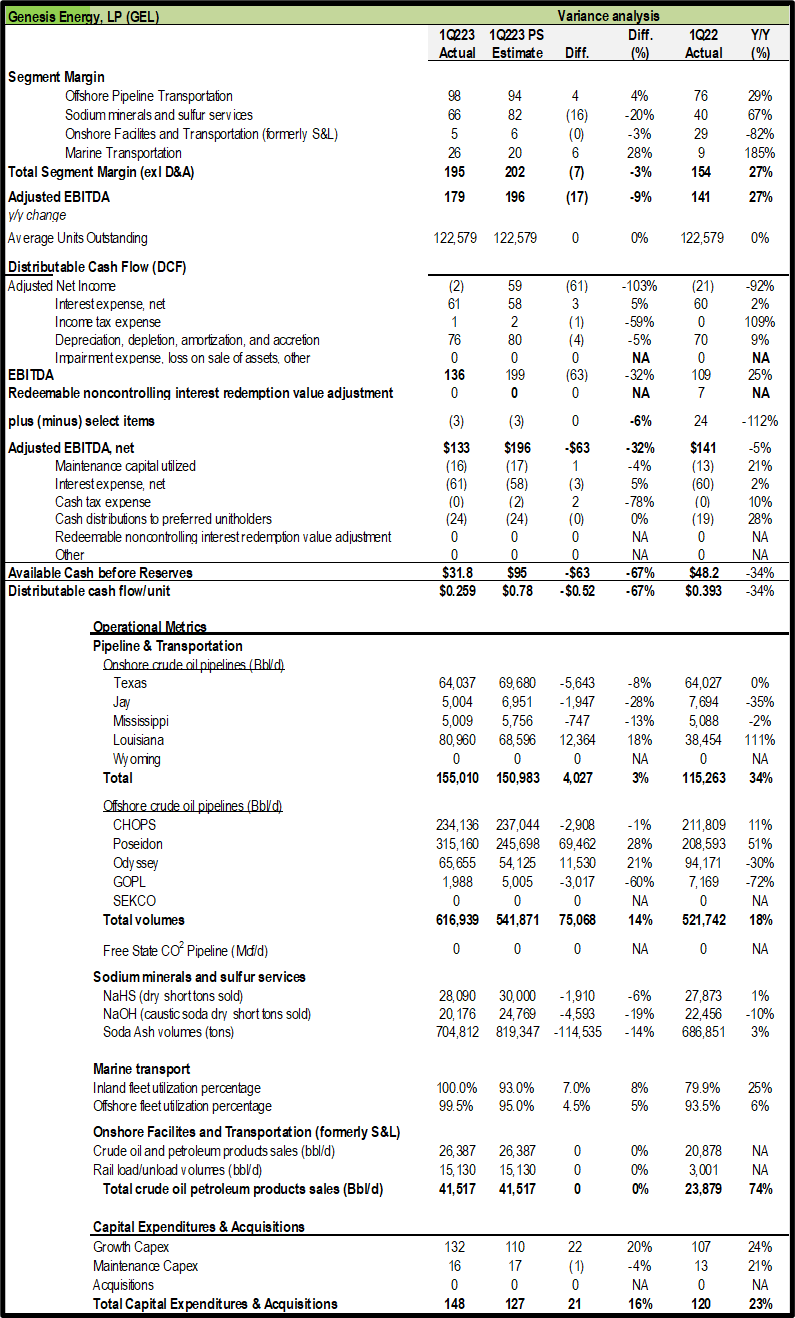
- Genesis Energy Q1 2023 Segment Margin: missed on rail disruption in soda ash business and was in line or beat in other segments.
- Guidance Affirmed: $780-$810M EBITDA for 2023 affirmed, which is conservative, because it assumes a worldwide recession.
GEL Units are down YTD despite strongest outlook in over a decade
Genesis Energy, L.P. ( GEL ) units fell nearly 4.7% in 2022 and are down ~4.6% YTD. Management raised guidance multiple times in 2022 and reiterated 2023 guidance following 2023 results despite a miss in the Sodium Minerals and Sulfur Services segment. The coldest weather in the Rocky Mountains in 23 years disrupted rail service, causing soda ash production volumes to have to be curtailed as there are only five days of storage capacity on site, costing $15M during the quarter and roughly matching the segment margin miss versus our estimate. For the other segments, GEL beat our estimate in aggregate by $10M, resulting in segment margin coming in $7M shy of our segment margin estimate.
In this update, we address the last negative article posted on GEL units as a way to clear up some of the potential confusion regarding its prospects.
In the March 1, 2023 article posted by DT Analysis, "Genesis Energy: Improvements Coming In 2023, Still Not A Fan," DT provides overview data in the name of comparability to a rating system on other companies. In doing so the distribution coverage was rated “very weak,” the leverage “very high,” and the debt serviceability as “dangerous.” We explain in some detail why I disagree with these ratings.
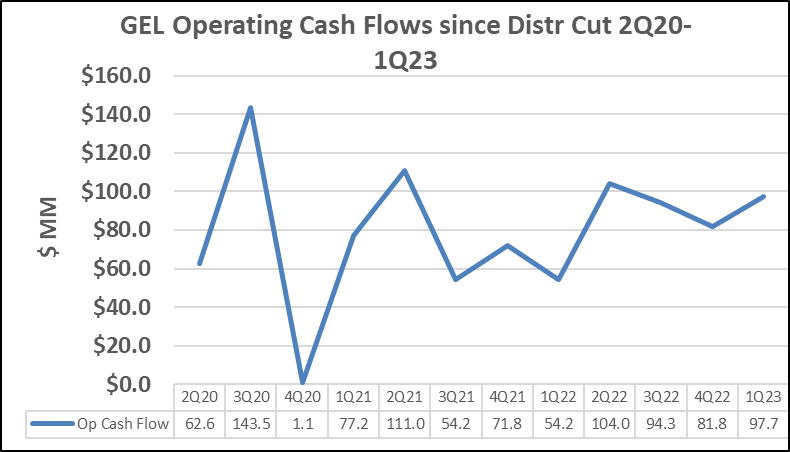
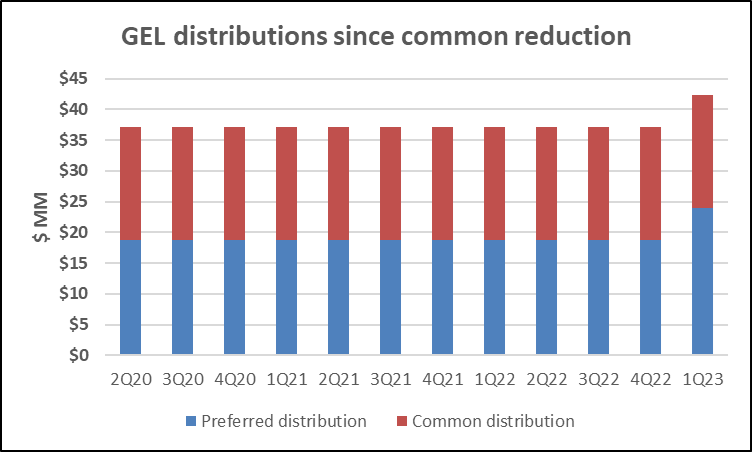
DT Analysis appears to be defending the “very weak” distribution coverage based on distribution payments on preferred and common units totaled $630mm from 2020-2022 while cash inflows totaled $455mm. However, GEL reduced the common distribution payments beginning with the payment in 2Q2020 that was associated with the 1Q2020 declaration that reduced the rate from $0.55/unit/Q or $2.20/unit annualized to $0.15/unit/Q or $0.60/unit annualized. Over the ensuing 12 quarters ending 1Q23, payments on preferred and common distributions totaled $450M. Cash from operations totaled $953MM which represents much larger cash “inflows” than distribution payments. Contrary to the assertion in the DT Analysis article, GEL did not have to borrow to pay the distributions.
Source: Company earnings releases and 10-Q filings.
DT Analysis indicated negative distribution coverage in analyzing distribution payments because free cash flow was negative. He then argues that the company had to borrow to make the distribution payments. This is not the way that the Street nor institutional level investors look at these metrics. The borrowing was for the capital expenditures for projects that are now or will be generating significant cash flow for the company, namely connecting the King Quay and Argos platforms to the GEL offshore pipeline system and expansion of GEL’s soda ash production capabilities.
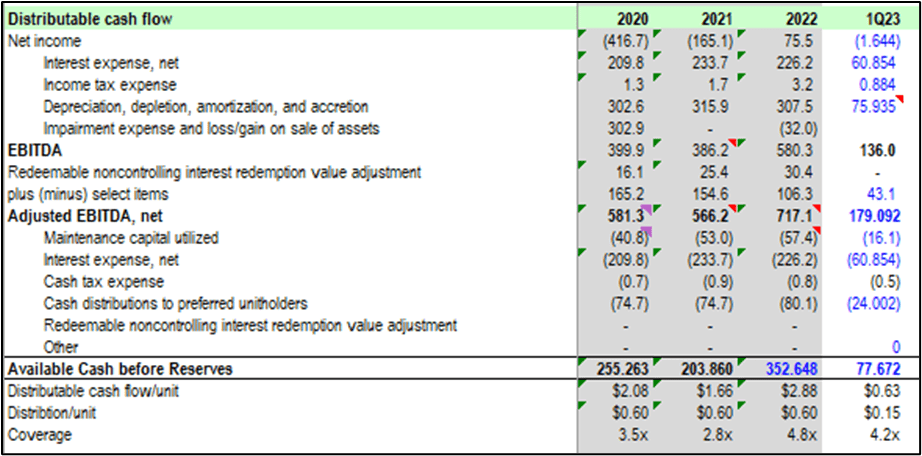
The way to look at distribution coverage is published each quarter by Genesis and for that matter most other MLPs in the form of cash available for distribution. The calculation as shown below is standard for the industry and provides the walkdown from EBITDA to cash available for distribution to unit holders. Note that, contrary to the DT Analysis approach, which uses free cash flow, capital expenditures are excluded in determining distribution coverage.
Source: Company filings, Principal Street
Note that the coverage of the distribution to common unit holders ranged from 2.8x to 4.8x for the years 2020-2022 and 4.2x for 1Q 2023 and is after payments to preferred unit holders. On a quarterly basis the range was 2.6x-6.6x. From an industry standard, such coverage is considered “very strong” and indicates very low risk of a distribution reduction in the future.
Next, let’s take a look at the analysis of the balance sheet . DT Analysis is correct in that leverage has been high in the past. He claims that Net Debt to EBITDA was 5.24x, 8.1x, 6.7x, and 5.5x for 2019-2022. However, this is not how the banks GEL’s look at GEL’s leverage. The Net Debt to EBITDA based on how the banks view it is adjusted EBITDA which eliminates non-cash revenues, expenses, gains, losses and charges, plus or minus select items that are not indicative of core operating results. The select items included unrealized gains or loses on derivative transactions excluding fair value hedges, net of changes in the value of inventory. Over the last 16 quarters, the select items have varied from -$2.8M to $67M, and the annual figure has varied from $42m to $165M. As GEL explains in its quarterly disclosures, Adjusted EBITDA is commonly used by both management and users of the financial statements to aid in assessing and understanding the financial performance of the assets and comparing the performance to that of other midstream energy companies without regard to financing and capital structure.
From our many years covering the company, we have found the select items to be non-forecastable given the varying degree of commodity prices and derivatives at any point in time. In making these adjustments, we calculate a lower leverage ratio than DT Analysis.
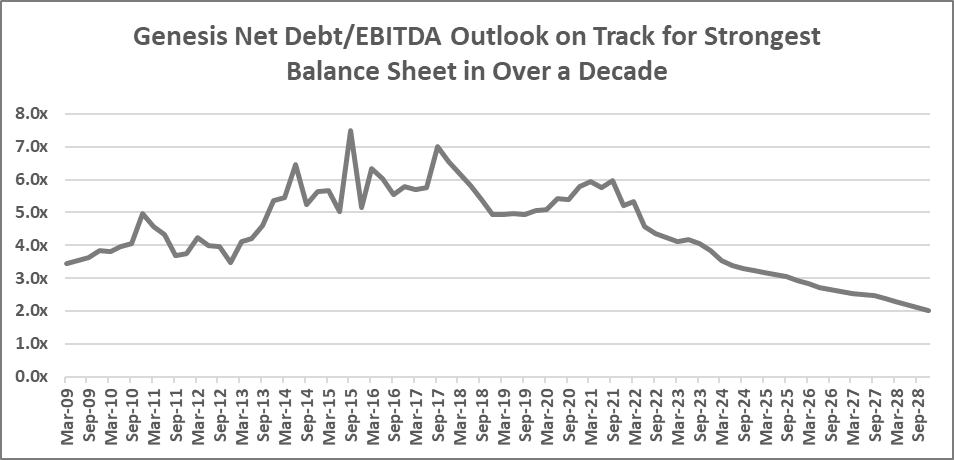
In addition, we find that DT Analysis brushes over the ramping up of cash flow from projects that have been recently placed in service or looking to the projects to be placed in service soon that are expected to be significant positives for the GEL balance sheet outlook as shown in the figure below. He also mentions that “the weak economic outlook could prove a hindrance” despite the fact that GEL management has conservatively, already assumed a global recession in its guidance.
Source: Company filings, Principal Street estimates.
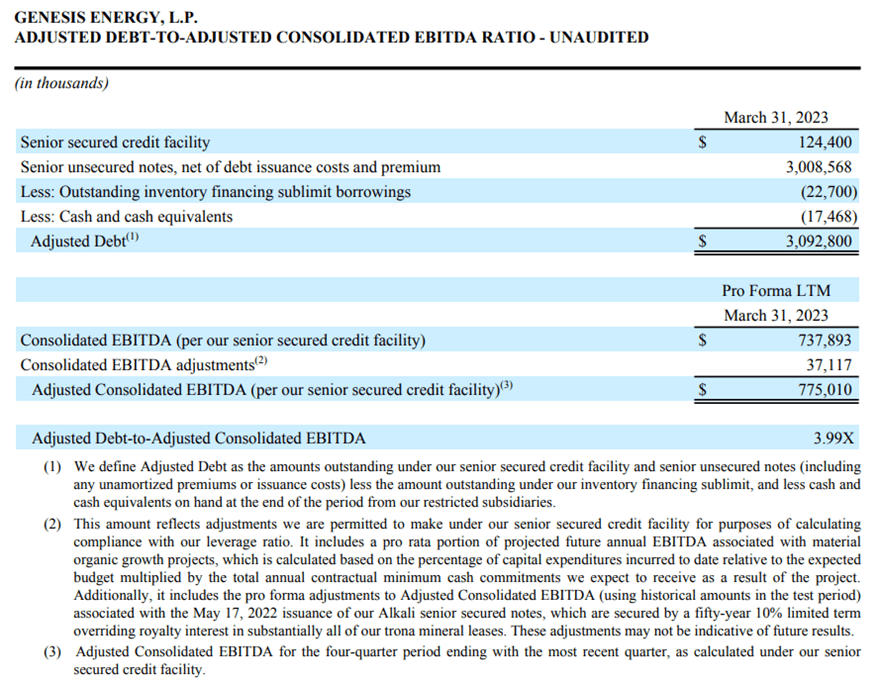
As the balance sheet stands at the end of 1Q2023, we would have to go back ten years for the Debt/EBITDA to be this low. Moreover, with debt/EBITDA near 4.0x, this level of leverage stands in direct contrast to DT Analysis description of the debt serviceability as “dangerous" following the fourth quarter of 2022. As the additional projects come online GEL has solid prospects for significant balance sheet strengthening as shown in the graph above.
Details of the EBITDA outlook are as follows:
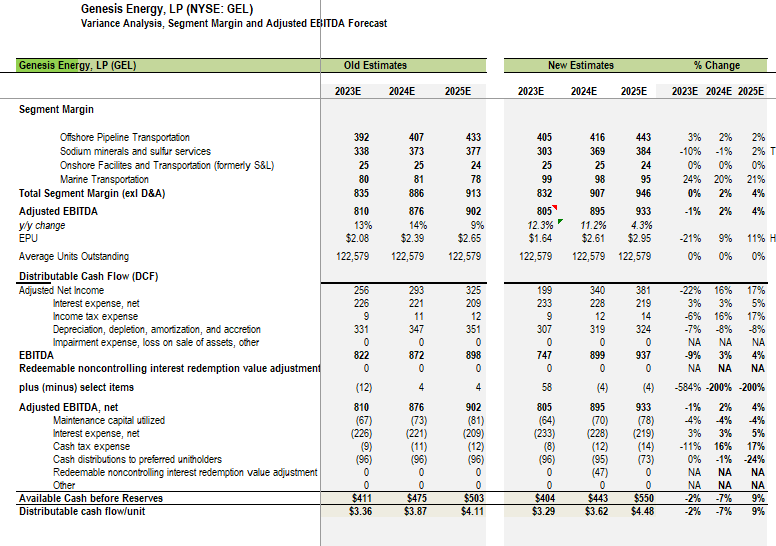
- GEL management affirmed 2023 adjusted EBITDA guidance despite the 1Q miss at $780-$810 million. We trimmed our full year estimate to $805M from $810M on the miss and despite adjusted EBITDA coming in $17 million shy of our estimate.
- The original Granger soda ash facility as well as the incremental capacity from the Granger expansion project is expected to also generate significant incremental EBITDA.
- Volumes from BP’s Argos production facility have started flowing. The third well at Argos came online in May and we expect approximately one well per month to come online and reach or exceed the planned production of 140,000 b/d. Volume is tracking at approximately 40,000 b/d (13,300 b/d per well) with 14 wells total expected. If the expected wells continue producing at a ~13,000 b/d pace, when all 14 well are online and producing would translate to ~180,000 b/d which contrasts with the original expectations of 140,000 b/d when production is fully ramped.
- The King Quay platform being operated by Murphy Oil is producing 115,000 b/d vs the original assumption of ~80,000 b/d. The incremental barrels are contributing to the guidance for 2023.
- Shenandoah and Salamanca are expected to come online in late 2024 and early 2025 respectively. The formation is outstanding with test wells coming in at 24,000 b/d and suggests that the production could exceed the expected 160,000 b/d when the developments are put into commercial operation and connected to GEL’s offshore pipeline system. Given the cap ex for the SYNC pipeline connecting Shenandoah and Salamanca, we expect EBITDA from the project to result in a mid-single digit multiple or in the $100M range after the volume fully ramps
- The Argos, King Quay and Shenandoah and Salamanca systems combined will be producing 400,000 b/d in aggregate all of which will be flowing through the Genesis offshore pipeline system and is 7% of the Permian Basin total and 35% of the Bakken total oil production just to provide some context to the incremental volume. This volume is 100% dedicated to GEL’s pipelines and expected to be productive for the next 30-40 years.
- The recent lease sale for GoM producing acreage showed strong interest as oil companies paid $264M for 313 tracts covering 1.6M acres. 715,000 of those acres or 40% of the total are in the vicinity of GEL’s SECKO pipeline and its SYNC pipeline which is an extension of its CHOPS pipeline.
- Management reiterated ongoing commercial discussions for another 150,000-200,000 b/d to be realized the next 2-4 years on their offshore pipelines system.
- Balance sheet leverage dropped to 4.1x at the end of 1Q2023, the lowest leverage since 1Q2013 and down to 3.99x when making all the adjustments to conform to GEL’s bank covenants.
Source: Company 1Q earnings release.
- Marine transportation is operating at near 100% utilization and at spot and contracted day rates last seen in 2014-2015. Kirby Corporation ( KEX ) had this to say on their 4Q22 earnings call:
- “We continue to expect refinery and petrochemical plant activity to remain high with an increase in customer volumes. Barge availability is constrained as there is minimal new barge construction expected in 2023. These positive factors are expected to contribute to our barge utilization running in the low- to mid-90% range for the foreseeable future. These favorable supply and demand dynamics are expected to drive further improvements in the spot market…”
- On Kirby’s inland barge business at an investor conference in May:
- “On the inland side of our business, supply is very tight right now. We are going through a maintenance bubble that’s going to only add to the supply tightness, and this maintenance bubble is just not Kirby, it’s the whole industry is facing it.” The company added the “maintenance bubble is going to stretch over this year and next.” In addition, the cost to build a new barge has doubled since pre-COVID to ~$4MM. The rate to get there for adding more barge capacity has a way to go. As a result, “we don’t expect any new builds to happen until we see some direction that were getting close to the rate that gives you an adequate return.” The total order book for Kirby is 6 barges on a total inland barge population of 4,000 which is less than retirements. Kirby’s utilization is ~95% versus high 80s about a year ago and has pushed up pricing by ~20% y/y. During the 1Q spot prices were up 25% y/y and inland barge revenues were up 22% y/y despite significant weather-related delays from high winds, heavy fog and lock delays.
Our variance analysis for 1Q23 results shown below missed our estimate due primarily to the coldest winter weather in 23 years that disrupted rail service for moving soda ash to market.
Source: Company earnings release, Principal Street estimates.
Outlook for 2023-2025 remains very strong
The outlook for 2023-2024 remains very strong even as management said that they are assuming a global recession in guidance. Based on the 1Q miss and reaffirmation by management on the 2023 guidance range of $780-$810M guidance, and as mentioned above, we trimmed our 2023E EBITDA from $810M, to $805M as the beat in the rest of the business offset the miss in the minerals segment, offsetting a large chunk of the 1Q miss. Details: trimmed minerals by 10%, raised offshore pipelines by 3% and raised the marine transport estimate by 24% on the beat while holding onshore. With the weather largely a one-time item, our minerals estimate could prove conservative.
The main risk to our outlook is offshore pipelines. Volumes could be negatively impacted by longer than expected maintenance as well or if hurricane season sees greater disruptions than expected. Guidance assumes 10 days of down time, which is reasonably conservative against an average of six days per year for hurricane-related disruption. That said, ocean temperatures are warmer than average this year, which can result in a greater number of storms. For 2024 and 2025 we raised total adjusted EBITDA by 2% to $895 for 2024 and by 4% for 2025, to $933M. Our estimates are well above consensus of $812M for 2024 and $874M for 2025.
We believe that Street estimates are too low for the reasons we explain below.
- Soda ash
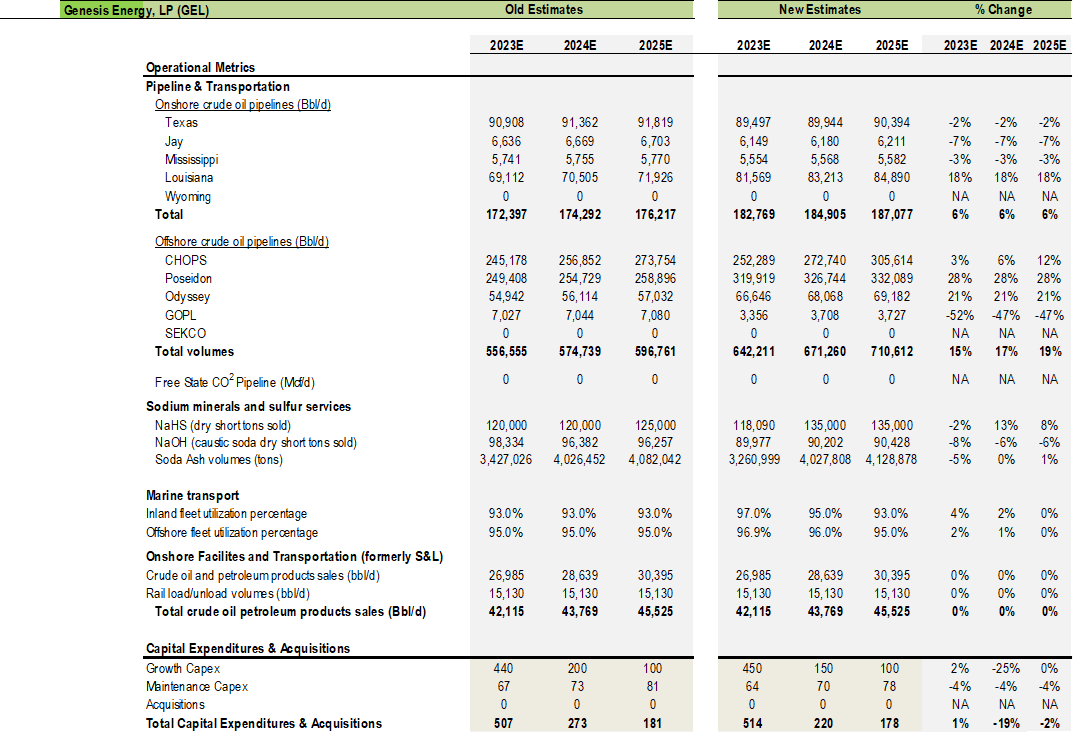
- Volumes of 704.8K tons sold in 1Q2023, 14% below our estimate of 819k tons on rail disruption due to weather. Living in Idaho, we experienced our share of weather-related disruption during the winter. Elevations in Wyoming are even higher. We assume a ~165k increase in soda ash sales even though production capacity in 2023 is expected to increase 600-700k tons per management for the restart of the original Granger production facility on Jan 1 and the completion of the Granger Optimization Project in the second half of 2023 which adds an incremental 750,000 tons of annual production capacity. Taking these two events together gets to the expected average increase of 600,000-700,000 tons of production in 2023 and which gets to management guidance of 4.2M tons of capacity by the end of 2023. However, to be conservate, we assume an increase of only ~165,000 tons in production in our 2023 forecast, to 3.26M tons. For 2024 and beyond, capacity is expected to reach approximately 4.7M-4.8M tons. Again, to be conservative, we assume production of ~4.0M tons in 2024, ~4.1M tons in 2025 with a ~1% increase in annual production thereafter.
- Price: The price of soda ash increased by 40% from 1Q2022 to 4Q2022 per discussion with the company. The higher price in 4Q2022 is what forms the basis of price negotiations for the upcoming year. However, GEL management is only able to disclose that prices in 2023 will be higher on a weighted average basis than in 2022. If prices merely averaged the 4Q2022 for all of 2023, compared to 2022 the math tells us that the prices would be ~20% higher than in 2022. To be conservative and to account for the fact that certain contracts are locked in 2023 at 2022 prices, we have assumed only a ~4.4% higher price in 2023 compared to 2022 and which implies is ~8.5% below the price charged in 4Q22. Also, recall that Genesis is the global low-cost producer of soda ash.
- NaHS:
- Pricing: We assume average margin/ton decline of 22% in 2023, followed by ~1% increases in 2024 and 2025.
- Volume: We assume ~8% lower tonnage in 2023 relative to 2022 and 1.6% growth in 2024 and 2025 and 2% growth thereafter.
- Offshore pipelines:
- Hurricane downtime: Guidance assumes 10 days of down time on the offshore pipeline system for hurricanes vs the average down time for the offshore pipelines has typically been in the 5-7day range. Last year it was 0 days.
- No min payment in the guidance (nor in our forecast) until connection mid-year for the Argos project which has a 140,000 b/d contract to ship crude oil volumes on the GEL offshore pipeline system.
- Volume : While the original volume from King Quay assumed ~85,000 b/d, the original design capacity, the production platform is currently producing 115,000 b/d. Field tie backs are expected to contribute another 50,000 b/d but to be conservative, we have assumed no such incremental contribution. 160,000 b/d in late 2024 or early 2025 from the SYNC lateral but we have assumed no contribution until 2025 and in 2025 we assume growth in the run rate volume in 4Q25 over 4Q24 of ~80,000 b/d and the full run rate increase not being achieved until 2H2027.
- Marine Shipping:
- Utilization : Total utilization is running at 100% per management commentary in the earnings release yet we assume inland barge utilization of 96%, offshore barges at 96%, and the American Phoenix at 96%.
- Pricing: Management said spot day rates are approaching levels last seen during the 2014-2015 time period. During 2015, the margin per barrel was above $9.00/barrel while we are conservatively assuming ~$8/bbl.
Bottom line is we have significant conservatism embedded in the outlook in terms of both volume and price and yet we are still significantly above Street estimates.
Source: Principal Street estimates. Source: Principal Street estimates.
Valuation Outlook Continues to Suggest ~ a Double Over the Next Two Years Even if We Assume 2-3 turns (or 2-3 standard deviations) below the Five-year Average EV/EBITDA Multiple
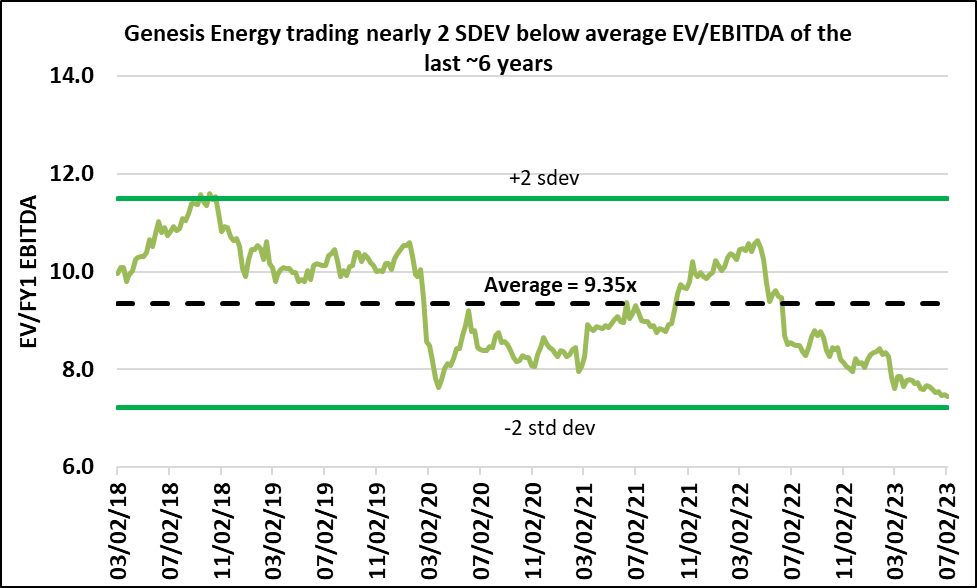
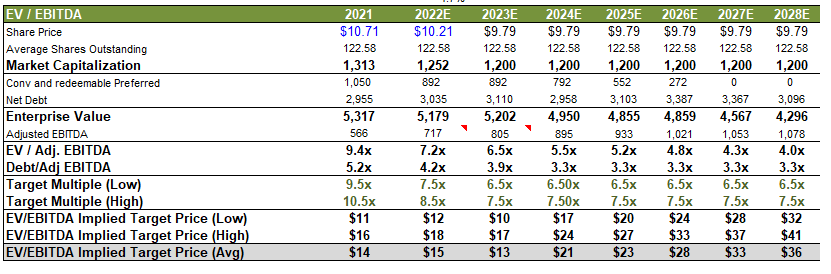
We arrive at a target price outlook ((TP)) of $13, $21, $25 by the end of 2023, 2024, and 2025 respectively on a multiple of 6.5-7.5x EV/EBITDA which is nearly 2-3 turns below the six-year average multiple of 9.35x. Note even if we apply a 6.5x multiple of 2024E EBITDA we obtain $17, or more than 70% upside from the current price of GEL units.
EV/EBITDA Valuation History (Source: Principal Street )
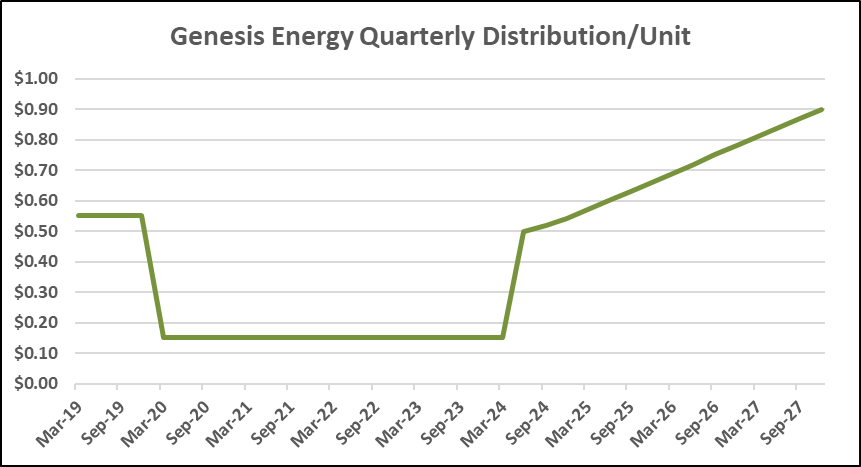
Note in the chart below that given how strong the balance sheet is likely to be along with the high distribution coverage, the distribution is likely to be growing rapidly. We forecast a distribution hike to $0.50/unit attributable to 2Q24 (payable in 3Q24) followed by $0.02/unit/Q for the balance of 2024 and then $0.03/unit/Q increases in the distribution through 2028 and translates to CAGR of ~17% CAGR from the end of 2024 to the end of 2028. Coverage averages between 1.6x to 1.8x and balance leverage drops below 3.0x by the end of 2026 as discussed earlier. We also expect GEL would be in position to repurchase units -- we model that to begin in 2028 but there is enough
Based on an annualized distribution of $2.16 by the end of 2024 and $2.80 by the end of 2025 and applying a yield-based value of ~8.0% would translate into GEL unit valuation of ~$27/unit by the end of 2024 and ~$35/share by the end of 2025 or more than double the current value by the end of 2024 and more than triple the current unit price by the end of 2025.
DPS history and forecast (Source: Company filings, Principal Street estimates. )
Risks
Weather: With offshore pipelines that deliver services to offshore oil and gas production platforms, volumes are subject to disruption in the event of severe weather such as hurricanes. While the average hurricane season sees ~6 days of down time and guidance has assumed a conservative 10 days of down time, days of disruption is highly variable. Over the last decade the number of days of disruption has varied from 0 to 30. We estimate that 30 days of disruption could negatively impact segment margin by ~$20-$30MM while 0 days of disruption could positively impact segment margin by ~$10MM relative to guidance and our estimate.
Economy: Guidance assumes a worldwide recession in 2023. There are a number of economic indicators signaling a coming recession such as prolonged yield curve inversion, CPI reaching over 5% (but latest read was 3%), manufacturing PMI in contraction eight consecutive months, Conference Board LEI index <-4%. GDP growth and earnings on the S&P500 usually trough 24 months after interest rates peak (which would suggest such trough would hit 1H2025) but the timing is the subject of debate. Recent economic reports for 2023 have been stronger than expected. With the full impact of higher interest rates usually taking 18 months, such impact should begin to make impact 2H23 with the offset is that the labor market remains tight and federal government spending on infrastructure programs of some $2T (IIJA, IRA, Chips Act) is also beginning to flow to the states and blunting the actions of the Fed to some extent. Should there be no recession in 2023 we would expect some upside to guidance, particularly in the Minerals and Sulfur services segment that have more exposure to the economic cycle than the rest of GEL’s businesses. That being said, management has indicated that the soda ash market is looking to be more balanced than what they were seeing at the beginning of the year when they were seeing a constrained market.
Inland Freight Market Prices: As we mentioned earlier the inland marine shipping market is very tight with leader Kirby indicating that capacity utilization is running in the mid 90% range. GEL management has seen the utilization of its vessels as at or close to 100% and prices not seen since 2014. There is very little new marine capacity being built and according to Kirby, they are expecting fewer vessel additions than retirements, putting upward pressure on marine transport pricing. Should there be any kind of surge in capacity and/or demand for transport services, there could be a downside in the margin contribution from GEL’s marine transport business.
Pipeline in-service delay : We have been conservative in our assumptions regarding the volume ramp rate from the Argos and King Quay platforms. We have assumed a 125,000 b/d increase between the end of 2022 and the end of 2024 compared to the ~220,000 b/d contracted. King Quay is already delivering 30,000 b/d above the 85,000 b/d expected. None-the-less, there is a risk that the total volumes could arrive slower than expected or end up disappointing. Similarly, 160,000 b/d is ultimately expected from the SYNC lateral and is expected to begin flowing late in 2024 or early 2025. Delays to the timing and/or volumes could result in lower EBITDA than what we forecast in our model.
Valuation history and outlook (Source: Principal Street estimates)
Valuation: While applying a valuation multiple nearly 3 standard deviations below the average of the last six years suggests that GEL units could more than triple from current levels over the next five years, nonetheless, depressed valuations could continue or even get worse than they are now. Both higher expected distributions and/or unit buybacks could mitigate depressed valuations to a large extent, other factors and or market conditions could make implementing such an approach difficult or impossible.
Conclusion
While 1Q23 results slightly missed, the reaffirmed guidance was the best we have seen from Genesis Energy in years. Genesis struggled for a number of years, but has turned the corner.
We continue to believe that an investment in Genesis Energy units remains compelling and has a high probability of delivering returns to investors that outperform the broader market averages all while delivering attractive income.
For further details see:
Genesis Energy: Strong Outlook Despite Slight Q1 Miss, Maintain Strong Buy