TSLA - Giverny Capital Asset Management Q2 2023 Letter
2023-07-28 12:30:00 ET
Summary
- Giverny Capital Asset Management, LLC is a partnership between Giverny Capital of Montreal and David Poppe, the former president and chief executive officer of Ruane, Cunniff & Goldfarb, LLC.
- For the second quarter of 2023, Giverny Capital Asset Management’s model portfolio rose 7.92%, net of fees.
- For the year-to-date ended June 30, 2023, the GCAM model, which is a Poppe family account, generated a return of 14.46% vs. 16.89% for the Index, net of fees.
- It is frustrating tocompete with the Index these days.
- Beingunderweight global technology behemoths represents poor portfolio construction.
To Our Clients & Friends:
For the second quarter of 2023, Giverny Capital Asset Management’s model portfolio rose 7.92%, net of fees 1 vs. 8.74% for the Standard & Poor’s 500 Index. 2 ( SP500 , SPX ) For the year-to-date ended June 30, 2023, the GCAM model, which is a Poppe family account, generated a return of 14.46% vs. 16.89% for the Index, net of fees. Our firm is now 39 months old and has generated annualized performance of 17.4%, net of fees, vs. 20.1% for the Index since inception.
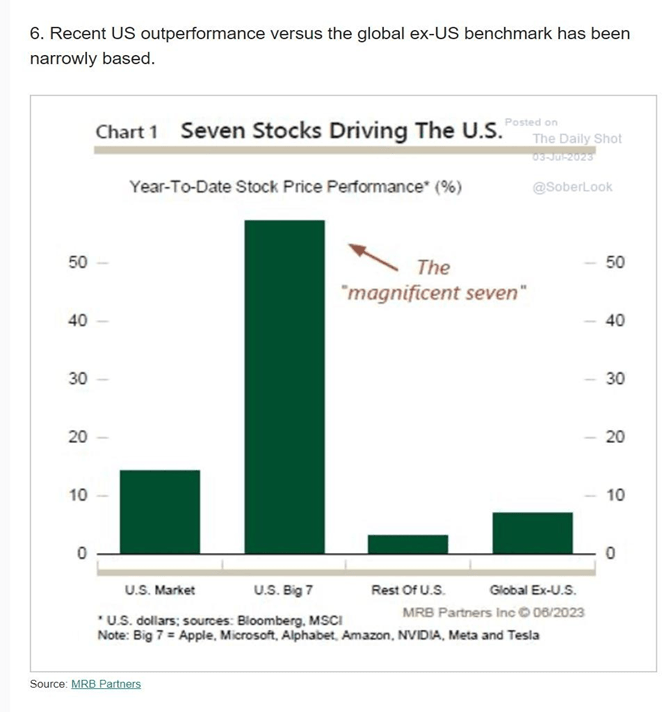
Probably many of our clients have read in the financial press a story (or three) about how narrow this year’s stock market performance has been. The seven largest US tech stocks by market cap – Apple, Microsoft , Alphabet, Amazon, Meta Platforms, Nvidia and Tesla – are up enormously so far this year, some 61 percent on a market capitalization weighted basis. These seven now account for 27% of the market cap of the S&P Index, while the other 493 stocks in the Index make up 73%. The S&P’s total return for the first half of the year was a very welcome 16.9%, but the constituent parts tell the real story. The Big 7 tech stocks soared while the “Other 493” were up about 6%.
I have believed for a while that we’re better served with a lower weight to the tech giants – we own Alphabet (8.1% of our model portfolio at the end of June) and Meta (5.2%) for a 13.3% exposure, or about half the Index’s weight in the giants. And while Alphabet’s 36% return for the first half and Meta’s 138% return were gratefully received, I’m pleased to report that if we strip out that contribution to our overall return, the other 23 stocks we own, constituting 85% of our portfolio (with cash making up the balance), were up 10.2% on a weighted basis. [This figure includes a significant loss incurred on the sale of First Republic Bank in the first quarter.]
Put another way, your manager made a decision three years ago to focus more on smaller companies that he believes have years of growth ahead of them and to be less reliant on mega cap stocks that, while often fabulously profitable, would have to grow to sizes never seen before in capitalism to justify their lofty valuations. Oversimplified a little, I bet on trees not growing to the sky.
So far, that has not been a winning decision. Since we opened for business on April 1, 2020, our portfolio has generated an altogether satisfactory 17.4% annualized return – satisfactory except when compared to the Index, which has generated a 20.1% annualized return.
I have nothing uncomplimentary to say about the Big Tech stocks. On balance, they are extraordinary businesses that mostly dominate digital commerce ecosystems that lend themselves to winner-take-all or winner-take-most economics. Apple and Microsoft in particular, are two of the most important companies in the world: very few of us could survive without our smart phones and virtually all office workers depend on Microsoft tools to get their jobs done. These two are not quite global monopolies, but they’re close.
Over the first six months of 2023, Apple rose 50% and Microsoft rose 43%. They now constitute 14.5% of the entire S&P 500 Index and they generated 5.43 percentage points of its total return of 16.9% for the year to date. Nearly one-third of the Index’s return came from two stocks. Combined, they sport a $5.5 trillion market cap, or nearly 28 times their expected pretax operating profits for 2023 of around $200 billion, which will be approximately flat with 2022, according to Factset Research. You read that correctly: the giants are likely to have no profit growth this year, but their stocks are up handsomely.
The market cap numbers are so large it is difficult to contextualize them. But just to try, the market caps of Apple and Microsoft amount roughly to the valuation of 14 million US single family homes, which would be roughly all the homes in Florida and Texas. Or, if you prefer, $5.5 trillion is comfortably larger than the gross domestic product of Japan, a country of 123 million people and the third-largest economy in the world.
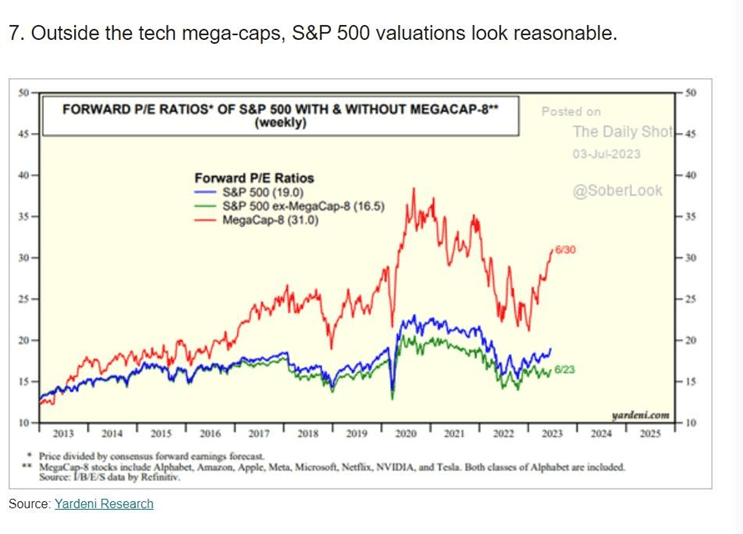
It goes on. Amazon rose 55% for the first six months of the year and trades for 55 times analysts’ earnings estimates for 2024. Nvidia rose 189% while Tesla rose 112%. Their PE multiples are stratospheric. Cumulatively, Apple, Microsoft, Amazon, Nvidia and Tesla contributed just over 10 percentage points of the Index’s overall return of 16.9%. I include a table at the bottom of this letter that breaks down these contributions. There are also two charts that may help you visualize the disparity in performance and PE multiple between Big Tech and the rest of the Index.
GCAM owns two of the seven tech mega caps in Alphabet and Meta, and they enjoyed similar rises. As mentioned, Alphabet A&C shares rose 36% while Meta rose 138%. Together, they added 2.38 percentage points to the overall Index return, meaning these seven tech giants cumulatively generated 12.4 percentage points of return, or roughly three-quarters of the Index’s return.
I don’t give myself a pass for not owning some of the most successful companies in the world. (We sold Amazon at a higher valuation in 2021). But I do know what we own, and why. Importantly, the two mega caps we own are considerably less expensive than the other five. Alphabet and Meta combined sport a $2.25 trillion market cap and between them should generate roughly $120 billion of pretax profit this year. That’s a multiple of 19 times pretax profit, a substantial discount to Microsoft and Apple, and an even larger discount to Amazon, Nvidia and Tesla.
All this is to say, it is frustrating to compete with the Index these days. But when I think about the portfolio we own and my comfort level with owning smaller, faster-growing businesses vs. some of the most expensive companies on earth, I feel this portfolio is the right decision for me and for clients. I made a considered decision in 2020 to limit our exposure to the largest market caps in the Index, and for an extended period of time that has not worked out. The trees are now tickling the clouds. But again, our overall performance is good and our returns are, in fact, coming from decent stock picking outside megacap tech. I don’t believe there is anything systemically wrong with our approach. Arguably, however, being underweight global technology behemoths represents poor portfolio construction.
In case you’re wondering if this is an issue that has become more pronounced recently, the answer is no. Over the 39 months we’ve been operating, Apple is up nearly 230% and Microsoft 131% vs. the overall S&P Index up about 80%. They have been driving the S&P return for some time.
In sum, we’ve generated a good return both this year and over 39 months with a portfolio of excellent companies that are less expensive than the market leading tech stocks. I can live with that.
As for the quarter, we got strong returns from some companies that had been especially weak in 2022. Our four best performers:
| GCAM portfolio companies |
| Q2 2023 Returns |
| Meta Platforms ( META ) |
| 35% |
| Coherent ( COHR ) |
| 34% |
| Carmax ( KMX ) |
| 30% |
| Installed Building Products ( IBP ) |
| 23% |
Meta, Coherent and Carmax were our three worst performing stocks of 2022, which suggests the market tends to react strongly to short-term factors. I perhaps need to be a little more aggressive buying inherently healthy businesses that get clobbered. The pendulum is not only swinging to extremes these days, but also swinging fast.
Our worst performer was Ciena Corp., down 19% for the quarter. Ciena makes optical components which carry voice and data signals across sophisticated communications networks. Ciena’s continuing struggles are a bit surprising given the strength in communications infrastructure spending: we own Arista Networks and Coherent, which participate in different parts of this industry and are faring better. (Coherent is a supplier to Ciena). Ciena also benefits from the banning of the Chinese telecom supplier Huawei from many Western countries. Ciena recently reported some key customers are postponing orders. I exited the position after the end of the quarter.
Progressive Corp. was another laggard, down 7.4% for the quarter. The US market for auto insurance is in disarray. The price of used cars soared during the pandemic as new car production fell, and so the cost to replace a damaged car is far higher than the insurance companies expected when they wrote their policies. Plus, labor and parts shortages mean repair costs are also soaring. One insurance company CEO told me recently that labor inflation for auto body shops continues to rise by double-digit percentages.
Auto insurers collectively lost nearly 12 cents on every dollar of premium they collected in 2022, per S&P Global Market Intelligence. The auto insurance industry is massive – it’s a required product and there are more than 250 million cars in America. It’s a staggering level of loss. Progressive is faring better than its peer group, as it earned a small profit in 2022. However, trends are worse so far in 2023.
The industry is busy raising rates to try to stem losses, but in a regulated industry rate increases tend to lag inflation.
Some companies are shrinking their businesses to shed unprofitable customers, and Progressive has chosen to accelerate its growth rate in the evident belief it can achieve adequate rates on these new customers over time. The question is when high inflation in lost costs will end. Cars are getting more expensive and more high-tech: minor fender benders can now cost $10,000 or more to repair because of the sensors and electronics involved, plus labor inflation.
For years, the overall auto insurance industry earned about one penny of profit on a dollar of premium collected. This is better than it sounds, as the industry earns interest on premium dollars it holds in anticipation of paying future claims. But now, the industry is hemorrhaging cash. Most Americans are going to see their insurance rates spike this year and next, and if used car prices come down at some point, industry profitability should revert to the norm. But it’s unclear when that will happen.
During the quarter, our clients received a video of the investor meeting held by our partners at Giverny Capital Inc. in Montreal in April. Hopefully, you found that helpful. Francois Rochon and I will host a meeting for GCAM clients in New York City in the fall. We’ll send details about that meeting to our clients separately and we hope to see many of you there.
With every good wish,
David M. Poppe
Footnotes1 The family account does not pay a management fee. The returns presented herein assume the deduction of an annual management fee of 1% to show what a client’s account performance would have been if it had been invested the same as the family account during the period. Past performance is not necessarily indicative of future results. 2 The S&P 500 Index returns include the reinvestment of dividends and other earnings. The Index is an unmanaged, capitalization-weighted Index of common stocks of 500 major US corporations. The Index does not incur expenses and is not available for investment. |
| Company |
| S&P 500 Index Ending Portfolio Weight |
| Six-month return |
| Contribution to Index return |
| Apple ( AAPL ) |
| 7.7% |
| 49.7% |
| 3.0% |
| Microsoft ( MSFT ) |
| 6.8% |
| 42.7% |
| 2.4% |
| 3.5% |
| 36.0% |
| 1.2% |
| Amazon ( AMZN ) |
| 2.9% |
| 55.2% |
| 1.3% |
| NVIDIA ( NVDA ) |
| 2.8% |
| 189.5% |
| 2.2% |
| Meta Platforms ( META ) |
| 1.7% |
| 138.5% |
| 1.2% |
| Tesla ( TSLA ) |
| 1.6% |
| 112.5% |
| 1.1% |
| Big 7 total |
| 27.0% |
| 61.1% |
| 12.5% |
| Other 493 |
| 73.0% |
| 5.9% |
| 4.4% |
| S&P 500 Index |
| 100% |
| 16.9% |
| 16.9% |
| GCAM portfolio |
| GCAM Ending portfolio weight |
| Six-month return |
| Contribution to GCAM return |
| Alphabet A&C |
| 8.1% |
| 36.0% |
| 2.7% |
| Meta Platforms |
| 5.2% |
| 138.5% |
| 3.5% |
| Big Tech total |
| 13.3% |
| 63.1% |
| 6.3% |
| Other 23 GCAM holdings + cash |
| 86.7% |
| 10.2% |
| 8.8% |
| GCAM total return |
| 100% |
| 15.07%* |
| 15.07% |
|
| Giverny Capital Asset Management ( Top 10 holdings - June 30, 2023 ) |
| 8.1% |
| Arista Networks ( ANET ) |
| 7.0% |
| Constellation Software ( CNSWF ) |
| 6.9% |
| Progressive Corp. ( PGR ) |
| 6.6% |
| Carmax ( KMX ) |
| 5.6% |
| Heico Class A ( HEI ) |
| 5.3% |
| Meta Platforms ( META ) |
| 5.2% |
| Five Below ( FIVE ) |
| 4.7% |
| Ametek ( AME ) |
| 4.4% |
| Charles Schwab ( SCHW ) |
| 4.4% |
| Total |
| 58.1% |
Editor's Note: The summary bullets for this article were chosen by Seeking Alpha editors.
For further details see:
Giverny Capital Asset Management Q2 2023 Letter