YRI:CC - Gold: A No-Brainer
- Gold recently went through a textbook 20% correction, and many quality gold miners got pummeled, dropping by 30-50% or more.
- While many analysts are modeling gold miners' earnings using stagnant or lower gold prices, the price of gold could move substantially higher in the coming years.
- Inflation is high, the national debt is massive, the economy is in a recession, and the Fed probably won't continue tightening for too long.
- Instead, the Fed may need to reverse monetary policy soon, admitting that the "new normal" inflation rate could be well above 2%.
- The market is behind the curve on gold, and we could see gold and gold miners' prices rise dramatically in future years.
Gold and gold miners have been controversial investments over the last several years. Despite its substantial run-up from late 2018, gold has primarily traded sideways and has underperformed most major stock market averages over the previous few years. Therefore, many investors view gold as an unnecessary investment or a hedge that may or may not pay off. However, gold is much more than a hedge. We are witnessing the highest inflation in decades in the U.S. Additionally, the U.S. national debt is sky high and is likely only moving higher. The Fed's balance sheet is remarkably bloated, and while the central bank is raising interest rates now, it may have to reverse policy sooner than expected. Gold gets no respect from the market, is an unloved trade, and has been a hated investment for years. Now, the market is substantially behind the curve on gold and gold miners.
One of the greatest investors of all time, Benjamin Graham, said that the market is a voting machine in the short term but a weighing machine in the long run. The market has been voting negatively on gold recently, but the market should begin weighing the yellow metal soon, and the price of gold should go much higher. According to Mr. Graham, the intelligent investor is a realist who sells to optimists and buys from pessimists. Many pessimists have been selling their gold mining shares lately, and quality gold miners should appreciate considerably as gold surges in the coming years.
Gold vs. Stocks Last 5 Years
In the last five years, the Nasdaq Composite is up by roughly 100%, the S&P 500/SPX is up by approximately 70%, but gold has appreciated by fewer than 40%, and the VanEck Vectors Gold Miners ETF ( GDX ) is up by just 12%. We see significant underperformance here, especially regarding gold mining shares relative to the broader stock market. However, times change, and gold will have its moment in the sun.
Gold - A Technical Perspective
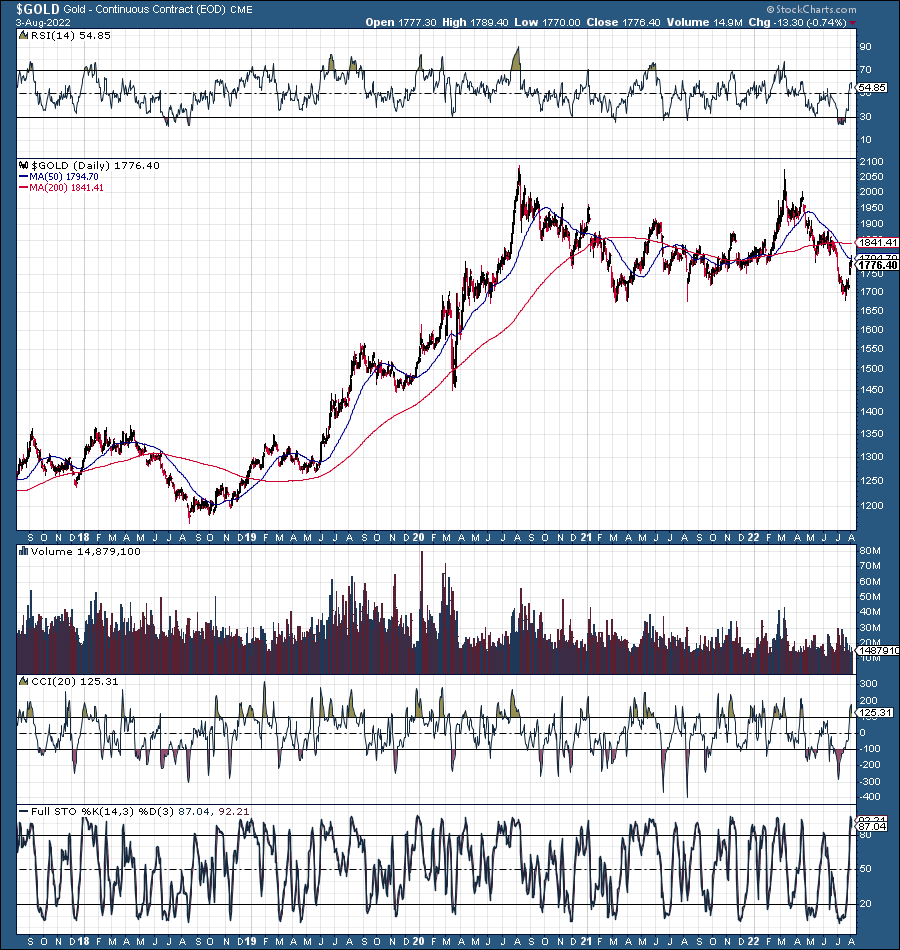
Gold hit an ATH at around $2,100 in 2020, and the yellow metal topped out at a similar price several months ago. We saw a substantial drop since the double top, with gold cascading by roughly 20% before rebounding. Thus, we saw a textbook correction before bottoming at the critical support level around $1,700-1,670. Moreover, we witnessed remarkably oversold technical conditions, as Gold's RSI dropped close to 20 for several weeks, illustrating panic and capitulation-like market conditions. Gold may have put in another long-term bottom and could continue rising, possibly to new highs.
Inflation, Inflation, Inflation
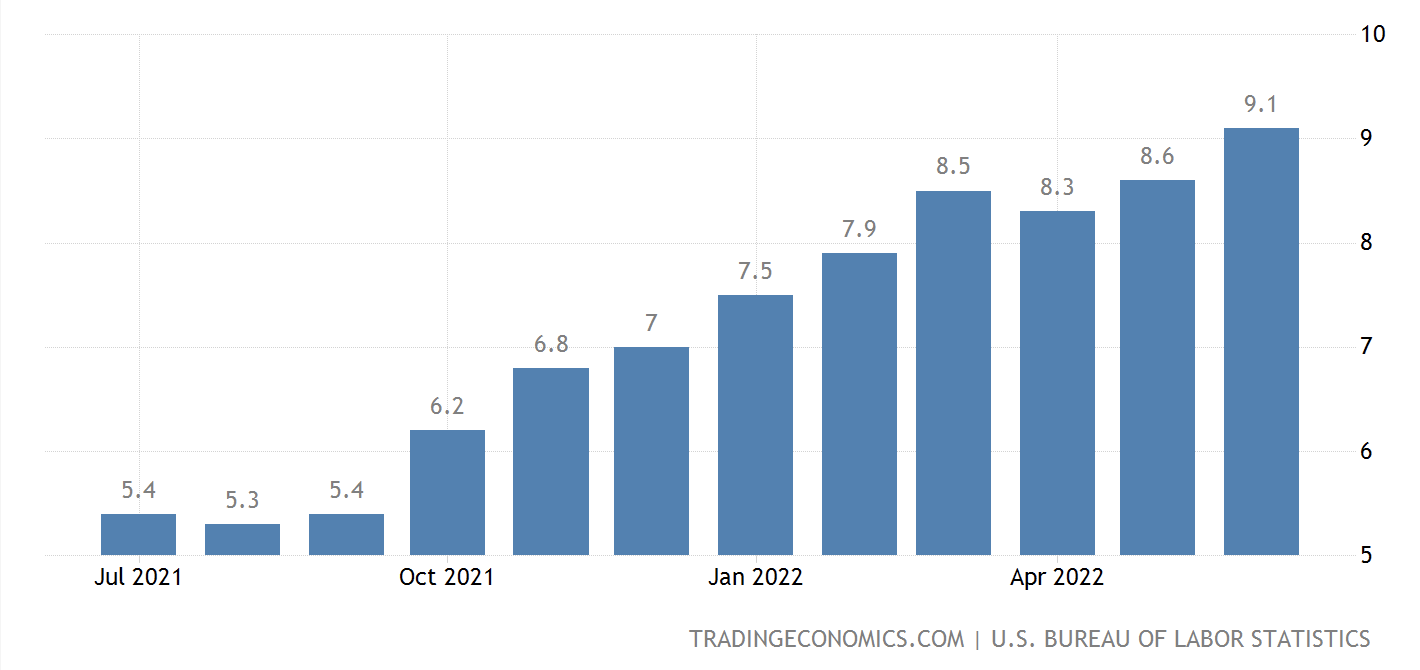
The last CPI inflation reading was 9.1%, remarkably high. Inflation is around a 40-year high here, and there is no guarantee that it's coming back down. The "normal" inflation rate is only about 2%, and we may not see inflation that low again, with the new normal being much higher. Gold is an ideal hedge when inflation is high as money depreciates in times of inflation, but gold does not.
So, why isn't gold skyrocketing here?
Well, it's because the Fed's been raising interest rates, and the market seems to believe the central bank can control inflation. However, the Fed claimed that inflation was transitory, essentially a non-issue in previous years. With inflation flying around 40-year highs, we see that the reality is much different. Therefore, I am not convinced that the Fed can contain inflation. Moreover, the Fed may need to stop raising rates soon and reverse policy as the economic slowdown persists.
The Fed - Policy Reversal is Possible Soon
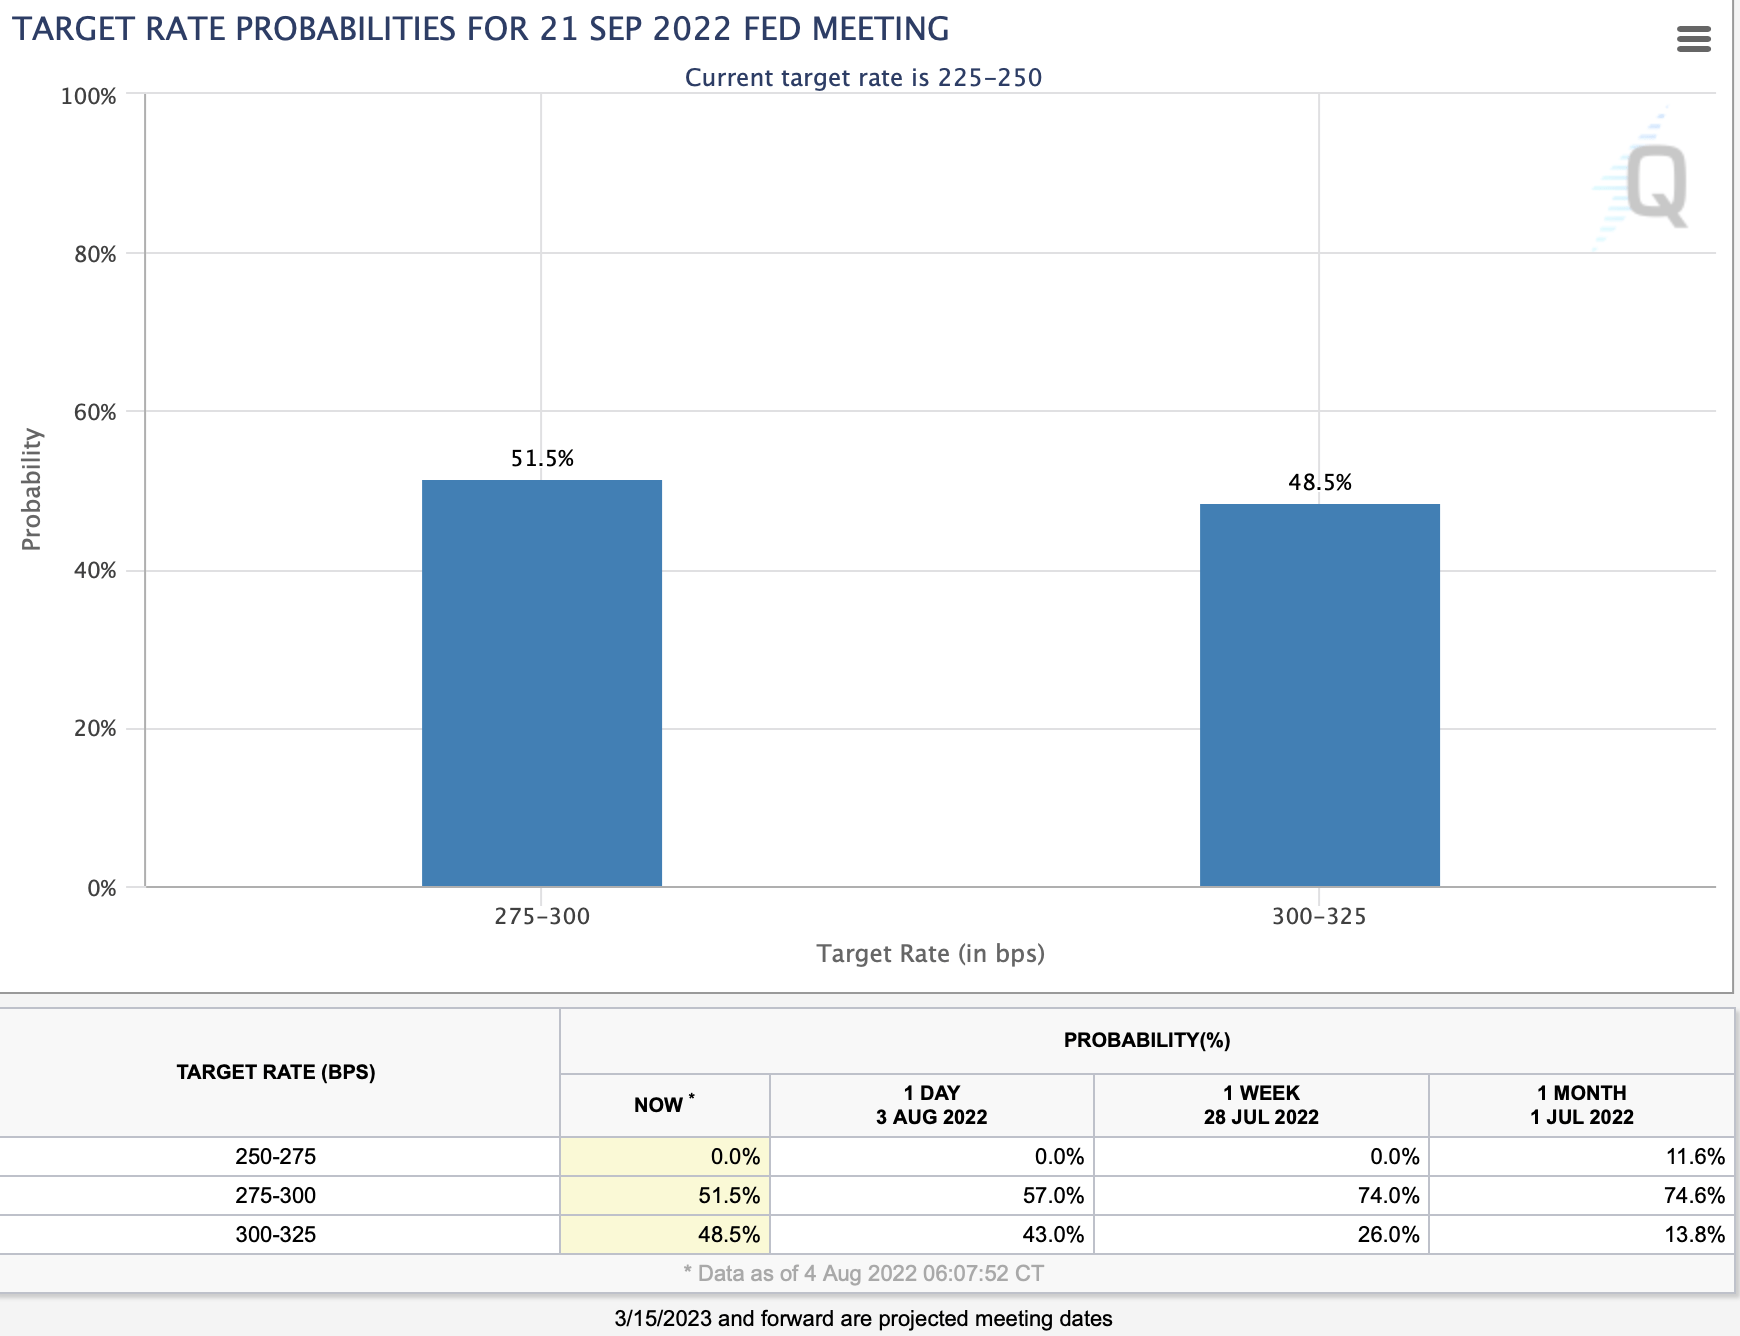
We saw back-to-back 75 basis point increases in back-to-back months. The benchmark is at 2.25-2.5%, and much of the higher rate environment is priced in. Next month we may only see a 25-basis point increase or a 50-basis point rise. Moreover, there is more than a 60% probability that the benchmark rate will be around 3-3.5% by the end of this year , which is slightly higher than where we are today. In other words, the Fed's tightening program is slowing drastically, and the Fed may not have much room to hike.
U.S. GDP
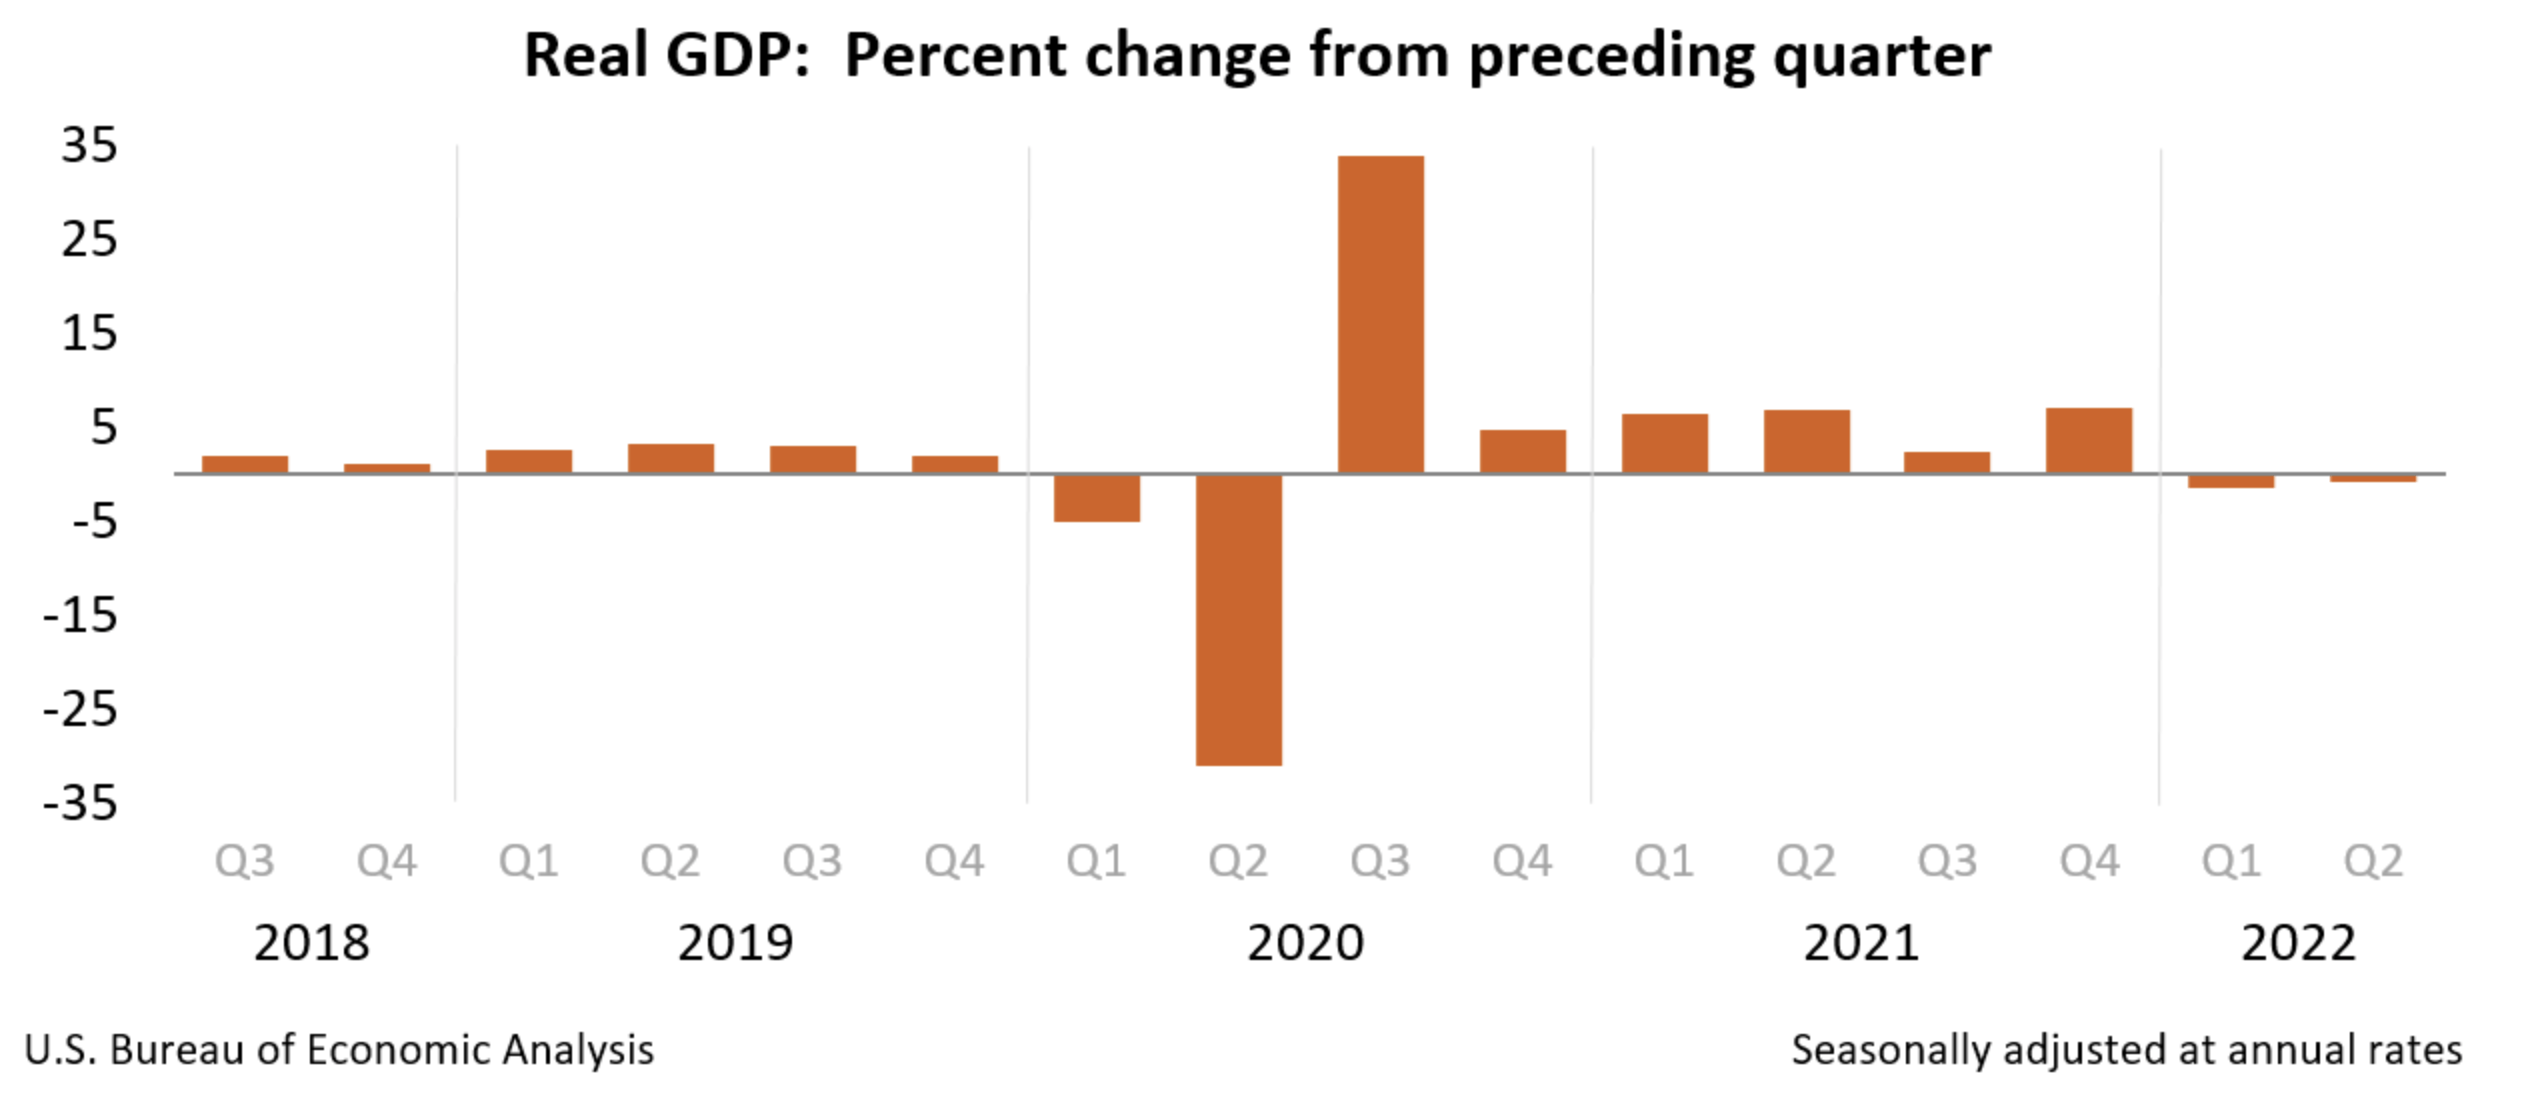
After all, we recently saw the second negative GDP quarter, illustrating that the U.S. economy is in an official recession now. While the Fed may keep the mild rate increases coming for several months, it will be increasingly difficult to justify rate increases with the economy in recession. Furthermore, the Fed may be forced to acknowledge that the "normal" inflation rate will be higher in the "new normal" reality. Therefore, the Fed may increase the target inflation rate from 2% to 3-5%, allowing the Federal Reserve to return to easing earlier than in other cycles. Thus, the Fed may switch its policy much earlier than anticipated, which is exceptionally bullish for gold. Oh, and there is the debt situation to consider.
The National Debt is Too High to Ignore
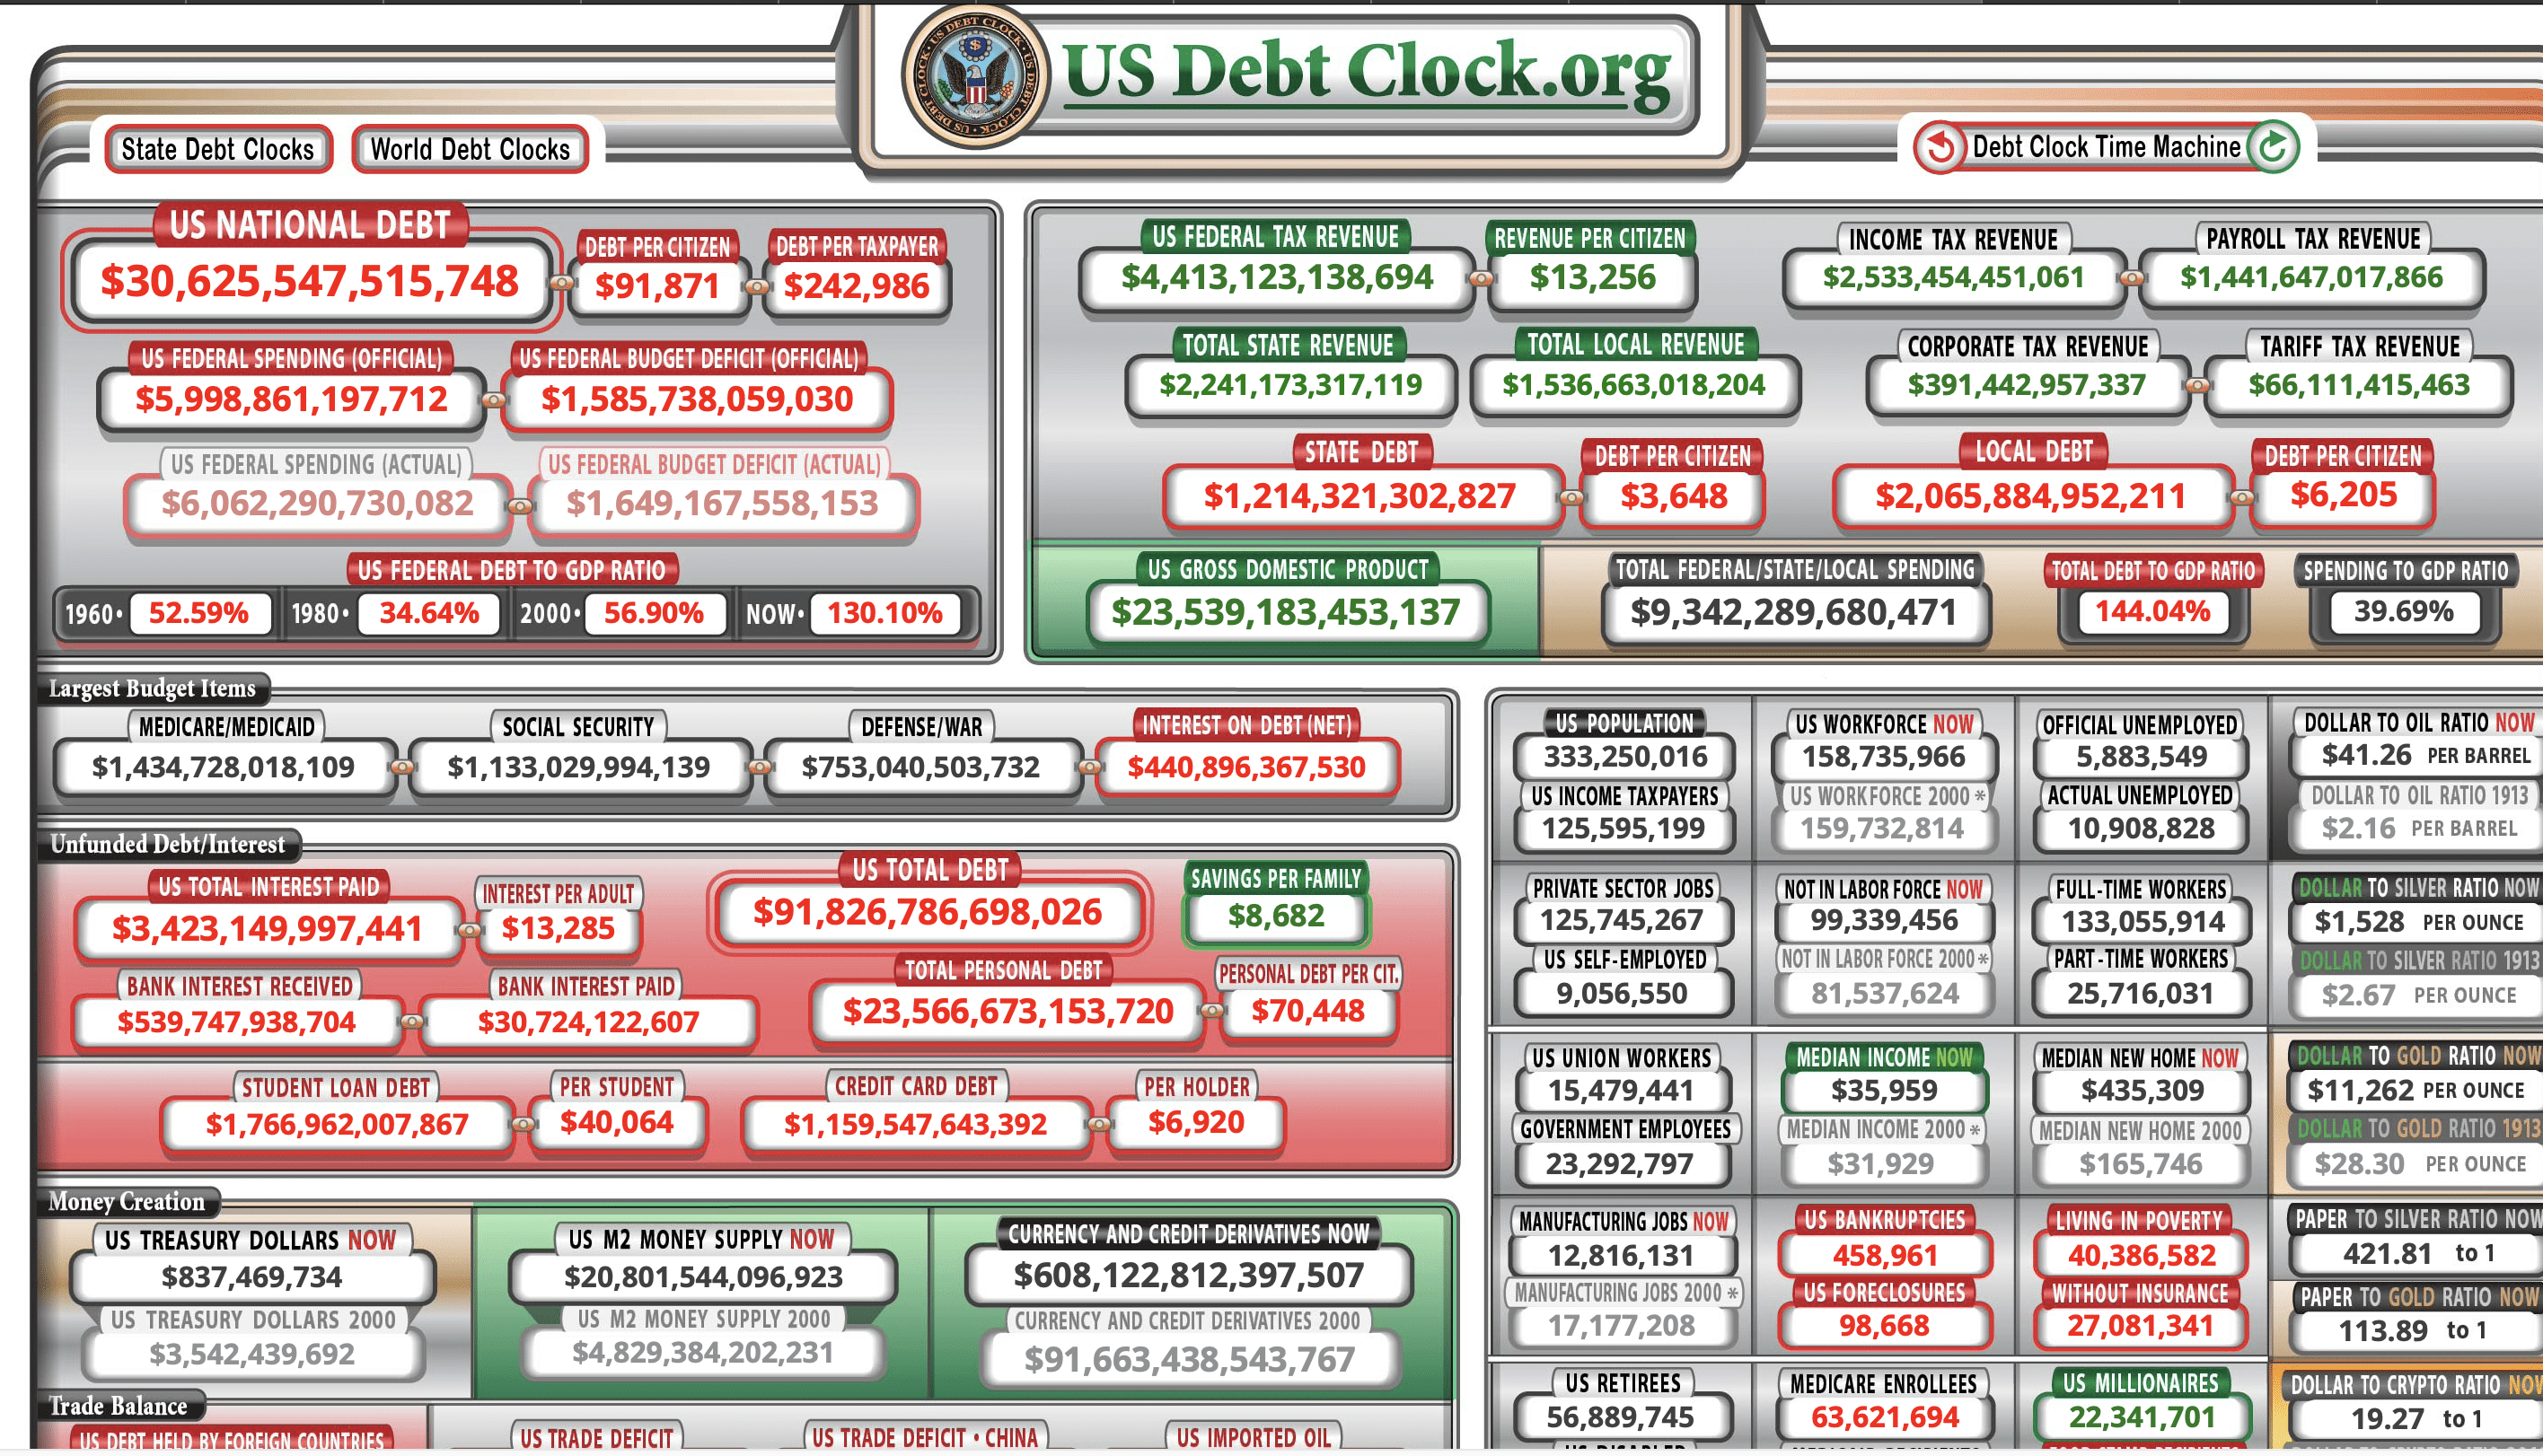
Just look at the national debt. It's more than $30 trillion, and the "actual" federal budget deficit is more than $1.6 trillion. The monstrous debt is 130% of GDP, and the total U.S. debt is 144% of GDP. We see the alarming trend of continuously rising debt to GDP ratio. Also, the debt servicing payments have swelled to $440 billion , making debt servicing one of the most significant federal expenses, behind only medical, social security, and defense.
We need to consider that the debt is comprised chiefly of longer-term treasuries. Therefore, the higher the benchmark, the higher the interest payments are for the U.S. The Fed probably cannot raise rates much further because it won't only stall the economy but may lead to an image that the debt is unmanageable. This dynamic could lead to a crisis of confidence in the U.S. treasury market, the dollar, and the financial system itself. Therefore, the Fed will not likely continue raising much further and should return to easing sooner than the market expects.
The Bottom Line: You Want to Own Gold Now
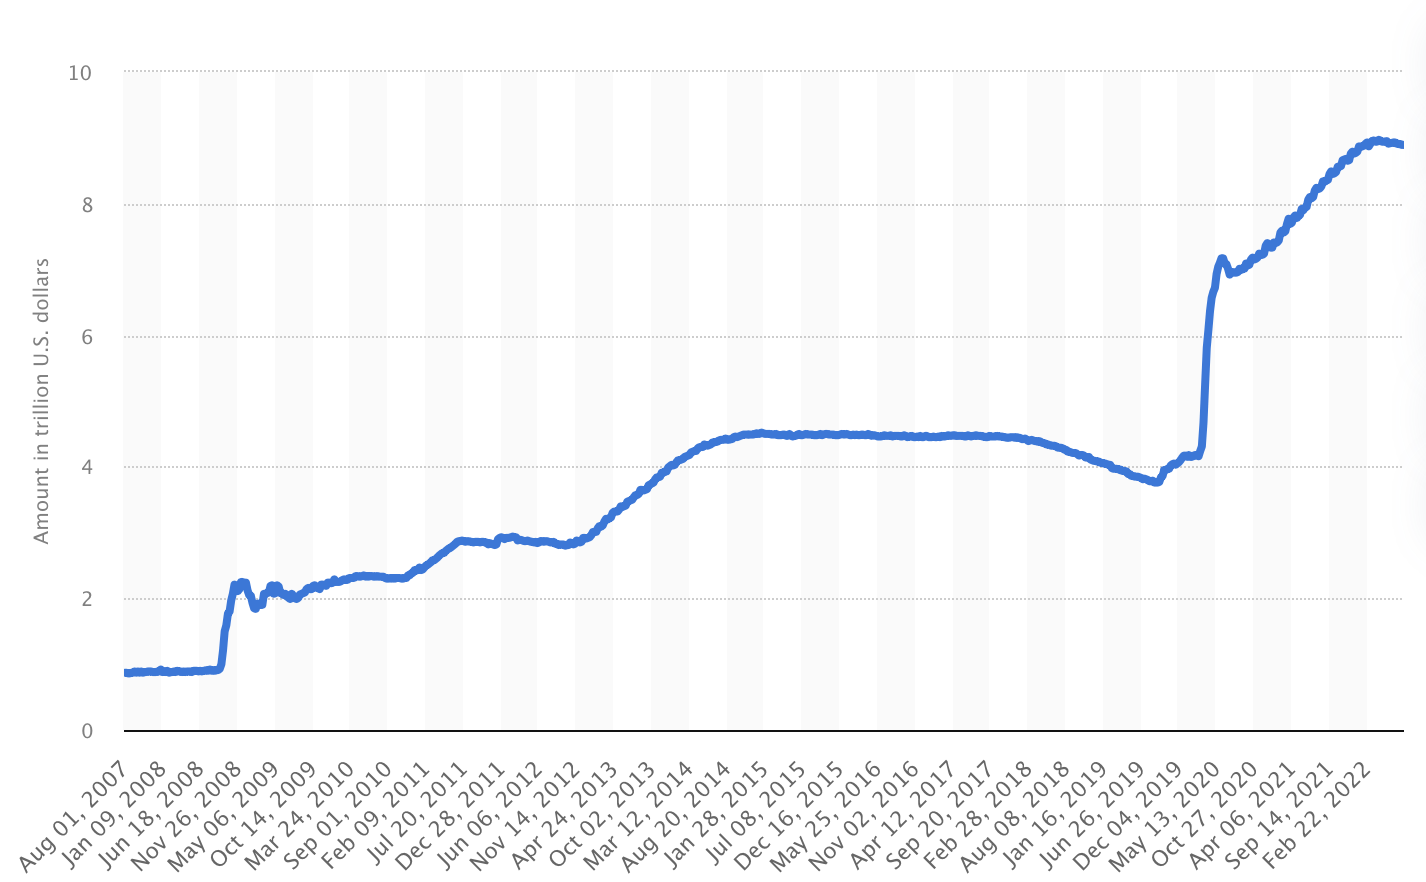
The Fed expanded its balance sheet substantially in recent years (roughly 10x), from around $900 million to approximately $9 trillion since 2008.
The Fed's Balance Sheet
This is what all of the QE and other easing programs have done to the Fed's balance sheet. The Fed attempted to unload its balance sheet in the 2014-2018 era but failed, as it needed to revert to easing to avoid a recession in 2018. We hear similar whispers that the Fed will reduce its balance sheet, but we are in a recession now. Therefore, it is doubtful that we will see any meaningful reductions. Instead, we could see the Fed load up its balance sheet with even more securities to prevent a deep recession and to stimulate the economy in the next round.
The U.S. Monetary Base
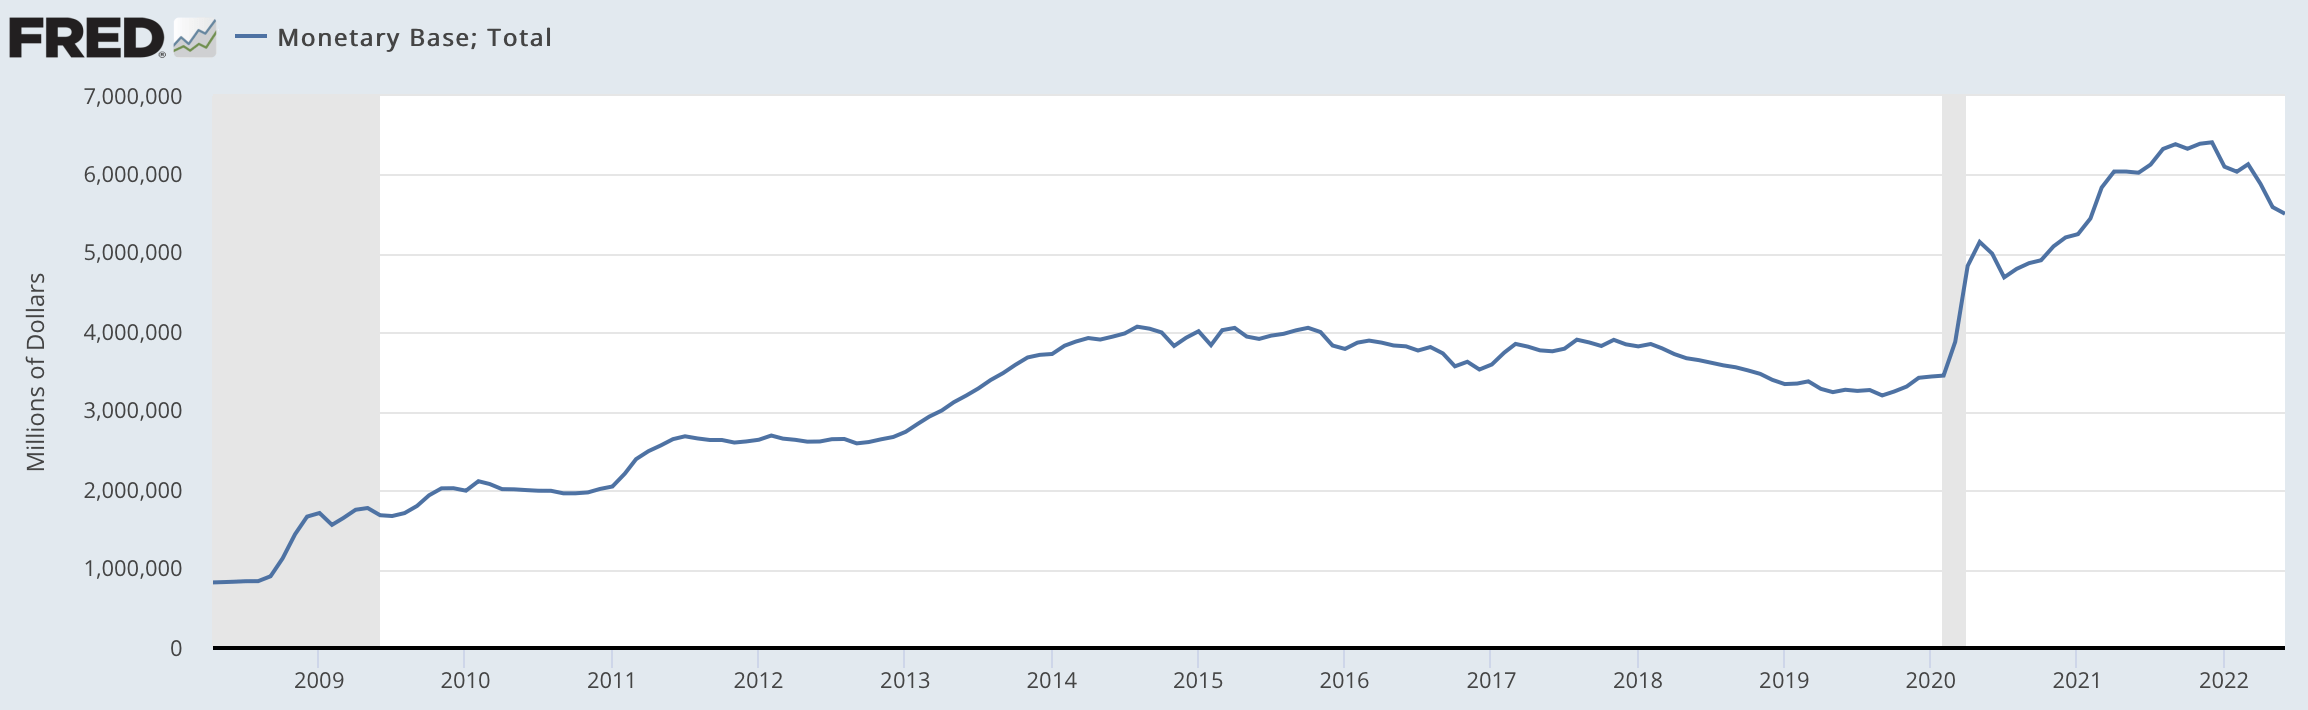
The monetary base chart is very similar to the Fed's balance sheet. As the Fed purchases assets, transferring them to its bloated balance sheet, the agency floods the financial system with liquidity increasing the monetary base. The monetary base has increased by approximately 550% since 2008. We've seen a slight reduction since the Fed began tightening financial conditions. However, the downturn in the expansion of the monetary base is not likely to last.
Under relatively normal market conditions, the monetary base had increased by approximately 630% from 1971 to 2001 . Incidentally, gold appreciated by a similar margin, roughly 660% in the same time frame. I am using this 30-year time frame because 1971 was when the U.S. decoupled from the gold standard, and around 2001, the Fed's ultra-low interest rate policy began.
As the initial QE took off in 2008, the monetary base exploded and is now up by approximately 6.5X, or roughly 550%. Gold, on the other hand, was around $800 in 2008 and is only up by 125% since the QE experiment began. We see a direct long-term correlation between the price of gold and the monetary base's expansion. The correlation was nearly identical in the 30 years going into 2001. After this time frame, we saw gold outperform for several years, but we've seen a massive lag lately.
Gold's price underperformance relative to monetary base expansion since the QE experiments is because the market still believes that QE is transitory. Moreover, the market may feel that inflation is temporary, the Fed's balance sheet will decrease substantially, the massive debt burden is sustainable and economic conditions will eventually revert to how they were decades ago. However, QE is now part of the new economic reality. Furthermore, high inflation may be the new normal, and Fed is not likely to meaningfully decrease its balance sheet. Also, the massive national debt load is not going away.
Therefore, the market is probably well behind the curve on gold here. That is why earnings estimates for most gold miners are low for future years, as they are modeled using stagnant and often falling gold prices. There's been much voting lately, and many market participants are voting "no" to gold. Nevertheless, as Benjamin Graham said, the market is a weighing machine in the long run, and the price of gold will probably move much higher once the weighing begins. Once we apply a similar 550% (monetary base expansion) appreciation to gold's price of around $800 in 2008, we arrive at a gold price target of approximately $5,000. This mark is the level gold could reach within the next several years, providing significant upside potential for gold investors and even more upside potential for market participants buying quality gold mining shares.
Top Gold Miners to Own Here
Newmont Corporation ( NEM )
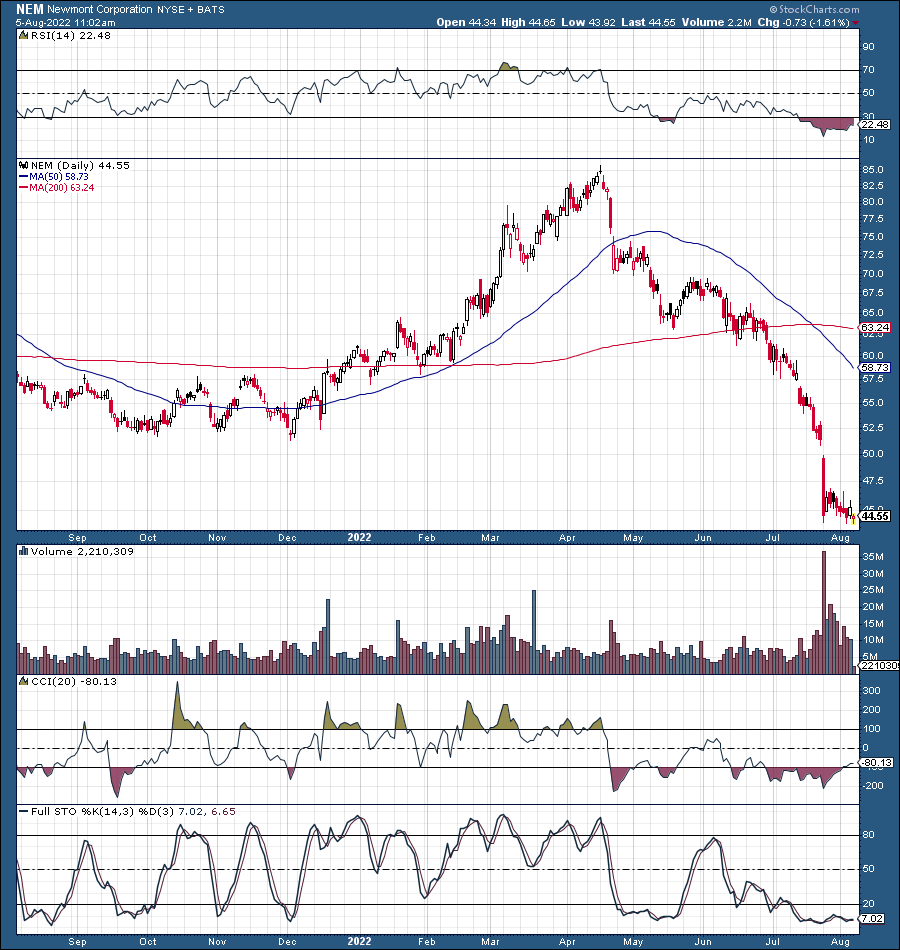
Newmont dropped like a rock after gold failed to make a new ATH in April. Shares collapsed by almost 50% in under four months. You would think that the most significant gold miner in the world was going out of business. Yet, no, we witnessed panic selling as gold went through a textbook correction of approximately 20%. Also, Newmont recently reported earnings, missing slightly on EPS but reporting an AISC of $1,150 per ounce .
Revenue was a slight beat, but YoY was essentially flat. Newmont should make considerably more income if gold advances higher, and the stock price looks exceptionally cheap right now. Analysts expect EPS of around $2.60 this year, putting Newmont's P/E ratio at about 17. However, most future EPS and revenue estimates are modeled using relatively low gold prices, and there is a high probability that NEM will outperform as we advance. Therefore, we could see a significant move higher in the stock in future years, and my year-end price target for NEM is $65, with the stock continuing higher after that. NEM pays a dividend of nearly 5% to boot right now.
Barrick Gold Corp ( GOLD )
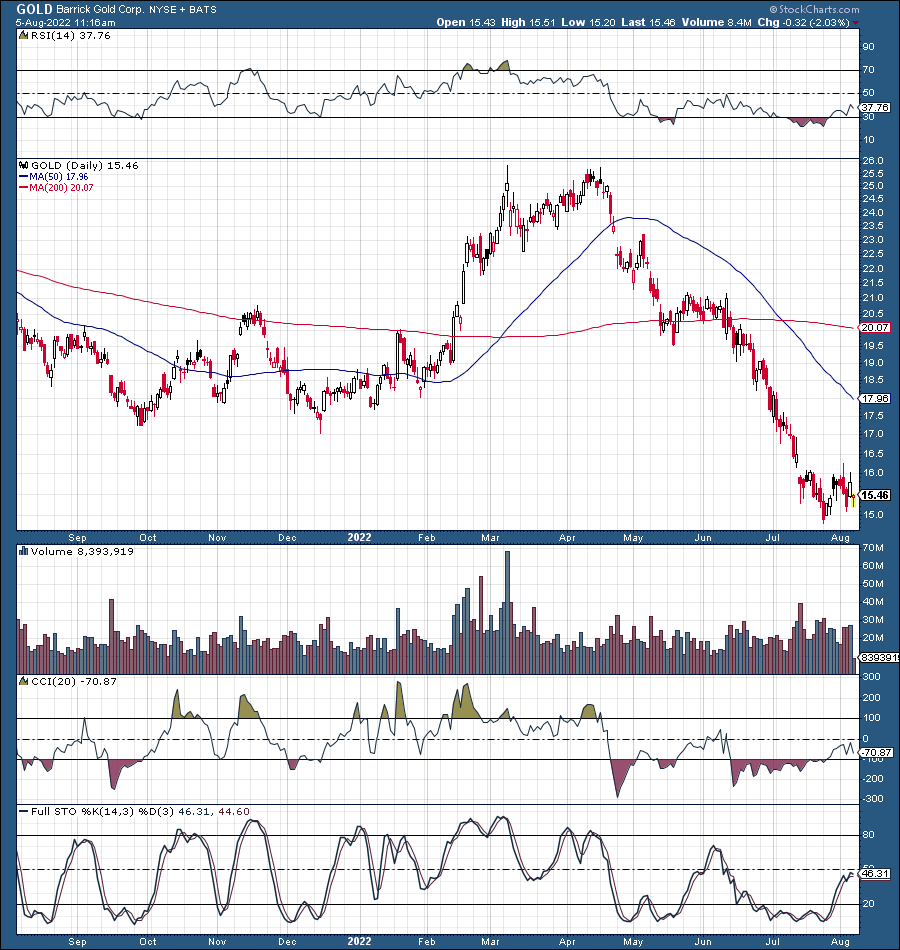
Barrick, the second biggest gold miner in the world, dropped by 36% during the recent decline. This stock also became drastically oversold and appears deeply undervalued now. Barrick trades at approximately 15 times EPS, and it will likely outperform significantly if gold moves higher as we advance. Barrick also pays a dividend of roughly 2.4%, and my year-end price target range for the stock is $20-25. Barrick is announcing earnings results on Monday, August 8th , before the market opens.
Agnico Eagle Mines ( AEM )
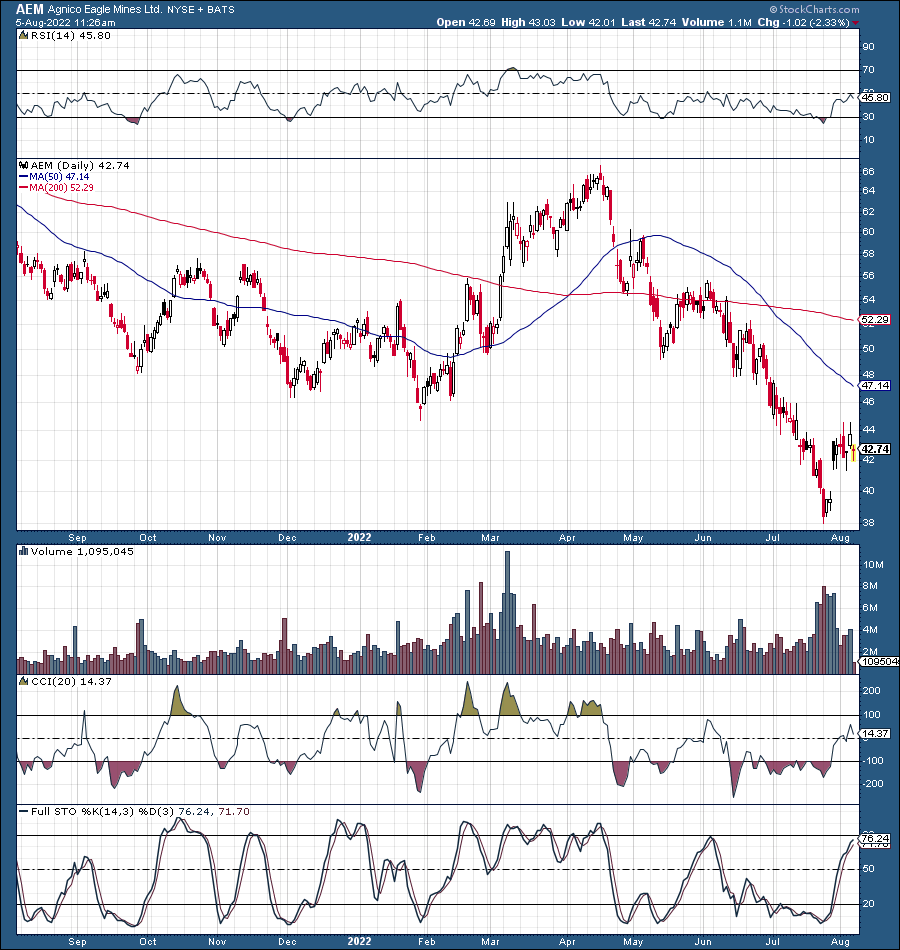
Agnico Eagle came out with a split earnings report , beating on revenues but missing on EPS slightly. Still, the company reported GAAP EPS of $0.60 for the second quarter and should provide EPS of roughly $2.44 (consensus estimate) for the full year. This projection puts the company's P/E ratio at approximately 17 times 2022's earnings expectations, and the stock offers a 3.4%. Like many gold miners, most analysts predict lower profits for Agnico Eagle as future forecasts are predicated on stagnant or lower gold prices. Therefore, Agnico Eagle's stock should outperform significantly as gold moves to new highs in the coming years. My year-end price target range for AEM is $55-60.
Other gold miners in my portfolio or on my buy list include Alamos Gold ( AGI ), Kinross Gold ( KGC ), Yamana Gold ( AUY ), and others.
For further details see:
Gold: A No-Brainer