GVA - Granite Construction: Cheap Multiples Mid And Long-Term Economics Not Supportive
2023-10-27 18:00:00 ET
Summary
- Granite Construction's short-term investment outlook is supported by compressed multiples and a relative discount to the sector.
- This ends when factoring in the company's economic characteristics, even with FY'24 projected to show high earnings growth.
- Flat business returns and negligible FCF/share growth also feed into this view, and GVA has a large hurdle to overcome to change the market's expectations and prove it wrong.
Investment brief
Following a sharp selloff in H2 FY'23, Granite Construction Incorporated ( GVA ) came onto our radar as a potentially cheap company with exposure to listed infrastructure-a sector that has shown promise in the current market.
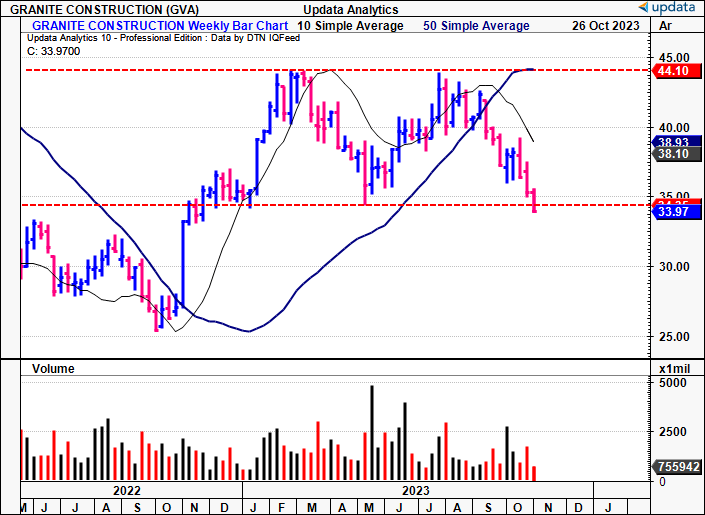
Working through the layers however it appears there are multiple hurdles to still overcome to catch a buy rating. The company's economic drivers are sensitive to external factors like GDP and public funding, technical setups are neutral at best, and valuations, whilst cheap, maybe justifiably so. As such GVA has tried to break a key resistance level at $44 3x in the last 24 months with no success, and now trades below both 200DMA and 50DMA's.
The company's Q3 earnings are just around the corner and this report will analyze the critical data needed to make an informed decision on the company, whilst benchmarking what it needs to do in order to prove the market wrong.
Recommendations heading into Q3 earnings, based on investment horizon:
- Short-term (coming 12 months): Supported by compressed multiples, relative discount to sector,
- Mid-term (1-3 years): Sales growth flat, potential support from earnings growth, but growth concentrated in FY'24,
- Long-term (3 years+): Not supported, flat business returns on capital deployed, negligible FCF/share growth.
The major risk is that GVA comes in with an overly weak set of numbers. Should this occur, the scope for a further selloff is warranted, and the probability of returning to its previous highs is reduced, in the short-term at least. The opposite is true with an upside surprise. Net-net, I rate GVA a hold for the factors raised here today.
Figure 1. Tried to break the $44 level 3x in the last 24-months (only 2 instances are shown here); unable to do so. Now cracked support in range shown, trading below 50DMA and 200DMA.
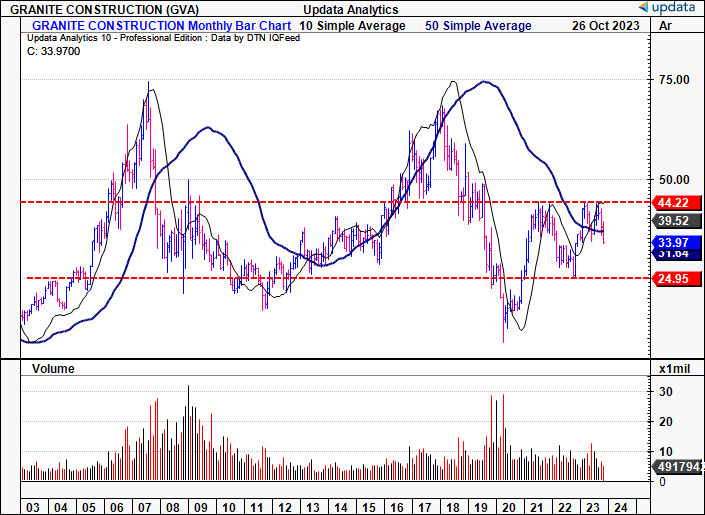
Figure 1a. GVA monthly returns, 2003-date
Critical facts pattern forming the basis of hold rating
1. Macro backdrop
GVA's economic drivers of value include:
(i). U.S. economic growth, inc. labour accessibility + supply,
(ii). Government funding at all levels-c.65% of all its workflow,
(iii). Population growth trends (as these drive public/private development),
(iv). Replacement needs, which are impacted by replacement costs (inflation),
(v). Commodity markets, including pricing along the curve in key sectors.
In that vein, GVA's business (and, therefore, investment outlook) is highly sensitive to the economic performance of the U.S.
Three major factors are therefore relevant in the discussion on GVA's macroeconomic backdrop.
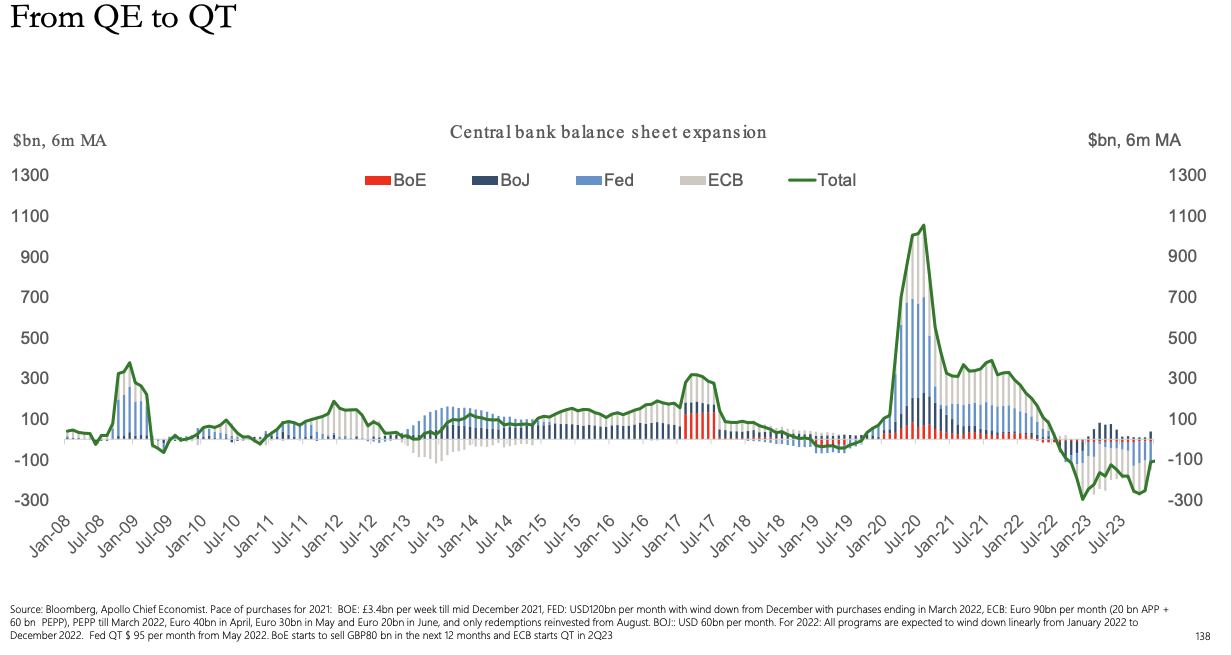
Firstly, the Fed, along with its global counterparts, has undeniably switched to reducing its balance sheet, putting a halt to the years of balance sheet expansion started post-GFC. Apollo Management notes the Fed has wound its balance sheet down by $95Bn per month since its QT cycle began in full from May '22.
Figure 2.
Source: Apollo Global Management
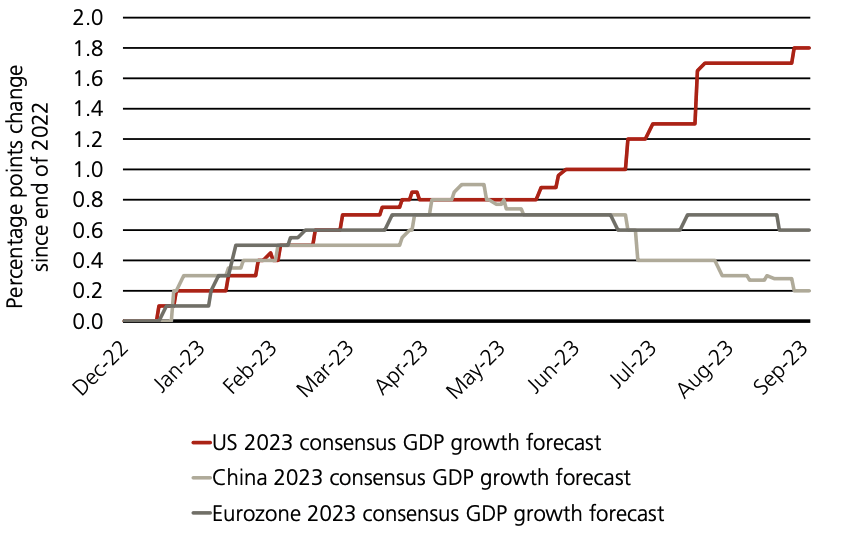
Meanwhile, UBS Asset Management notes the persistent revisions in U.S. GDP consensus forecasts, now 1.8% higher than December '22 as of September '23. This is a potential tailwind.
Figure 3.
In a separate note from '22, UBS also notes revenues from listed infrastructure has increased across all sectors bar airports since 2020, and projects sustained growth out to '24.
Figure 4.
Source: UBS Asset Management
GVA is also constructive on its outlook into the coming 12-24 months. It notes the Infrastructure Investment and Jobs Act ("IIJA") is still ongoing, representing a $1.2 Trillion program for federal highway, bridge and transit funding. The DoT released ~$60Bn of this in FY'23 to all 50 states which can be put to work straight away. Per its last filing:
We continue to believe that the increased multi-year spending commitment will improve the programming visibility for state and local governments. We are seeing projects funded by the IIJA for bid and believe there will be an increase in project lettings throughout 2023 and then more meaningfully in 2024 and beyond."
The macro-view to GVA's investment case is balanced based on each of these factors.
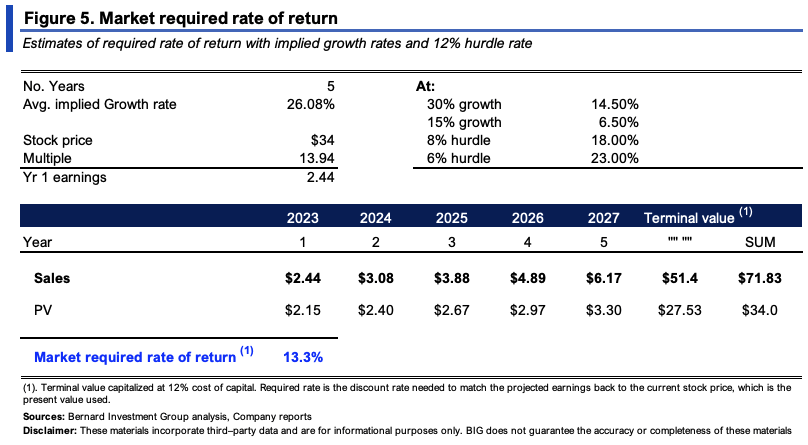
2. Price implied expectations
Perhaps the most important to a potential change in embedded expectations and therefore upside change is what's already priced into GVA's market value.
Trading at a market cap of $1.5Bn and an EV of $1.61Bn, the market implies the following:
- Forward earnings growth of ~5.5% to $2.44/share at 13.95x forward earnings, 62% YoY growth in pre-tax income to $129mm at 12.4x forward EBIT, and $3.35Bn in sales.
- It is priced at 1.22x EV/invested capital-low market value on GVA's investments-indicating the market expects a 2.9% ROIC, behind its TTM ROIC of 3.5% (1/(1.22x3.5%) = 2.9%), and a reinvestment rate of just 5% of pre-tax income, or $7.8mm. It would compound its intrinsic value by 0.14% under this implication.
- For the perceived risk, investors are commanding a 13% rate of return, ranging from 6.5%-23% under various scenarios shown in Figure 2.
GVA needs to outpace these embedded expectations at its next set of numbers in order to change the market's view, and see it discount the company's future performance to a higher level.
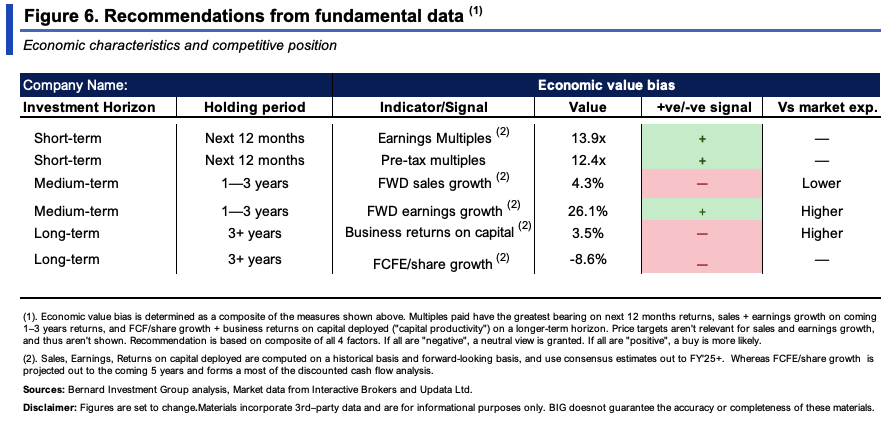
3. Investment bias from economic value
A buy rating is not well supported across mid to long-term investment horizons. There may be support for investors to catch GVA's shares cheaply at its current levels, not without a firm catalyst, though.
To illustrate:
(1). Short-term : earnings multiples are at a discount of ~13-15% to the sector but below the company's 5-year range. Coming 12-month returns could benefit from these discounts, but not without the presence of a catalyst.
(2). Medium-term : factors are balanced as well. Projected sales growth is low and behind market consensus, but projected earnings growth from FY'23-'25 is at ~26%, with 70% projected by Wall St. in FY'24. This could be remarkable.
(3). Long-term : unsupported, with return on capital deployed and FCF/share growth behind what's required to compound shareholder wealth.
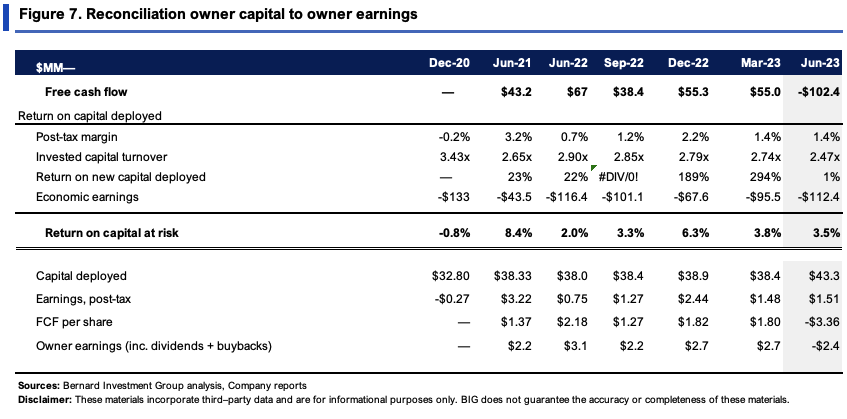
Most critically, the firm's business returns do not support long-term economic results. It routinely recognizes 1-2% post-tax margins, but turns over capital 2.5-3x, which isn't enough to overcome the marginal hurdles. It carries ~$460mm in debt which may be used strategically. Still, FCF/share growth is lumpy and dividend yields at 1.5% don't balance this lack of economic value.
These factors support a neutral view.
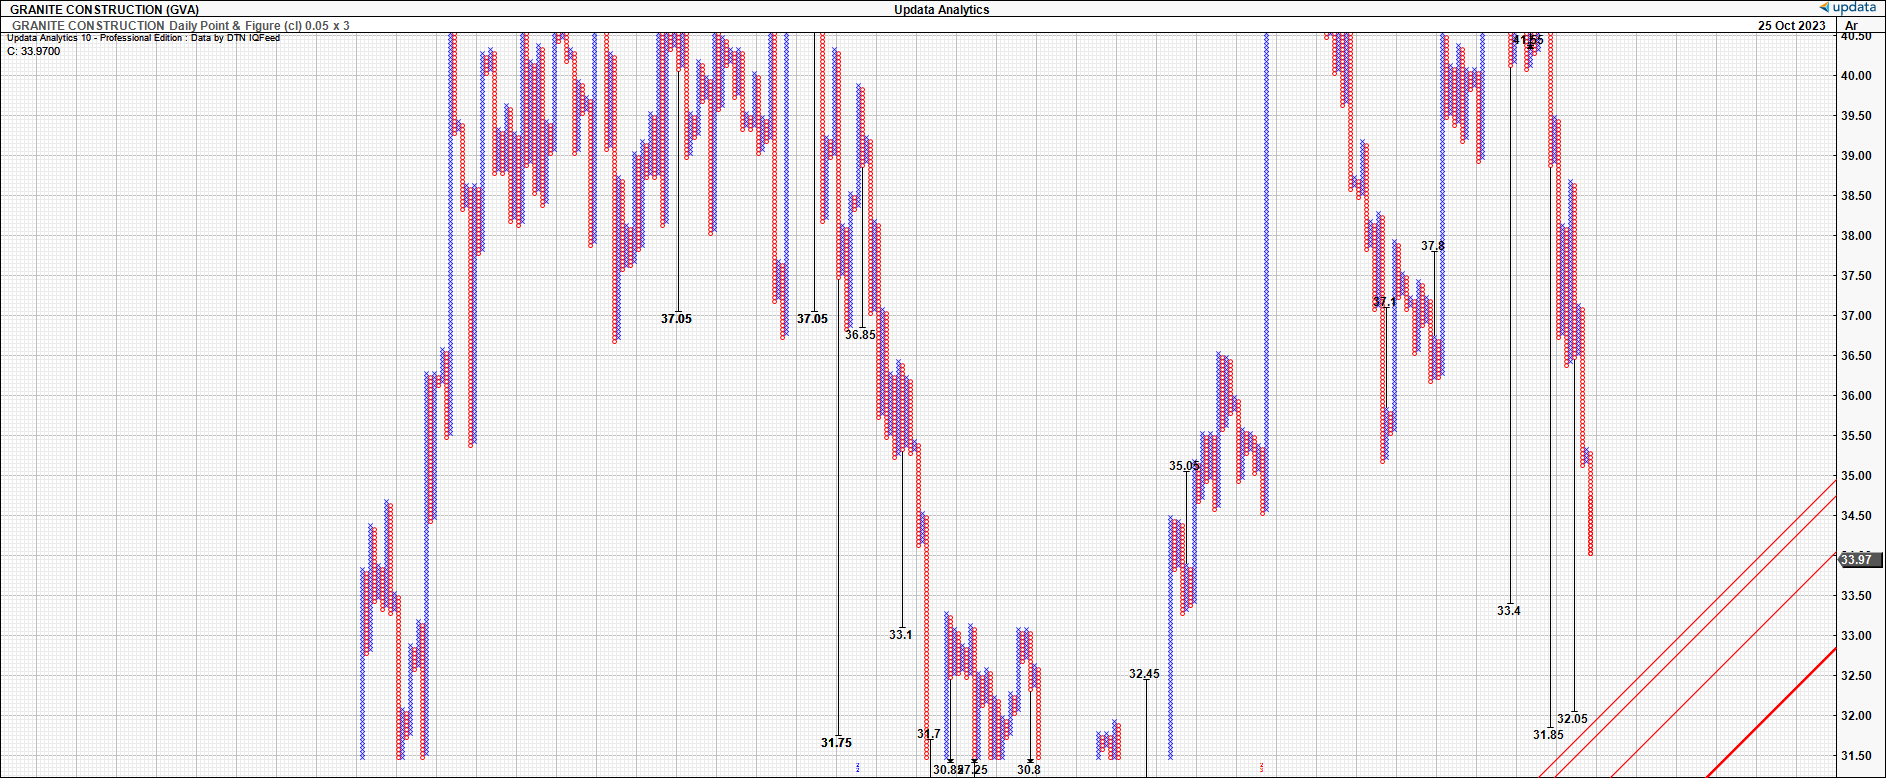
Technical positioning into Q3 earnings
The following insights are absolutely crucial to gauging where the market is headed into GVA's upcoming numbers.
Importantly, it has just left a pocket of high usage where traders filled the upper distribution shown below. Markets tend to move from pockets of high usage to low usage, so I would not be surprised to see the low usage area shown complete its distribution and fill the entire range.
Fig. 8
Data: Updata
There is a wide positive skew on the distribution, supporting the notion for continued incremental losses with snapback rallies along the way. There is evidence to suggest investors prefer positive skew, but the economics of GVA's business don't support the notion for a large reversal just yet.
Fig. 9
Data: Updata
The next objective targets eyed by the point and figure studies are to the $31 level, thus supporting the notion above, and this is critical for two reasons:
- One, bad news happens in downtrends-get used to it,
- Two, investors don't appear confident on the company's Q3 numbers.
Contrarians must therefore be aware of these points.
Fig. 10
Critical trend + directional insights include the following:
The 60-minute chart (short-term) looks to the coming days, and is therefore critical heading into GVA's earnings-
- There are 3 key levels from (i)-(iii). Points (i) and (ii) are two gaps down that haven't been retaken, despite two congestive periods afterward.
- Point (iii) was nearly tested on the 23rd but hasn't been met, seeing a continuation of the longer-term downtrend.
- At point (iv) we have two continuation patterns where former highs were rejected. We are therefore negatively positioned heading into its Q3 numbers.
Fig. 11
Data: Updata
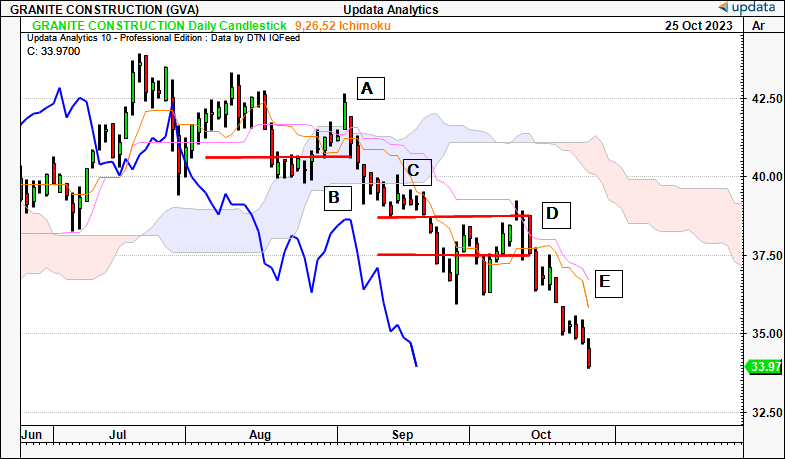
Daily cloud chart, looking to coming weeks-
- We start at point A in the roll into September, large evening star formation hinting at the bearish reversal.
- This saw us cross into the cloud and break a key level from prior months. A large bearish hammer drove price and lagging lines beneath the cloud at point B.
- Point C saw another shooting star reject a test back into the cloud-this was a strong negative signal.
- Despite an attempt to reclaim this level in October, point D saw another evening star with a subsequent doji + bearish engulfing candle, with the bearish candle taking out the previous 3-day range. The next bearish candle wiped out the entire range from mid-September.
- Point E we saw another gap down with this level yet to be retaken.
Fig. 12
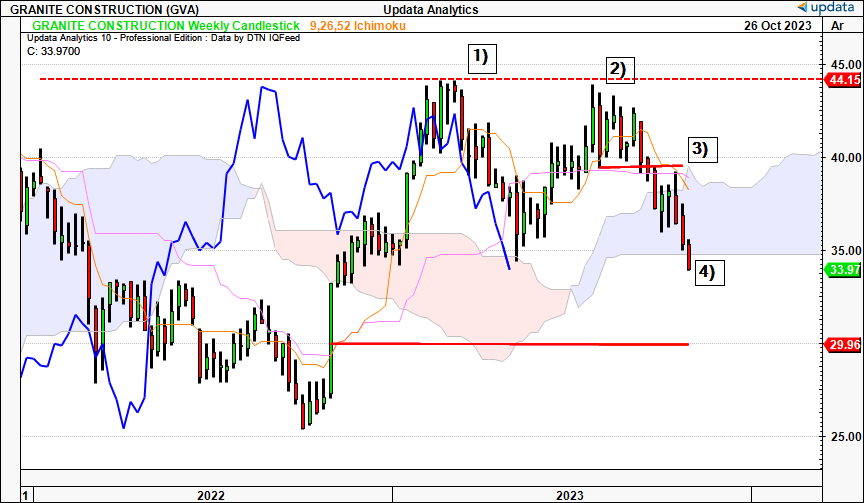
Weekly chart, looking to the coming months:
- This is critical to gauge post-earnings drift. You can see it tested and rejected the levels at 1) and 2), with the 2nd rejection exhibiting the downside charge to yearly lows.
- We broke the cloud at point 3) after new lows were set.
- At point 4) we've now broken the base of the cloud, a risk for long-term price action.
Fig. 12a
Valuation and conclusion
GVA is trading at a relative discount to peers at ~13.9x forward earnings and 12.4x forward EBIT, as mentioned earlier. I also noted there is scope for these numbers to catch a bid towards the sector median-not without a catalyst though. This is why its upcoming Q3 numbers are so critical to the short-term thesis.
Over the mid to long-term, it's the company's economics and competitive position that I see difficulties with regarding GVA's valuation. We employ a 12% threshold margin on business returns for all current and prospective equity holdings, reflecting the opportunity cost at long-term market averages. Tracking its post-tax earnings from 2020 on a rolling TTM basis, then comparing its ROICs to the 12% hurdle, the company has produced a series of economic losses in this time, amounting to ~$1Bn. GVA's profits produced on capital employed are therefore not economically valuable to us. Hence, I can't advocate buying the company for a long-term view either.
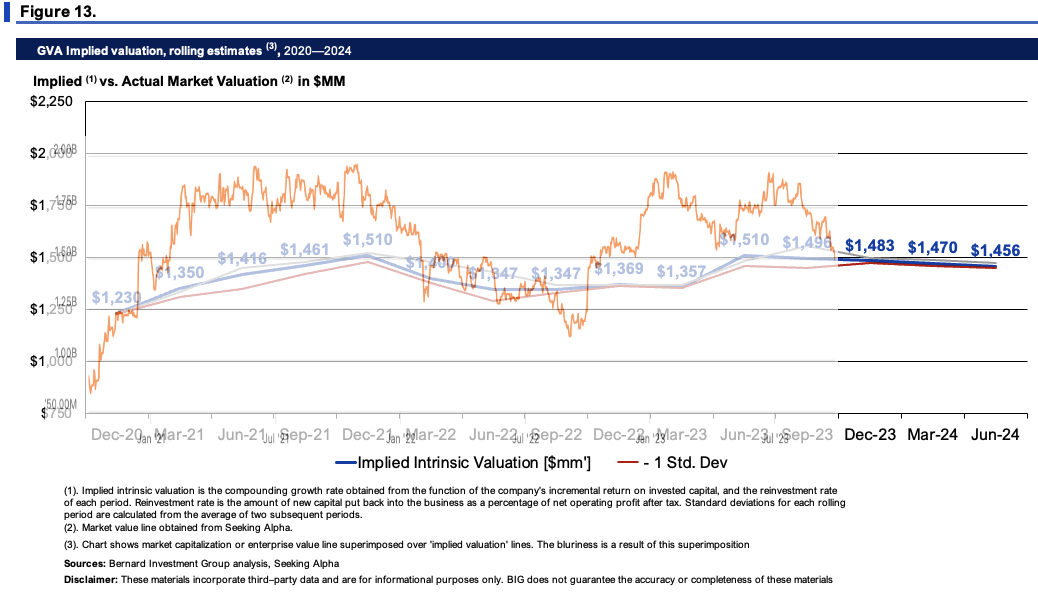
Finally, the questions are: 1) is there a reason to see things differently from the market's expectations, outlined earlier? and 2) if so, what would cause this?
For 1), my estimation is no. The market looks to have been an accurate judge of GVA's implied intrinsic value, measured at the compounding function of its ROIC and reinvestment rates, as seen in Figure 13. Even with periods of excessive value, GVA's equity line has always reverted back to fair value. For 2), it would definitely be a major surprise for its Q3 numbers. However, you're almost gambling by speculating on this to occur. To me it's 50/50 probability-it either does, or it doesn't. At which magnitude, either way, I dare not speculate. As such, my numbers tell me GVA is currently valued fairly at ~$1.4-$1.5Bn market value heading into Q3 earnings.
In short, the market has set a moderate hurdle for GVA to surpass heading into its Q3 numbers. Even with recent downsides in market value, the expectations are for it to continue earnings growth in FY'23. Key upside surprise-undoubtedly if it beats consensus and internal guidance at the top and bottom lines when it reports. This may change the near to mid-term picture. Otherwise, my estimate is the market has got GVA priced around fair value, and that a hold rating is warranted at these levels.
For further details see:
Granite Construction: Cheap Multiples, Mid And Long-Term Economics Not Supportive