PG - Hershey: Durable Business Stretched Valuation
2023-06-24 04:55:34 ET
Summary
- Hershey has a strong track record of dividend growth and has generated significant shareholder value over the years.
- The company is currently overvalued by about 15-20%, making it a 'hold' for now, but a pullback in the stock could present a buying opportunity.
- Hershey faces operational risks such as commodity price fluctuations, international economic exposure, and managing its balance sheet.
The Hershey Company ( HSY ) has been making and distributing candy and staple food items in the U.S. and around the world since founded in 1894. The company has paid 373 consecutive dividends to its common shareholders, including the most recent announced in April. In recent decades the company has raised the dividend almost every year, 2009 being an exception. Some years shareholders received special dividends, but excluding those, the track record of year-over-year dividend growth is intact back to 1976. Like many of its consumer staple sector peers, the company has been resilient, generating growth in a variety of economic environments and delivering shareholder value. Also, like many of its consumer staple sector peers, the valuation for Hershey appears to be rich, which is why I consider it a ‘Hold’ at this time .
Like with other staples companies including Coca-Cola ( KO ) and P&G ( PG ), Hershey has a global footprint and executes across its product lines and geographic zones efficiently, driven by expert supply chain management and operational strategies. In its most recent quarter ended April 2, 2023, Hershey experienced strong growth of revenue and net income. For the quarter, revenue increased 12.1% year-over-year while net income rose 10.9%. Given its global footprint, the company must manage its foreign exchange exposure. In the first quarter it did well in this task with foreign exchange effects shaving only 0.1% from revenue growth.
As of year-end 2022, Hershey was the number one producer of candy in the U.S. and number two in overall snack foods. The company manages a wide range of products and brands sold globally. The fastest growth is currently in the sale of salty snacks in North America. This growth has been bolstered by the company’s acquisition strategy that added Skinny Pop (purchased parent company Amplify in 2017 – largest acquisition by Hershey), Pirate’s Booty (acquired 2018), and Dot’s Homestyle Pretzels (acquired 2021) to the portfolio. International sales have grown nearly as fast as North American salty snacks at 19% year-over-year during the last quarter, driven by organic growth.
The company actively manages its product portfolio through both acquisitions and divestitures. Over the last 60 years, the company has transacted more than 80 acquisitions and divestitures of brands, brand portfolios, and related companies.
Recent Performance
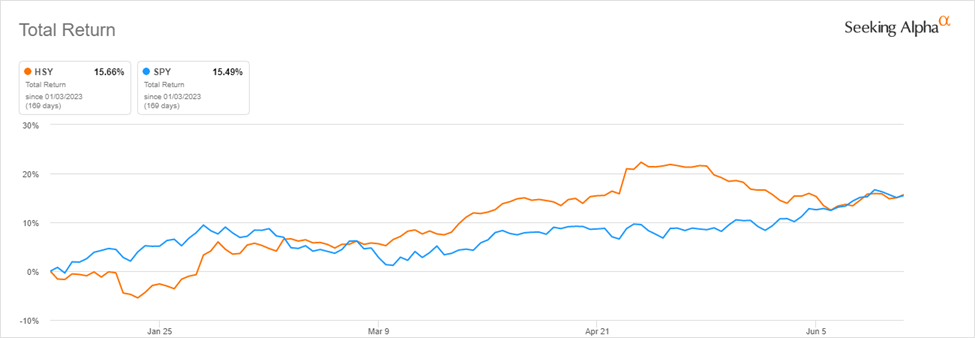
The stock is higher by about 15.7% year-to-date on a total return basis, in-line with the S&P 500. The trailing 1-year total return is just over 23% compared to 18.50% for the S&P 500. Hershey is currently trading around $260, or about 6% below its 52-week high reached in May of this year. At this price, valuation has outstripped fundamentals, making the stock a ‘hold’ for the time being.
Long-Term Performance
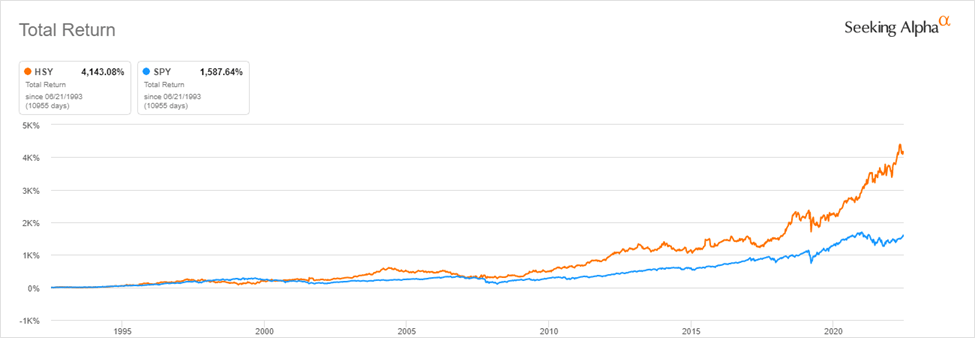
Like with Coca-Cola, P&G, Johnson & Johnson ( JNJ ) and others, I am attracted to the consistent compounded growth over the course of decades. I enjoy looking at 30+ year returns for these large consumer staples companies. In many instances looking at past performance, around a holding period length of 30 years the original investment has grown by a factor similar in magnitude to that number on a total return basis. In Hershey’s case, if an investor purchased the stock in June 1993, held it until today and reinvested the dividends, that position would be worth a little more than 42x the original investment. For context, an investment in the S&P 500 would be worth about 17x the original investment over that same period. The dividend, and its growth, result in more than 50% of the ending value of the investment over that 30-year period.
Valuation
I view Hershey as a ‘hold’ at the current price. Compared to its own historical valuation, the stock is about 10-15% overvalued. Not a cause for worry, but a little too stretched to make a compelling ‘buy’ case. That said, I also don’t see any urgency for existing shareholders to exit the stock. The company is well run and operating efficiently, and there is no reason to believe that will change.
| Valuation Metric |
| HSY |
| HSY 5-Year Average |
| % Difference to 5-Year Average |
| P/E GAAP ((FWD)) |
| 28.01 |
| 24.85 |
| 12.73% |
| EV/Sales ((FWD)) |
| 5.09 |
| 4.35 |
| 17.06% |
| EV/EBITDA ((FWD)) |
| 18.76 |
| 16.99 |
| 10.42% |
| EV/EBIT ((FWD)) |
| 21.56 |
| 19.77 |
| 9.06% |
| Price/Cash Flow ((TTM)) |
| 21.81 |
| 18.11 |
| 20.43% |
| Price/Book ((FWD)) |
| 14.04 |
| 15.99 |
| -12.21% |
Valuation Versus Peers
Comparing Hershey’s valuation to that of other packaged food companies we see that the valuation is stretched there as well. Across 5 of the 6 metrics listed in the table below, Hershey’s valuation is higher than the five companies shown. The stock is trading at the largest premiums compared to the next highest for Price/Book and EV/Sales. In combining the historical valuation and peer analysis, I estimate that the stock is 15-20% overvalued .
| Valuation Metric |
| HSY |
| General Mills ( GIS ) |
| Kraft Heinz ( KHC ) |
| Nestle ( NSRGY ) |
| Mondelez ( MDLZ ) |
| Kellogg ( K ) |
| P/E GAAP ((FWD)) |
| 28.01 |
| 18.93 |
| 12.50 |
| 20.55 |
| 21.46 |
| 16.97 |
| EV/Sales ((FWD)) |
| 5.09 |
| 2.92 |
| 2.34 |
| 3.47 |
| 3.61 |
| 1.85 |
| EV/EBITDA ((FWD)) |
| 18.76 |
| 14.69 |
| 10.21 |
| 16.30 |
| 17.46 |
| 11.81 |
| EV/EBIT ((FWD)) |
| 21.56 |
| 17.19 |
| 12.22 |
| 20.19 |
| 21.25 |
| 14.76 |
| Price/Cash Flow ((TTM)) |
| 21.81 |
| 15.34 |
| 17.93 |
| 25.08 |
| 25.54 |
| 13.98 |
| Price/Book ((FWD)) |
| 14.04 |
| 4.70 |
| 0.88 |
| 6.99 |
| 3.53 |
| 4.72 |
Dividend
The company’s dividend track record is solid, demonstrating a commitment to generating shareholder value and returning a substantial portion of that value through dividends.
Coverage for the dividend is sufficient and in-line with historical averages. Interest coverage is above trend while Total Debt/Capital has declined relative to the 5-year average. The interest coverage will be important to watch as the company has recently rolled over debt due in 2023 with new debt at higher interest rates.
Dividend growth has been strong for decades but has accelerated in recent years as shown by the 14.31% 1-year increase and 5-year CAGR above the multi-year average.
| Dividend Growth or Coverage Metric |
| HSY |
| HSY 5-Year Average |
| % Difference to 5-Year Average |
| Cash Dividend Payout Ratio ((TTM)) |
| 42.80% |
| 44.21% |
| -3.19% |
| Interest Coverage ((TTM)) |
| 15.91 |
| 13.28 |
| 19.83% |
| Total Debt/Capital ((TTM)) |
| 59.23% |
| 70.21% |
| -15.64% |
| Dividend Growth Rate 5Y ((CAGR)) |
| 9.57% |
| 8.25% |
| 15.99% |
| 1 Year Dividend Growth Rate ((TTM)) |
| 14.31% |
| 8.29% |
| 72.67% |
Profitability
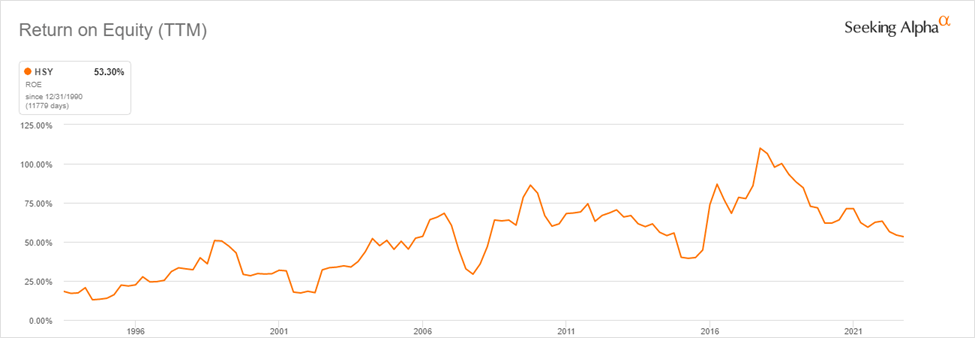
Like the safety and growth of the dividend, Hershey’s profitability remains solid and in-line with multi-year averages. The one metric that grabs attention is the ROE, which is almost 28% below the 5-year average but remains strong at over 53%. While the trend in ROE has been mostly negative since April 2018, the longer-term trend is positive. This is an area to keep an eye on in the future as a continued decline in ROE may become a cause for concern.
| Profitability Metric |
| HSY |
| HSY 5-Year Average |
| % Difference to 5-Year Average |
| Gross Profit Margin ((TTM)) |
| 43.17% |
| 45.10% |
| -4.29% |
| Net Income Margin ((TTM)) |
| 15.81% |
| 15.32% |
| 3.23% |
| Return on Common Equity ((TTM)) |
| 53.30% |
| 73.67% |
| -27.66% |
| Return on Total Assets ((TTM)) |
| 15.29% |
| 14.41% |
| 6.09% |
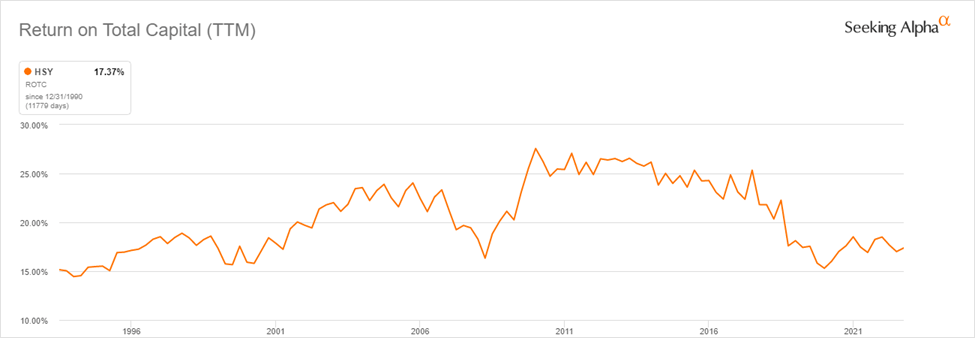
| Return on Total Capital ((TTM)) |
| 17.37% |
| 17.90% |
| -2.94% |
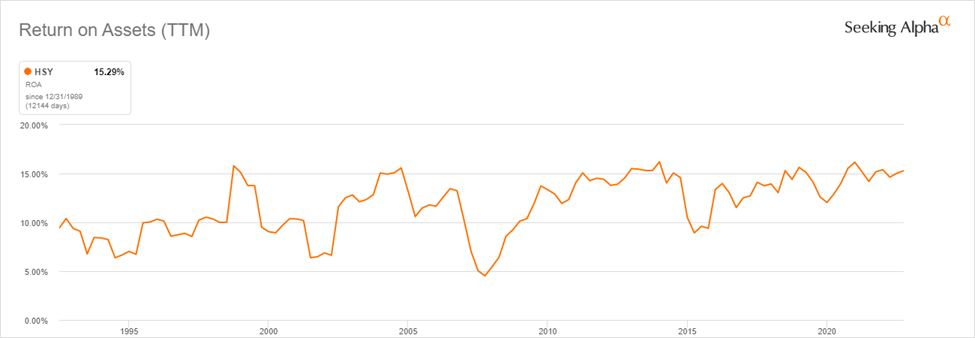
The three charts below illustrate the long-term trends in Hershey’s ability to generate returns on equity, assets, and capital. ROA is the most consistent, exhibiting an upward trajectory with the least volatility. As mentioned above, the long-term trend in ROE is upward, but since April 2018, it has been sliding and should be watched. Similarly, the return on total capital has been more volatile. It reached a peak in July 2010 and slowly declined between then and June 2020 when it troughed during the pandemic. Over the last two years, the return on total capital has been rebounding, but like ROE, should be monitored to ensure it is trending higher as this will have a direct impact on future growth and profitability.
Outlook
For the full-year 2023, revenue is expected to grow about 8%, with reported EPS growth of 15%, 11% adjusted for nonrecurring items. Hershey also expects to spend $800-$900 million in capital expenditures for the year to expand productive capacity for its core candy business and on upgrading its enterprise resource planning infrastructure.
While the fundamentals of the business remain strong, the valuation is currently extended. Because of this, I view Hershey as a ‘hold’. I will continue to reinvest the dividend but will not add to the position beyond that for now. However, an economic slowdown, recession, or broad market sell-off resulting in a pullback in the stock will be a buying opportunity.
As mentioned above while examining the historical and peer valuations, I estimate that the stock is overvalued by about 15-20%. Based on that estimate and the current price, I will add to my position when the stock trades below $220/share .
Risks
Hershey faces numerous operational risks due to its dependence on certain inputs and suppliers, as well as its international economic exposure.
Commodity prices play a major role in Hershey’s business. In particular, Hershey has direct exposure to the prices of cocoa and sugar. Cocoa prices have been rising steadily since 2001 with that incline accelerating in the last year. The trajectory for sugar prices has been similar. Most of this impact can be mitigated through higher wholesale and retail prices combined with hedging as necessary. What is more difficult to hedge is the fact that 70% of the world’s supply of cocoa comes from West Africa. Ivory Coast is largest cocoa producer, followed by Ghana, Nigeria, Ecuador, and Cameroon. This creates the possibility of supply risks due to shipping and geopolitical issues or any civil unrest or economic disruptions in those markets.
As the company sources inputs and sells finished products internationally, it is exposed to fluctuating exchange rates . This can create either a headwind or tailwind, and in some cases, these effects will partially offset each other. For example, in the most recent quarter, revenue growth was reduced by 0.1% as the U.S. dollar strengthened slightly against other currencies in which the company transacts.
Hershey uses wholesale distributors as the primary channel to reach consumers who purchase the products at grocery stores, convenience stores, drug stores like CVS (CVS), wholesale clubs, and importantly Walmart (WMT). For the full year 2022, 28% of Hershey’s sales were made to McLane Company, Inc., one of the largest wholesale distributors in the U.S. This relationship is critical to the continued growth and profitability of the company, and any disruption would cause material damage to Hershey.
There is meaningful risk in managing the company’s balance sheet . In May, the company issued $350 million of 4.250% notes due 2028 and $400 million 4.5% notes due 2033. These new notes will be used to repay balances on outstanding debt due this year. The new bonds have rates 0.90%-1.90% higher than those being repaid. The course of interest rates and the company’s ability to borrow as needed will have a direct impact on profitability as well as dividend coverage and growth.
Final Thoughts
Hershey is a legendary American company that has brought sweets, snacks, and smiles to people for nearly 130 years. In doing so, the company has generated significant shareholder value, particularly for those who are patient. Hershey’s stock performance as measured over decades is a clear demonstration that patience can, and often does, pay off. Shareholders have multiplied their initial investment by more than 40x over the last 30 years on a total return basis. The importance of Hershey’s dividends and dividend growth over that time, like so many consumer staples companies, plays a significant role in long-term total returns. For Hershey, reinvesting dividends has contributed more than half to total returns over the last 30 years.
While performance in the short term is unpredictable and can be volatile at times, long-term performance better tracks the ability of the company to increase the value of the business and its stock. In Hershey’s case, the business is currently operating at or near its most efficient. However, the stock's valuation has outpaced the underlying fundamentals, making this a ‘hold’ for now. That said, I am confident that either the market will correct, providing an attractive entry point in the stock, or the company will grow into its valuation over time, likely over several quarters or possibly years.
Before adding to an individual position, even a high-quality company like Hershey, investors should consider the risks of this stock and how any position in it might impact long-term total returns and long-term investment objectives. Thank you for reading. I look forward to seeing your feedback and comments below.
For further details see:
Hershey: Durable Business, Stretched Valuation