PCH - Horizon Kinetics Q1 2023 Commentary
2023-05-04 06:45:00 ET
Summary
- Horizon Kinetics LLC, founded in 1994, is an independently owned and operated investment adviser. With a long-term absolute return mindset, and based on first-hand research, our portfolios tend to be concentrated and avoid tracking or mimicking any benchmark or index.
- Is the regional banking crisis over, in view of the calendar of refinancing of low-vacancy office tower type loans coming?
- What about loss of the U.S. Dollar’s reserve currency status and USDs returning to the U.S. resulting in money expansion inflation?
- Gold, gold vs. bitcoin, and regulatory threats to cryptocurrencies.
- The energy sector generally, including M&A activity in the Permian Basin, and the in-process court case between Texas Pacific Land Corp. and its two dissenting Board members.
An editorial tension sometimes stalks the preparation of the Quarterly Commentary: how much time to allocate to of-the-moment questions that want just a brief response, as against how much for topics that should be addressed in more depth. One doesn’t want too much of either. For this quarter, I had in mind an exercise to highlight a certain business model that gets zero attention in the stock market, is distinct from all others, and which can be a valuable long-term component of a portfolio. If one doesn’t sometimes pause upon a topic long enough for some beyond-the-moment exploration, it doesn’t become knowledge, but just another one of those recommendations that come and go and are quickly forgotten. Unfortunately, as time management goes, this exercise became both more interesting and more voluminous than anticipated. It would suffice for the entire Commentary.
Editorial tension-wise, quite a lot of client questions were just recently sent our way, and they are quite pertinent. But, as I resist discarding or truncating the already-prepared asset class review, my choice is no choice: both constituencies will be addressed. In deference to balance in what will be a longer-than-usual review, a few of the questions will be addressed up front, and the remainder at the end, for those willing to hang on.
The first three questions are not unrelated, even if they’re about different aspects of the nation’s financial management. They are:
- Is the regional banking crisis over, in view of the calendar of refinancing of low-vacancy office tower type loans coming?
- Is anyone looking at the Taylor rule? Should Anyone?
- What about loss of the U.S. Dollar’s reserve currency status and USDs returning to the U.S. resulting in money expansion inflation?
Most of the other questions, for later, were grouped around:
- Gold, gold vs. bitcoin, and regulatory threats to cryptocurrencies.
- The energy sector generally, including M&A activity in the Permian Basin, and the in-process court case between Texas Pacific Land Corp. and its two dissenting Board members.
- There was a question about Civeo Corp.
Banking Crisis Questions
This section draws heavily from extensive work already done by my colleague Murray Stahl, who has a deep fundamental understanding of banking and monetary systems. I confess to not having studied Taylor’s Rule; I’m quite ignorant about an awful lot. I couldn’t have told you that it’s a kind of reference formula intended to assist the central bank determine how to set interest rates in response to changes in economic conditions like inflation or unemployment. It was developed in 1993, and a simplified version looks like this, though it’s been modified over time, including by former Fed Chair Ben Bernanke:
r = p + 0.5y + 0.5(p 2) + 2, where
-
- r = nominal interest rate
- p = the rate of inflation
- y = the % deviation between current real GDP and the long-term GDP trend
Many of our clients will recognize, from our copious discussions about indexes, the inevitable problem with such formulas. Although intended to forecast future events, they are typically designed by trying to mathematically explain events or circumstances that have already taken place. They statistically treat sets of historical data to determine if there are predictable relationships among them, how well a particular formulaic outcome matches past results. That can work nicely when general conditions don’t vary too greatly from the norm of the period from which the data were drawn.
An example is the Phillips curve, which college did expose me to. This statistically fitted curve came from a study of the inverse relationship between inflation and unemployment in England between 1861 and 1957. The illuminating idea was to focus on wage inflation instead of the generalized price level. The Phillips Curve was considered a groundbreaking policy-guiding formula, and was adopted by central banks around the world and Nobel Prize winning economists. It worked until it didn’t, when, during the 1970s stagflation was experienced—high levels of both inflation and unemployment. A formula derived from a statistical data set can’t change its mind or ponder ‘outside the box’ alternatives when conditions change; the statistics come from inside the box. It can’t be as reactive and complex as the system-gaming multitudes who comprise the markets.
The Federal Reserve is facing circumstances that are way, way beyond Taylor Rule territory. One of those is the recent banking crisis. It started with the March 10 th collapse of Silicon Valley Bank. SVB was the 16 th largest U.S. bank, by assets, about the size of Morgan Stanley ( MS ) and a third larger than American Express ( AXP ). The FDIC was forced to order its closure when the bank exhausted its cash resources and could no longer pay depositors seeking withdrawals. Ironically, unlike many other instances historically, it was not about credit losses. Three weeks earlier, the Forbes 2023 edition of America’s Best Banks ranked SVB the 20 th best bank, based on operating efficiency and profitability ratios. By those measures it was well managed. Irrespective of SVB’s faults, it’s important to understand that this is not an SVB-specific issue; it’s a systemic issue of the entire banking industry. But SVB can be an example of convenience.
The problem partly relates to SVB’s $91 billion of its $209 billion of assets in the held-to-maturity category of its balance sheet. These were high-credit-quality government bonds and agency debt securities (like Fannie Mae), so if held to maturity, there is little doubt they would be paid par value. They are low-coupon instruments, though. Why did the bank hold so much longer-maturity paper in the first place, which is a well-known dangerous mismatch to its short-term, on-demand source of funding – namely, deposits?
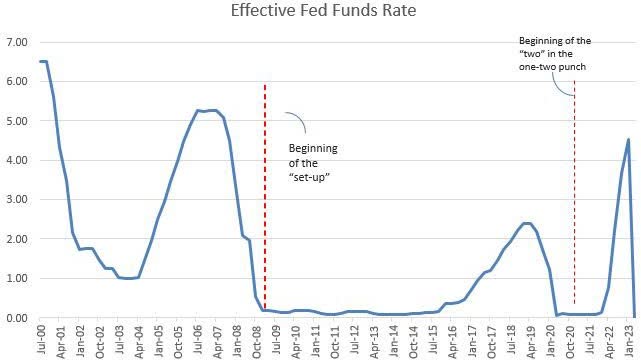
Because of the Federal Reserve. Specifically, because of the Fed’s 14-year low interest rate policy, in place since the 2008 financial crisis. Eventually, all the high-coupon instruments matured, and investors, including institutions, could only buy low-coupon debt. During the long yield famine, investors, including banks, eventually reached for yield by holding more and more long-dated paper.
Source: Factset
Then, after a decade of inflationary monetary stimulus and suddenly rising inflation figures, the Fed determined to combat the problem it had helped to create. But when it raised interest rates by many, many multiples in the space of a year—the most severe rise in history—a few consequences ensued. The most immediate was that the market value of those securities fell sharply. The iShares MBS ETF, which holds mortgage-backed securities, fell 14% in price between year-end 2021 and February 2023. That ties directly to an interrelated problem, the fractional reserve structure of the banking system.
Even banks considered to be of high quality are leveraged 10:1. For every dollar of deposits, they make about $10 of loans or investments. That is, they retain, as available for withdrawal, only a small fraction of the deposits entrusted to them for safekeeping. For a reality check, as of December, the totality of commercial banks in the U.S had $20.8 trillion of assets against only $2.1 billion of equity 1 . That being the case, if SVB’s held-to-maturity securities were 40% of total assets, and if their value dropped by 10%, that’s only a 4% hit to total assets. But a 40% hit to the bank’s capital. That alone is enough to sink a bank. That’s what 10:1 leverage does.
In one sense, the lower prices shouldn’t have mattered, because under existing rules, unlike for credit losses on loans, those high-credit-quality government securities can be carried at face value for balance sheet purposes.
But an allied, contingent problem was that if some modest fraction of the banking customers would wish to withdraw cash at a level above the day-to-day deposit/withdrawal equilibrium, the bank wouldn’t be able to pay them out. The reason is that only 10¢ of every dollar of deposits is actually there. Ordinarily, the bank would sell some liquid investments to provide funds for withdrawal. But in the environment created by the Fed, SVB would have to sell the long-term securities. In doing so, their prices would be marked to market and reported at lower balance sheet values, which would reduce stated capital. The bank would be trapped. As it happened, some of SVB’s customers were spooked or actually impacted by troubles at FTX, the so-called cryptocurrency exchange that was really just a broker acting very unfiduciary-like. When they began to withdraw funds, the SVB crisis unfolded.
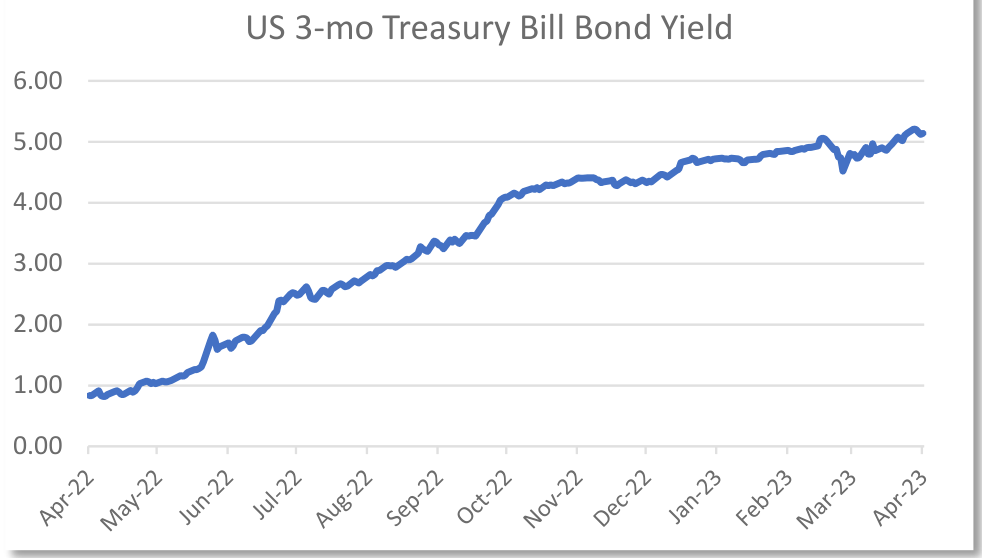
Another systemwide problem sparked by the Fed raising short-term interest rates is that it also created immediate, switchable competition for the bank’s depositors who had suffered with zero or near-zero bank interest rates. They now had ready access to 4% and 5% yields available in money market funds; bond ETFs with average maturities as short as a year; even Treasury bills that can be purchased directly from ustreasurydi rect.gov in denominations as small as $100. Better, yet, Treasury bills aren’t subject to state and local taxes, and are free of credit risk. The banks can’t offer a competitive yield, because their assets are stuck in the long-dated low-coupon securities. What would anyone do? Keep the taxable 0.4% yield, if that much, or go for the partially tax-exempt 4% or 5% yield?
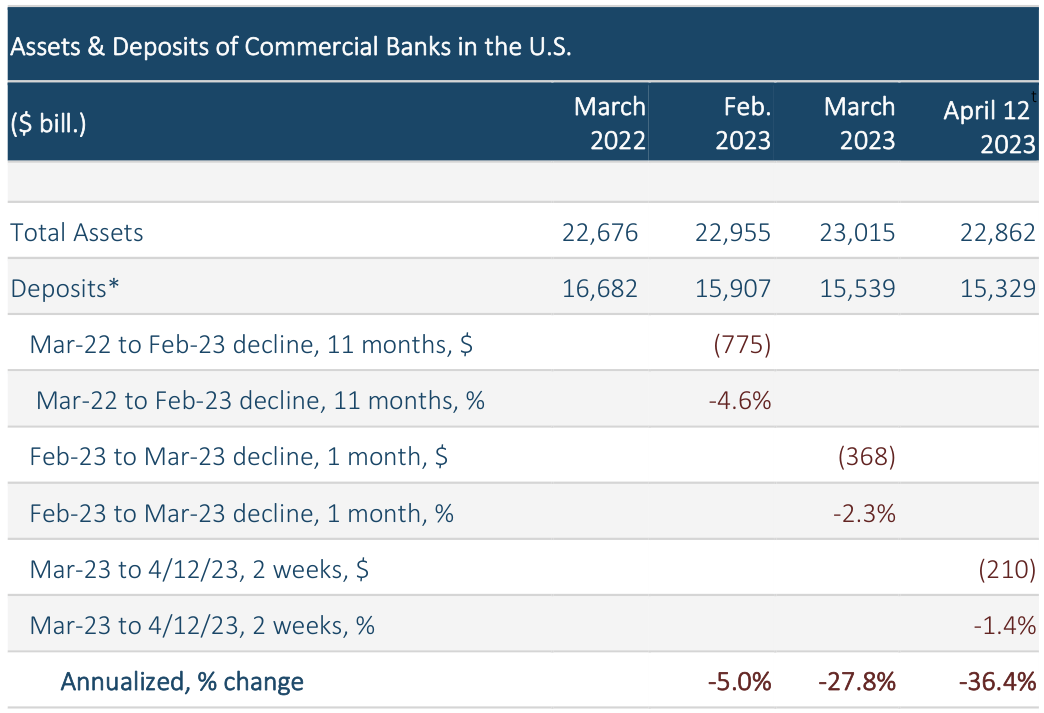
That is why, well before SVB’s collapse, there had been deposit outflows from the banking system. Although it is a grave distortion to try to annualize a few weeks or month’s results, as in the accompanying table, bank deposit outflows nationwide had been ongoing for at least a year and accelerated in the weeks prior to these events.
- In the 11 months to Feb. 2023, aggregate demand deposits of U.S. commercial banks declined 4.6%.
- Adding one month, for the 12 months to March 2023, the decline was 6.8%.
- Adding not quite 2 weeks, to April 12 th , the most recent figures, the decline was 8.1%.
This is a serious problem if it keeps up. It amounts to the beginning of a demonetization of the banking system. Although it can be characterized as a liquidity crisis, not a credit crisis, SVB shows how quickly a liquidity crisis can become a credit crisis, once banks find themselves unable or unwilling to extend credit, even rolling over an ordinary-course loan to a creditworthy customer. Loans constantly mature and have to be refinanced. But, a bank that is trying to rebuild its capital because of market value losses in its securities portfolio will be inclined to retain the cash from loan repayments, not recirculate it as is necessary to a well-functioning economy. A shortage of lending capital has consequences, some of which are already looming.
Sources: https://www.federalreserve.gov/Re- leases/chargeoff/default.htm, https://www.statista.com/sta- tistics/194054/us-office-vacancy-rate-forecasts-from-2010/
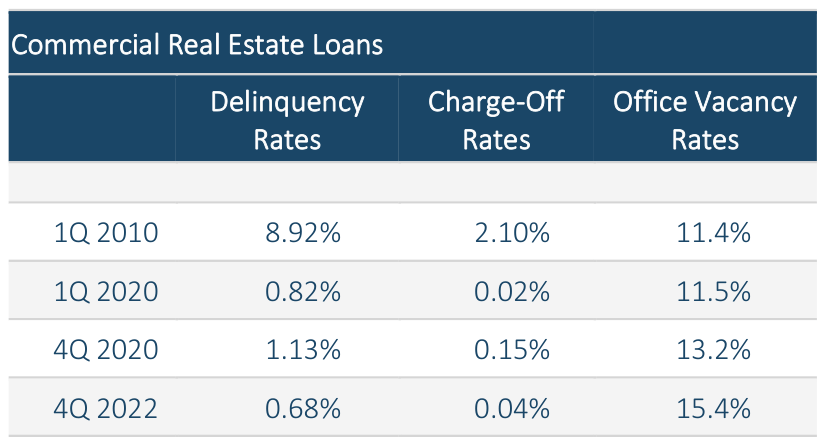
Banks hold a few trillion dollars of commercial real estate loans. At year-end 2019, before the Covid-19 pandemic, for one class of them, U.S. office vacancy rates were 11.4%; as of September 2022, the figure was 15.4%. 2 This has not been problematic to date. Commercial real estate loan delinquency and charge-off rates have remained low during this period. But during a crisis they can be many percentage points higher. The delinquency and charge-off rates on commercial real estate were 0.68% and 0.04% at the end of last year. In the first quarter of 2010, they were 8.92% and 2.1%. If the low delinquency rate reverses for any reason, that would be extraordinarily painful.
There are more ramifications and possibilities. The public investment commentary seems to be balanced between the-crisis-has-passed proposition and the it’s-not-over proposition.
One thing certainly is not over. So long as their customers are offered an overwhelmingly superior yield than deposit rates, banks will continue losing their prime source of funding. Additional collapses will inevitably follow, and on a scale that the government can’t itself fund. Nevertheless—or, rather, because of this—a true banking credit crisis or collapse is not the real worry. The reasoning, simply, is because it is not acceptable, it’s a road to rapid financial catastrophe. And because there exists a ready and obvious solution.
The solution is that the bank deposit outflows have to be stemmed, and the Federal Reserve has the power to do it. It need merely reverse its interest rate policy of the past year, lowering rates so as to narrow to differential between what banks pay and the higher rates on government securities. It will also have to provide liquidity for those banks experiencing a problem. They have trillions of dollars of ‘trapped’ below market-rate fixed-income securities on their balance sheets, such as 3% 30-year mortgages at half the market rate.
Which brings us right back to the real worry, the investment risk that’s been a through-line of our discuss is for the past few years…the building inflationary pressures. The Fed’s solution will require a massive injection of liquidity into the financial system—another cycle of increasing the money supply—which is a classic inflationary policy. Importantly, that policy will need to be maintained for a long time. That would tend to weaken the dollar. Gold and silver prices would increase substantially, gold in the short term historically being a hedge against a weak currency, despite its reputation as an inflation hedge. Prices would rise for other commodities priced in dollars. However, even more serious challenges may be rising for the U.S. dollar. Some questions around that will be addressed later.
A Re-Review of Business Model Thinking, and of Thinking About Investing before Thinking About Investments
Models are ways of understanding the underlying reasons for the behavior of complex systems, including their limits. Without models, systems can seem to act in random or, for a time, limitless fashion (like certain stocks or even the stock market).
There are even physiological models of how we process environmental stimuli, including social stimuli like group behavior. These are embedded in our evolutionary heritage of relatively frail tribal hunter-gatherers whose senses were hardwire-evolved to interpret the physical world of forests and savannahs. They’re great at what they were purposed for, but are ill equipped to interpret the many kinds of abstract statistical activity of the modern world. Those weaknesses are routinely exploited for entertainment and profit by magicians, casinos and state lotteries and, lately, by social media marketing algorithms. In the financial markets, they are exploited for illegal gain by Ponzi scheme operators, and for legal gain by hot IPO markets managers (the average spread earned by underwriters has historically been and remains about 7%: a $500 million deal earns the investment banker $35 million).
Hindbrain Decision Making, Prima Facie Exhibit #1: IPOs
If the IPO-market jibe seems gratuitous, history proves otherwise and presents an evergreen lesson: they somehow never lose their appeal, despite the fact that the vast majority of IPOs ultimately produce disastrous results. One reason this game can be played upon investors over and over is because one of the greatest cognitive failures of physical vs. abstract perceptions relates to short-term vs. long-term risk and reward. In the physical world, the movement of the second-hand of a clock (think predator stalking from the underbrush) is immediately noticed, but the motion of the minute hand, which is below the excitation threshold of specialized neurons in our visual cortex, never is. (Really, really slow is less dangerous—well, mostly). A 40-year study of U.S. IPOs, by Professor Jay Ritter, 3 updated this past year—with a cumulative sample size of almost 9,000 deals—illustrates these deceptively effective dynamics:
- The average first-day return of those IPOs, a couple of hundred per year, was 18.4%. That’s the short-term signal that fires up the attention and fixes the reward-memory that inveortors retain.
- But the average 3-year buy-and-hold return, relative to the entire stock market, 4 was a negative -17.2%.
- At the 3-year mark, 37% of IPOs had dropped more than 50% from their first-day closing price, and almost 60% were below their first-day closing price.
The real-world IPO returns are probably worse than the study results. All studies must make tradeoffs in selecting which data make it into the study and which don’t; it’s legitimate and can’t be helped. And there are other necessary tradeoffs. Do you equally weight companies, or go with market cap, in terms of their influence on the returns? Let the winners dominate the study returns, or somehow normalize their impact? Do you adjust that monthly, quarterly, annually? How to handle a company that is acquired during the measurement period, or companies with an unusual corporate structure, or with a very small market value? In this study, the universe of IPOs was over 15,000, but only about 9,000 were included in the returns. Among the excluded classes of companies were REITs, ADRs, banks and S&Ls, closed-end funds and natural resource limited partnerships.
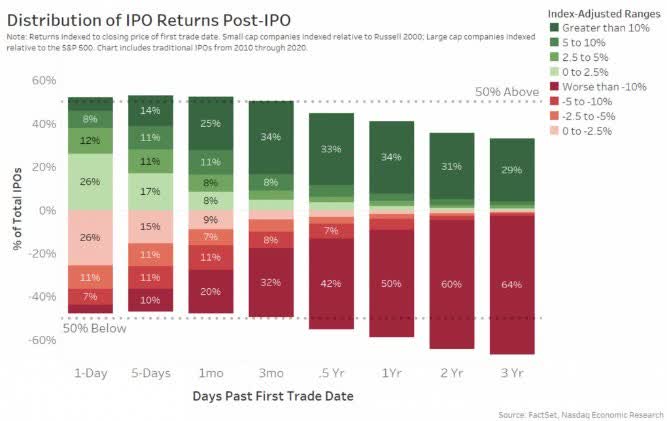
Another recent IPO study, for the 10 years through 2020, was conducted by Nasdaq itself. 5 It found that:
- In the 1-day, 5-day, 1-month and 3-month periods following an IPO, about 50% of them outperformed the stock market. 6
- But, at the 3-year mark, two-thirds underperformed the market by more than 10%.
The Nasdaq study likewise probably understates how badly most IPOs perform: the measurement period was one of the great bull markets in history, ideal for newly public companies. This is confirmed by the longer-term Ritter study: in the 40 years since 1980, IPOs had their best average 3-year relative return in the 10 years ended 2020. It was the best, but it was still really bad.
Exhibit #2: Bond Prices and Interest Rates
Another weakness of a nervous system designed for a physical as opposed to abstract environment is the impact of base effects upon our sense of whether a change is large or small. People tend to make comparisons in terms of units and arithmetic changes, whereas the abstract financial environment often operates in ratio and geometric terms. It’s astounding how much investment capital is placed at unnecessary risk because of this weakness.
-
- For instance, at year-end 2021, by which time the yield famine had habituated investors to reach for yield wherever it was found, the 10-year Treasury yielded 1.45%. Most of those who briefly contemplated the possibility of the Federal Reserve raising interest rates slightly, and who might have casually reviewed a history of rate increases, probably thought in units, as in ‘As unlikely as it is, so what if rates go up by just a percentage point or two? In the 1970s, they rose to almost 16%, which is unlike anything that’s going to happen today.’
- Except that in 1971, the base from which the 10-year Treasury rose was 5½% percent. In 2021, the base was only 1.45%, just a quarter of the starting yield in the 1970s. So, when the 10-Year rate rose by only 1.5% points in 2022, that was a 100% increase in the yield. The investment risk of a 1.5%pot rise in Treasury rates in 2021 was as great as a 5.5%-point rise would have been in 1971. A 3%-point rise was equivalent to a 10%-point rise in 1971. The convexity of bonds at a low interest rate level (the price change in response to an interest rate change) is quite high, much the way a zero-coupon Treasury note is more volatile than a high-coupon Treasury bond.
- Also, the 16% peak in 1981 took 10 years to reach; this one happened in months.
It’s a very obvious result for anyone who has explicitly learned the mathematical process for equating changes in interest rates to a bond’s current value. But it’s not reflexive or intuitive. Indeed, it was anticipated, but not by more than a small minority. It also required a conscious cognitive decision to go against an evolutionary instinct to place more value on near-term reward than long-term risk. This powerful tendency has been measured by any number of studies. In this particular instance:
-
- An investor would have had to forego a 3:1 reward opportunity—a 1.5% 10-year yield in favor of a 0.4% one-year yield. And would have had to accept that give-up for an unknown period of time: a year, five years, forever? Uncertainty, yet one more cognitive challenge.
- But if one understood that a mere 2%-point change in yield would result in a loss of more than a decade of returns from that 10-year Treasury, maybe that decision would have been made by more investors. But we’re not evolved to think that way; we have to be educated to.
It’s easy to see where most investors placed their capital; just go to the indexes. The iShares Investment Grade Bond ETF, with about an 11-year average maturity, and which lost 18% in 2022, has $33 billion of assets; the Vanguard Intermediate Term Investment Grade bond fund which, with only an 8-year average maturity and which lost 16% in 2022, has another $31 billion of AUM. And those are just two funds.
Exhibit #3: Monetary Policy and Monetary Debasement
Listen to a financial news station for some minutes and you can hear base effect, short-term/long-term, and fast/slow cognitive confusions playing out in real time. In fact, this whole section was prompted by recently hearing a television financial news anchor press a guest to explain this question:
“What’s wrong with investing bond and cash assets in money market funds and collecting 4.5%? Easy peasy, why do anything else?”
There was no clear response, other than, for conservatism’s sake, to maintain a diversified asset mix. The guest wasn’t equipped to answer, nor was the host.
Maybe the reason that they couldn’t gainsay the attractiveness of the 4.5% yield, is that it was such a notable and prominent change relative to the base condition the both had become accustomed to over a period of years: zero and near-zero money market fund yields. Somehow, they couldn’t think of the most important, most quantifiable risk of them all. Because this risk is usually a slower-moving rate of change that happens over years and decades. Like a clock’s minute hand, it tends to escape notice, at least notice to the point of alarm: inflation. When inflation is finally and truly noticed, to the point of serious reaction, it is during periods of actual monetary crisis. Or the latter stages of the approach of a monetary crisis.
People certainly did notice by the end of the 1970s. They did their grocery shopping more frequently, because they knew, they noticed , that within a matter of weeks the prices of tuna and cereal would be higher. This financial news program didn’t have that discussion, which would have made plain what was wrong with the 4% up-front return: it’s a negative after-inflation return, and it’s an even bigger negative after-tax, after-inflation return.
For students of economic and monetary history, this is second nature thinking. A study of serious inflationary episodes throughout recorded history is a 2003 book by Professor Peter Bernholz, 7 which quotes Aristophanes’ written lament, circa 405 BCE, about the severe debasement of the coinage, which had driven ‘good money’ gold and silver out of circulation and driven up prices. Yes, even then. The text, Monetary Regimes and Inflation, covers 29 known hyperinflations, and also selected serious inflations that didn’t rise to that collapse-level of monetary debasement. A few of Mr. Bernholz’s important observations are that:
- The highest inflationary episodes occurred in fiat paper money economies, as opposed to metals based monetary systems. In the latter system, the natural restraint on monetary expansion is that it is neither easy nor inexpensive to rapidly and sustainably increase the supply of gold or silver. In the former system—ours—the government just needs to print more paper currency, which is pretty easy and pretty cheap. The Federal Reserve reports that its printing cost for issuing a $20 bill is 13.8¢.
Over and over, throughout history, excessive money printing arose because those who control the money supply can receive a relatively immediate reward, whether by encouraging near term economic activity, funding a budget deficit or, as a longer-term strategy to avoid a near-term crisis, by diminishing the real value of excessive debt. In all cases, though, it will be a long time before the destructive impact of those decisions will be evident to the populace.
- In Mr. Berholz’s study, all the hyperinflations were the result of sustained excessive government budget deficits, largely financed by money creation. For reference to those historical figures in the accompanying charts, the current U.S. budget deficit amounts to 25.5% of U.S. federal spending. 8 That doesn’t qualify yet, of course, else we’d all know it. But we’re gettin’ up there.
- It was only as recently as the late 1970s that the gold standard was finally abandoned globally. This may be juxtaposed with Bernholz’s observation that—wait for it— almost 60% of all the major hypenflationary periods in history have taken place since 1990 . Almost sounds like global warming statistics.
For those who think economics is a dry, abstruse field, you might have something there. Here is an abridged excerpt of a review of Mr. Bernholz’s book, in Journal des Economistes et des Etudes Humaines (Journal of Economists and Human Studies), by a professor of economics at a highly regarded New England college. You will note the exclamation mark ending the final sentence, signalling what, in an economics journal, would be a most droll observation:
Exhibit #4
And all readers, I’m sure, will be delighted by the amusing anecdotes that pepper the text. My favourite concerns P.N. Christiernin, holder of the first chair in economics at the University of Uppsala in 18 th century Sweden. Professor Christiernin, it seems, correctly predicted that the growth of the paper money supply would lead to inflation; and after that inflation had emerged, he also correctly predicted that the government’s attempt to restore price stability through a sharp contraction of the money supply would lead to economic depression. After finding his predictions and advice ignored repeatedly by the Swedish government…Christiernin abandoned his chair in economics and began a second career, this time as a professor of philosophy!
That result in 18 th century Sweden, which was repeated in the Great Depression, is probably the singular reason for confidence that the Federal Reserve will not take that same short-term route of monetary contraction to stanch inflation. The long-term route is the one to worry about, the inflationary one.
Finally, on this topic, if you’re one to see information content about value from market pricing, a hardcover copy of Professor Bernholz’s book sells for $94 on Amazon. A used copy goes for $38, and a new paperback for $42. But you can get a used softcover at Alibris.com for $12.
Back to Business Models
It’s as important to understand business models before thinking about stock selection as it is to understand behaviour models. Otherwise, too much of the data could be interpreted through our reflexive hind brains rather than our abstraction-processing forebrains. Way before jumping to the action of buying and selling, one should remember basic principles. Rudyard Kipling appealed to higher analytical function in his inspirational poem, A Father’s Advice to His Son: “If you can keep your head when all about you are losing theirs… “
And one of the first principles is to assess the business model. One approach, originally taught in Harvard Business School, is Michael Porter’s Five Forces, which identify microeconomic factors that can impact profitability, such as the variety of barriers to entry into an industry, or the threat of substitute products, and how substitution risk can be impacted by factors like customers’ cost of switching and perceived product differentiation. The important point is that clarity as to the type of animal we’re dealing with provides a lot more clarity about how to best react to its movements. Let’s contrast two business models, chosen for being at the most extreme opposite ends of the spectrum of short vs. long-term assets and profit development.
It is among what are considered to be the great technology companies, like Advanced Micro Devices and Intel, that one is apt to see some of the greatest confusion between short-term financial results and share price movements, on the one hand, and long-term financial results. The former are exceedingly difficult to predict. Long term results are relatively easy to predict, because they are bound by the limiting realities of the business model. In the case of AMD, that is the business of being a large-scale semi-conductor manufacturer with a more dominant competitor that has a scale economy advantage.
Advanced Micro Devices: Isn’t It Wonderful! (Isn’t it?)…A Business Model Input/Output Review
Here’s what people see, remember and act upon. In the past several years, AMD has been the best performing major technology stock. It’s outperformed Apple, Amazon, Google, Meta (Facebook) and Nvidia.
Source: Factset
It’s even—FINALLY—beat the pants off Intel. At least in share price performance, market cap and S&P 500 weight.
Source: Factset
You’d never want to buy it, though. At least not if you want any reasoned confidence in earning an acceptable long-term return. At least I wouldn’t. You can make up your own mind with this simple listing of historic facts. As these facts are recited, the internal question might be – as if you didn’t know the name of the company or its industry – would you wish to commit long-term investment capital to this business? You won’t find these facts listed on your favoured financial news website or accompanying any earnings estimates.
- Over the course of 30 years, from 1991 to 2021, AMD produced $150 billion of revenues.
- Its cumulative free cash flow over the three decades was a negative $(4.7) billion. Keep that last number in mind for a moment.
- The company’s market cap 30 years ago, at the beginning of the period, was $1.7 billion. Even at the peak of the dotcom bubble in 2000, its $5.2 billion market valuation was only slightly above its cumulative losses. Its market value 20 years later, in 2011, was $4.0 billion, still less than its cumulative losses.
- Free cash flow losses were experienced in 12 out of the last 30 years, 40% of the time, meaning that’s the norm for this business.
- In the most recent 10 years, there was actually $3.0 billion of net free cash from operations. However, it all came in just one year, $3.2 bill in 2021, which offset cumulative losses in the prior nine years.
How does a business like that that even work?
- Of the $150 billion of revenues over three decades, AMD used $33 billion for R&D and $17 billion for capital expenditures. That totals $50 billion of expenditures, which is one-third of revenues, even before paying salaries and other operating expenses.
- Looked at from another angle, the company’s basic operating margin 9 averaged 1.2%. That’s before capital expenditures, but this is a highly capital-intensive business that requires continual upgrading of the manufacturing facilities just to stay in business.
- Therefore, on a structural basis, the company must periodically secure significant external funding, or it could not continue to operate.
But why would investors fund such a business?
- Presumably, they believe that the investment in R&D and capital expenditures will produce a sufficient financial return – from newer, faster semiconductor chips, and all that. Under that presumption, the extremely volatile business results and share price could be viewed in a positive light, that it’s ok to pay for optionality.
- As to the external funding, the company conducted two stock offerings during this period:
- In a $496 million offering in Jan 2006, 14 million shares were sold at $35.20.
- Three years later, at year-end 2008, the share price was $2.15, and AMD’s market cap was only $1.3 billion, even though it had raised almost $500 million.
- Ten years after the offering, at year-end 2015, the shares were still only $2.87, 92% lower than the offering price.
- The annualized stock price appreciation from that 2006 offering to today's $75 price, over 16 years, is 4.6%/year.
- In a $690 million offering in September 2016, 115 million shares were sold at $6.00 each, increasing the share count by 14%. In this case, the annualized share price return from the offering to year-end 2021 was indeed a spectacular 81%.
- Another source of earnings dilution was from stock compensation. As of year-end 2021, unrecognized compensation expense related to time-based restricted stock units (that is, not including other stock-based compensation) was $704 million, to be recognized over about two years. This may be compared with the company’s aggregate free cash flow in the prior two years, 2020 and 2019, which totalled $1,564 million. Between external equity funding and stock compensation, the share count increased 6.4x over the 30-year period, which equates to 6.4%/year. That required 6.4% annualized earnings growth merely to avoid shareholder dilution and maintain a financial return of zero.
- In a $496 million offering in Jan 2006, 14 million shares were sold at $35.20.
- Then, what is the basis for the AMD extraordinary share performance in the past several years?
- Annual sales growth shifted from -28% in 2015, to positive, reaching 45% in 2020 and 68% in 2021.
- The operating margin rose from two negative years, –8.7% and –10.9%, to positive, reaching 14.0 and 22.1% in 2020 and 2021.
- The Price/Sales valuation multiple expanded from 0.4x in 2015 to 10.8x.
- The multiplicative result was a stock market cap that rose from $2.25 billion to $177 billion. Perhaps these figures demonstrate that AMD is finally a sustainable growth company. They are strikingly similar, though, to what occurred 20 years ago, between 2002 and 2005, the last time the shares peaked:
- At that time, revenue growth rose from –30.7% to positive 42.1%.
The essence of the share price returns and popularity of AMD stock in the past several years is that the valuation multiple expanded 27x, from 0.4x revenue in 2015, to 10.8x in 2021. Which is to say that the return really came from people’s behaviour, not from the business.
Even today, with the share price down 45% from year-end 2021, AMD trades at 5.6x trailing revenue, The 30-year average valuation is less than half that: 2.1x.
-
- The AMD market cap expanded by 16.8%/year over 30 years, but per-share revenue at only a 2.3% rate.
- The share price appreciated by 6.3%/year, but most of that came in the past four years or so. For the 26 years through year-end 2018, the figure was only 1.1%.
- Some would assert that, as an important technology company, irrespective of these figures, there were periods when AMD nevertheless provided a more than adequate return. A question in response: what proportion of investors during the past 30 years would have held the shares long enough so as to see that return? Here are some statistics that might suggest an answer.
- There were nine calendar years of stock price declines of more than 30%, and three of those were sequential. Twenty-four years after the start of this period, the shares were two-thirds lower than at the beginning.
- There are trading statistics. In 1991, at the beginning of this period, and before high-frequency trading came to dominate volumes, AMD’s share turnover was 175% for the year. In 2001, annual turnover was 467%. It’s higher than that now.
There might in fact be some exceedingly marginal proportion of investors who would have held the shares, who didn’t sell them after some dramatic decline, after 10 or 20 years of flat or negative return, or opportunistically at some interim peak. But, that simply means that the balance of the AMD shareholders—meaning virtually all of them—could not have achieved any compounding from AMD. They would have had to wait for the final two of the 30 years.
AMD Business Model Review
- There are many ways to invest, and there must surely be investors who can repeatedly trade profitably in the AMD shares, but AMD is NOT a growth company - nothing like it. It's not even a profitable business. Going strictly by the numbers, it’s a vehicle to take in permanent capital on the stock optionality of a couple of good operational years, but the business turns the capital into a financial loss. Without billions of dollars of capital infusions to finance those losses, it would not have been able to stay in business.
- Because it does not produce a repetitive positive financial return, its intrinsic value cannot compound over time. Persistent compounding is one of the most powerful financial forces – both as a wealth builder and as a wealth destroyer. After all, inflation’s corrosive impact is generated by persistent long-term compounding: a 7% annual increase in the price of a $5,000/month apartment rental doesn’t become becomes, linearly, $12,000 after 20 years, but $19,350, which is 60% greater.
- But compounding requires a very long unbroken holding period, so as to allow the process to occur. Trading out of it and back in means the compounding period must start over.
- One more note about AMD before we turn to the longest-lived business model. It’s not as if investors in 1991 couldn’t know that AMD was a financial loss-making business model. Here are the company’s summary returns for the decade before 1991. They are almost numerically identical to all that followed in the ensuing 30 years.
- Aaaand, to complete the central thought, this exercise was not about AMD. It could have been about an equally famous retailer or auto manufacturer that has been in existence for generations and is therefore deemed to be successful. AMD was merely an exemplar for how important the fundamental financial characteristics of the business model are to a rationally expected long-term return. That will probably be more important in the next decade or two than in the past few.
This proposition can be somewhat generalized in the form of the iShares U.S. Technology ETF (IYW).
Most people probably think of technology sector profitability as exemplified by the 18.3% 10-year annualized return of this index. But its almost 23-year rate of return, since its May 2000 inception, is only 5.8%. IYW did no better than the S&P 500. The starting point might be a bit harsh, though, since May 2000 was near the moment when the Technology Bubble began its collapse. A more generous start would be at the end of the 2 nd year of the Technology Bubble collapse, year-end 2021, by which time IYW had fallen 54%. The return from that point to now, 21+ years, is an annualized 10.0%. That 10% includes the very influential impact of IT companies that did demonstrate remarkably high, and sustainably high, profitability business models: Apple, Microsoft and Alphabet (Google) comprise 46% of the iShares U.S. Technology ETF. The only reason for belabouring this is because high, chronic inflation is very, very likely before us, and what makes it such a powerful destroyer of wealth is that it is a continual, persistent price level compounder. One of the tools for fighting it is in-kind, to own continual, persistent value compounders.
Then there’s land.
Land is the longest-lived business asset. It is probably the only perpetuity business asset, a least until another planetary body is colonized. A mineral like gold or diamonds don’t count. A mineral that’s been produced isn’t a business, since it has no operational aspect to it. It is permanent, but ‘diamonds are forever’ only in that way—mineral deposits can be depleted fairly rapidly, and diamond mines are known be in decline. Land also has a rising scarcity function, since the world population increases over time. Globally, the arable land per capita is always decreasing.
On a localized level, there are cities and megalopolises that have expanded for hundreds of years. The population density of Paris was almost five times higher in 1637, but it was only 1.7 square miles then; today it is 40.5 square miles. 10 But, as in all real estate, each circumstance is unique. Unlike Paris, the Manhattan footprint hasn’t expanded much in the past 200 years, but the square footage of living space within that footprint has. The population density per square mile, versus 1790, is almost 50x greater. 11
Land can serve different, progressively higher-value functions over time. Grazing pastureland can become farmland; farmland can be incorporated into an expanding Paris. On a city’s margins, a warehouse can become an office park; within a city, a low-rise building’s lot is repurposed into an office tower.
The largest non-government or native peoples landowners in the U.S. are timber and forest products companies.
- Rayonier, Inc (RYN), the timberland REIT that is in some portfolios, earns fees from operators who do the logging. It owns 2.8 million acres distributed across 11 states and New Zealand.
- Acadian Timber (ADN:CA), in some income-oriented accounts, owns 1.1 million acres of timberland in Maine and New Brunswick, and manages another 1.3 million acres of Canadian Crown Lands. Based on its minimal salary expense, it might have, roughly guessed, a dozen-odd employees.
- PotlatchDeltic Corp. ( PCH ) owns 2.2 million acres across 6 states. Being a wood products manufacturer, too, unlike Acadian Timber, it has 1,300 employees.
Maybe more interesting are private landowners.
- The 2 nd largest private landowner in the U.S. is John Malone, who began his fortune by building Telecommunications, Inc. into the largest cable TV network. He owns 2.2 million acres. These are distributed across 5 states, Colorado, New Mexico, Wyoming, Maine and New Hampshire.
- The 3 rd largest U.S landowner is Ted Turner, who created CNN and the TBS superstation concept, and has a long association with Mr. Malone. He owns 2 million acres, but they are comprised of two dozen properties, 12 largely in New Mexico, Colorado, Montana, and Florida.
- 5 th is Stan Kroenke, at 1.627 million acres, whose wealth is associated with the Walton family (WalMart). He owns the Waggoner Ranch in Texas, and others in Wyoming and Nevada. The Waggoner Ranch is 520,000 acres, which just about half the size of Rhode Island.
- 7 th is the Buck family, founders of Subway restaurants. They own one of the largest timberland portfolios in Maine; overall, the family owns 1.236 million acres.
- 8 th : The Singleton family—Henry Singleton founded the modern technology conglomerate business model, Teledyne—owns 1.1 milli acres in various locations in New Mexico and California.
- 10 th , the King Ranch heirs, own 911,000 acres, comprised of dozens of ranches nationwide.
- 17 th , is Thomas Peterffy, who founded Interactive Brokers. In 2015, he paid more than $700 million for Foley Timber & Land Company, which holds a 561,000-acre tract, almost 900 square miles, near and along Florida’s northwest coast. This transaction is interesting in its own right. Mr. Peterffy bought Foley Timber & Land from an investor group that had purchased it from Procter & Gamble in 1994. Procter & Gamble had used the timber for wood pulp for its Pampers diapers. It might not have sold the property but for that year’s $350 million of interest rate and currency derivatives swap losses, reportedly the largest ever for a nonfinancial company. These were a more exotic version of standard hedges, in which the company had been advised by Bankers Trust Co. The gain on the timberland sale would have offset those losses. The investor group that purchased the P&G property included Howard Leach, a former partner at private equity firm Forstmann Little; Robert Day, the founder of Trust Company of the West; Kenneth Langone Sr., a co-founder of The Home Depot, and whose venture capital firm organized the financing for its formation; and Henry Kissinger.
- 21 st largest U.S. private landholder, with 508,410 acres, is Don Horton, who founded D.R. Horton homebuilders. This is a portfolio of ranches in West Texas and across New Mexico.
There is plenty of land investing going on, including by very well-funded, well-informed parties. Just not in the stock market for the rest of us.
The Time Horizon of Land Investments
The idea of land as an investment requires accepting the duality that while 1) its ultimate return can be of a high order, 2) the pace of that value development can take a very, very long time. People have waited lifetimes to realize the payoff from real estate. Many tired of the investment before the slow pace of compounding could pay off. Yet, land can be one of the greatest long-term return and inflation hedge vehicles. Here’s an example of both characteristics.
It was in 1952 that Howard Hughes paid $3/acre for 25,000 acres of desert scrubland 10 miles west of Las Vegas. That’s the equivalent of a rectangle about 4 miles by 10 miles, roughly the shape of the property. A variety of development plans were never enacted, including the original one to use it for radar and guided missile technology testing. Neither was a 1966 plan for a supersonic plane airport. It was not until 1988, a decade after Hughes died, that plans were made for a master-planned community, called Summerlin, after his grandmother Jean Summerlin.
The first residence was ready in 1991. This past March, the 40,000 th home was completed, 30 years after the first one, and 70 years after the land was purchased. It still has 5,000 undeveloped acres. In 2022, 216 acres, for a 561-home development, were sold for $624,000/acre. That’s over a 200,000x multiple of cost. On a pure price/acre basis, which differs from what the succession of Summerlin’s owners and developers would have earned, that original parcel appreciated by 19% per year. But it took 70 years, and nothing at all happened for the first 35 years.
Of course, only a portion of the total acreage can be monetized directly, such as for housing, commercial and retail lots, because much of the land is necessary for public areas like roads, parks and schools, so the per/acre return is overstated. And, of course, development requires investment and operating expenses. Summerlin now includes 1.2 million square feet of retail and 945,000 sq.ft. of office development, plus multi-family housing, that are estimated to generate $82 million of operating income per year. 13 This was the product of enormous sums of additional investment, of course, above the original $75,000 purchase price for the land, but even if adjusted accordingly, what a return.
One couldn’t have invested in Summerlin, though. It was a private property first, then held by other entities as part of larger portfolios of properties. One of those entities, General Growth Properties, filed for bankruptcy in 2009. The book value of the land at that time, which is some reflection of how much development investment was made, was reported as $1.115 billion.
Despite this return potential, as well as its diversification benefits—since land values don’t coincide with the business cycle and have very idiosyncratic, property-specific return patterns—land does not really exist in the public investment industry. It is completely absent from major capitalization-weighted equity indices; it has effectively no weight in smaller indices.
What Is and Is Not a Land Company
An understandable rejoinder is to point to the REIT industry and to home builders. But a REIT is something entirely different. Some REITs own office buildings and homes, others storage facilities or malls, so that their net income is ultimately a product of those activities and properties, not of land. Importantly, REITs must distribute almost all of their income as dividends, so there is little scope for internal compounding from reinvesting income in the business or repurchasing shares. That also means they require external funding for expansion, so they take on debt and issue shares for purchasing properties. The first makes them credit and interest rate sensitive, and the second is dilutive to shareholder returns. As we’ll see shortly via a real-life example, that makes a tremendous difference.
As to home builders, which do often purchase land, that land is held as inventory for relatively near-term use, so it is converted into operational assets and not retained for its land properties. Such land positions are finite commodities—not only expensive, but also difficult to acquire, particularly during a cyclical upswing. Homebuilding, too, can entail debt leverage, which adds to the short-term cyclical aspect of the business. This differs from the Howard Hughes example of a company that already owns a very large tract of land that can thereafter be developed for decades or generations.
The return differential between land and the REIT model can be observed at another relatively long-lived company. The inherent economics of a business emerge with the benefit of time, which blurs the noise of quarterly and annual results. One of the oldest publicly traded REITs is Kimco Realty (KIM), which predates even Simon Property Group. 14 Kimco came public near year-end 1991, so it has a 30-plus year operating history. It has an $11 billion stock market value and is one of the 30 companies in the REIT sector of the S&P 500. The REIT sector has an aggregate market cap of $773 billion; this figure will be mentioned again very shortly.
- Kimco revenues have risen 10.7% annually since 1991, and flow of funds from operations have compounded at 11.2%. This is very creditable, as far as it goes.
- But, the share count has expanded at almost precisely the same double-digit rate in the past 30 years, 10.9% per year. The only relevant figure to a shareholder is the per-share figures. Accordingly, pretty much all of the growth has, as the business model would suggest, come from external financing.
- The per-share growth rate of FFO has been only 5.1%. A form of growth with little prosperity. The simplified total return, calculated on the basis of the final share price plus cumulative dividends, versus the IPO price, has been 7.5% per year.
As to land companies, they can’t be an asset allocation choice for institutional investors:
- Superficially, the reason is because there are only about 10 of them, which would prevent qualificaon even as an ETF sector fund.
- Even if grouped as one, they lack the market value to qualify for the S&P 500. About the smallest position in the index, at 1 basis point, or a one hundredth of 1 percent weight, is Newell Corp, with a $5 billion market cap. The publicly traded land companies don’t reach that level. Recall that the REIT sector market cap is over $700 billion.
- Worse yet, most of them have limited trading liquidity.
- The underlying reason for these characteristics that disqualify land companies from the indexes is probably because the time horizon for monetization events is so long. That doesn’t play well, so it’s not a place to raise money.
If one wanted a sense of how well publicly traded companies do over a really long time, it would be a lot harder and more complex a project than you might think. Surely, you say, those figures are available at the push of a database button—there are indexes of long-term performance, and some go back to 1926, which is the beginning of the industry standard Ibbotson & Sinquefield study. But index construction involves replacing failed or acquired companies with others, and electively dropping old ones to make room for the new. There is a great deal of creative destruction and survivor bias in the index. It is startling just how much turnover there really is and how short the lifespans of some iconic companies are.
Here's a list of 9 of the 10 largest companies in the S&P 500.
They total 25.5% of the index. Their combined market value is $9.5 trillion. Let’s take a 50-year look back. All you need to do is get yourself a copy of the S&P 500 from 1972. Good luck finding one, because there’s not much interest in that kind of stuff.
If you could locate a 1972 list of the S&P 500, here’s what you won’t find…any of these companies. The oldest of them, Microsoft, wasn’t publicly traded until 1980; it was founded in 1977. You would have found General Electric, which by the year 2000, was the largest company in the S&P 500. That mighty corporate edifice, a much-studied icon of effective, efficient management, has since lost three-quarters of its value and is now listed 74 th . As to these new apex companies, there are now reasons to believe they are nearing their own growth limitations and beginning to compete with one another. This might sound odd, given their ascendant market power. Yet, GE.
It’s actually not easy to find a truly long-lived business that has continued to prosper. There are exceedingly few that have both been around long enough and match the returns of the stock market. Because the index itself is not an actual return. It’s an amalgamated, spliced and constantly re-edited statistical construction. Just as the Consumer Price index is not a true representation of the price level that people experience. Hey, all we’re trying to do here, is draw the curtain aside a little.
The longest-lived company in the S&P 500 is BNY/Mellon, née The Bank of New York. It was the first publicly traded company on the New York Stock Exchange. There is a book, a detailed 100-year history of the bank, and commissioned by the directors. It was written in 1884! Its constitution and policies were drawn up by a young Alexander Hamilton in 1784, many of them a model for improved banking practices generally.
We’ve not had the time to research the annualized return of the Bank of NY since it first began trading. However, land again comes up as a reference point. As part of a regulatory-based recapitalization in 1838, its real estate at the corner of Wall Street and William Street was valued at $250,000. That property today, 48 Wall Street, completed in 1929, is the third building that Bank of New York had erected on that plot. Based on the median sale price for space in the Financial District, its 324,000 sq. ft. of leasable area would be worth $421 million, 1,684x the original value. That’s a 4.12% rate of increase. While not as high as a bond index return, the land has been providing tax deferred appreciation, which might well exceed an after-tax bond return. Also, the return probably does not reflect that, at only 32 stories, the building could be rebuilt a 3 rd time for yet higher value. On the other hand, 48 Wall Street was added to the National Register of Historic Places in 2003, an honor that likely precludes any such further active value enhancement, although, where there’s a will, there’s a way.
A Quintessential Land Company
There is, though, a land company that has been publicly traded for well over a century, making it the 4 th longest-listed company on the NY Stock Exchange. Evidencing how invisible land companies are, two different websites list the renowned companies that have been trading the longest. The five oldest are reported to be, in order, BNY/Mellon, Consolidated Edison, Procter & Gamble, IBM, and Coca-Cola. The problem is that No. 4, IBM, went public in 1916, some decades after this land company did. This is a lesson in the survivor bias challenge in analyzing or relying on index returns.
In any case, this land company has the added benefit of not having undergone any recapitalization, acquisitions or ownership changes that would overly complicate the return calculations. The result is quite extraordinary. There are a few complexities, as always occur, but here are the preliminary, conservatively calculated figures.
- The initial stock price was $20 per share. It was Jay Gould, the infamous robber baron, who was “to undertake to find a market for it at that price,” according to a newspaper article of that time.
- In 1927, almost 40 years later, at $2,000, it was the highest priced company on the Exchange.
- Today’s share price is 286,857 times greater than the initial $20. Let me repeat that, a 286,857tis return. It would be equivalent, had there been no stock splits, to a current share price of $5.7 million.
- Simply astounding. And yet, here’s the real point: that remarkable figure is merely the product of what would be a completely uninteresting rate of appreciation to any self-respecting Wall Street analyst or portfolio manager: 9.63% per year. You really can’t sell that. For those immersed in the day-to-day flow of the markets, every sort of stock and index can rise 9% or 10% in a given year, even in a week or a day; heck 15% ain’t nothin’.
Yet, we’ve seen how starkly impressive 9.6% is, because of how extraordinarily rare it is for 1) a business to sustain that rate of return, and 2) for an investor to hold it long enough to realize the compounding.
As soon as a security is sold, the compounding chain is broken. That stock might one day become a very large portion of a portfolio; it is at that point that the next year’s 10% return, and the next, begins to truly dominate the portfolio’s return and create true wealth. But it is a rare investor who can avoid breaking the compounding chain.
Obviously, there is no $5.7 million share price on the NYSE. To compute the annualized appreciation to today’s share actual price, the initial price has to be adjusted downward for periodic share splits. These cumulated to 3,000:1, so that the original $20 figure would be $0.0067. The share today is within a ‘normal’ range price. Moreover, the 9.63% annual return is only a preliminary figure. It excludes dividends and it excludes the return from a valuable asset that was spun off to shareholders over 50 years ago.
Before we add those additional elements of return, it’s worth pausing again on just what an elite, Olympics level of discipline is required for an investor to avoid transacting. Even if only out of sheer boredom, of having to endure an absence of visible catalyst for value recognition, of not seeing an end in sight.
- For instance, on September 14, 1899, a decade after someone might have purchased the shares for $20, they were still quoted at $20/$20 ¼. One couldn’t be blamed for selling it in favor of something more interesting. There were many such periods in the ensuing century.
- Then there’s the impatient public. As early as six years into its life, in 1894, the company was harried by shareholders to operate more aggressively. The complaint was that they were selling only sufficient land to pay expenses, and that good investment performance necessitated selling the asset in bulk. It was the company’s “ retort that the land can not be sold in bulk,” per a newspaper article of the time. Shareholders were in a hurry.
If not the best performing stock on the NY Stock exchange over the past century-plus, this index-forgotten land company is certainly one of an exceedingly small, most august group.
At this point, for those who haven’t penetrated the conceit of the exercise, this land company is Texas Pacific Land Corp. It’s natural to protest that TPL is an energy sector company; it is certainly categorized that way. But it was originally categorized in the quotation section of financial newspapers under “Real Estate Trust & Land Stocks.”
Operating and financial data make clear that it is a land company that gets a large, but not necessarily majority, of its revenues from oil and gas. Though it might surprise some, those revenues are often exceeded by revenues from its water rights and leasing activities, both of which derive from its land, as will also be the case if any of the land is ever developed into real estate.
Here is some abridged commentary about the oil prices from TPL management from the Feb ‘21 annual report. It’s a bit out of date, so you have to recall the oil market then.
There is quite a lull in the oil situation in all the fields in Texas, which has continued now for some weeks. Crude oil is now selling at from 50% to 60% lower, per barrel, than sixty days ago and general retrenchment seems to be the plans of all the principal oil producers, and little or no work is being started at the present time.
This was not written in 2021. It was written 100 years ago, on February 14, 1921. The 1919 income statement showed that lease income accounted for over 90% of revenue, but in 1920, oil accounted for 44% of revenue. The note was intended to alert shareholders that the oil income would probably be a lot lower in 1921.
The original valuation of the property transferred to the Trust from the railroad bankruptcy was all about the land. Indeed, the land was described in extraordinary detail by the Trustees’ agent and included data from the Report of the State Comptroller for 1887. This was on a county-by-county basis, including descriptions of the character of the land by elevation, rainfall, population, recent immigration statistics and, along with market value assessments, descriptions and valuation of machinery, crops, mineral deposits and silver, copper and iron mining activity, and on and on.
There were 467,216 head of livestock valued at $3,983,216. There was timber, cotton, fruit, salt deposits.
It was noted that in an 11-county grouping, which should be familiar to followers of TPL’s currently active oil producing areas (Loving, Ector, Upton, Winkler and Midland counties), “There are but few running streams in this portion of the State, but at depths of from 20 to 90 feet, water of excellent quality is found in inexhaustible quantity.” That water, today, is a major revenue producing asset of TPL.
It’s easy to categorize TPL as an oil sector company; it is difficult to refute that it is a land company. After all, recalling the previous listing of the largest landowners in the U.S., even the very largest were distributed across many states. TPL’s 874,000 surface acres qualify it not only it for that list, but also as one of the top few in Texas. As a final note on the challenge of relying on the historical validity of indexes, also recall that TPL was not on that annual listing of largest landholders, just as it wasn’t on the listing of longest-traded NY Stock Exchange companies.
The following century of statistics describe the elements of the land value development in the TPL shares. This occurred almost entirely before the ‘re-discovery’ of western Permian Basin oil in 2011-ish.
- Price/acre performance One return element for TPL is the price of the land, some 95% of which is grazing land, and which is substantially all under lease, as has been the case since 1888.
- In 1888, TPL’s first year of land sales averaged $2.36/acre, about identical to the average sales price over a decade later in 1900.
- In 2022, some of the most active drilling on or near TPL land is in the 12,900 square miles comprising Crane, Loving, Pecos, Reeves, Terrell, Ward and Winkler counties. Rangeland-Agriculture land there is valued at $283 to $420/acre, and Rangeland special purpose sales, as for industrial use but not energy, was $715 to $1,500. 15
- If, from these prices, TPL surface land is valued at a generic, non-energy-related $700/acre, the annualized appreciation of undeveloped rangeland is about 4.3%/year over the $2.36/acre price of 1888. 16
- For a future time-capsule contrast, here are a couple of asking prices for undeveloped lots in/near Midland City, Texas. Midland City was once as sparsely populated as the above-named counties. But, with ever-more dense drilling activity it developed into a small city. One might recall the Summerlin development in Las Vegas. The asking price for a 6-acre undeveloped commercial-zoned lot on I-20, about 3 miles from the center of downtown Midland, is $650,000 per acre. 17 Also for sale, a 538-acre scrub-land lot 14 miles from Midland. It is developed only to the degree that it has electric service and water wells. It is part of a tract that had the first produning oil well in Midland County, which would have been exactly 100 years ago, but now conveys without minerals or mineral interests. It’s priced at $21,000/acre. 18 It looks a bit like this:
-
- In 2022, TPL sold land for about $1,515/acre, and in 2021 for a $25,000/acre price.
- Acres/share performance Then there is the increasing land content within each share.
- In February 1888, TPL commenced with 1.109 acres per 100 shares.
- As of December 2022, there were 11.357 acres per 100 shares.
- That’s an annualized increase of per-share land content of 1.75%.
- On that basis, you could say that about 6% of TPL’s annual return came just from the appreciation of the generalized land value and the anti-dilutive land-sale/share-repurchase program. Part of funding for share repurchases was revenue from leasing activities, oil and gas royalties, and water and minerals sales.
Not yet counted in the historical return was the spin-off or any dividends paid out.
- In 1954, TPL created a new company, TXL Oil Corp., into which it transferred the mineral rights of its then 1,973,099 surface acres. TPL shareholders received those TXL Oil shares.
- In 1962, Texaco acquired TXL for $202 million, paid in Texaco shares.
- In 2001, Texaco agreed to be acquired by Chevron.
- Adjusted for stock splits at Texaco and Chevron, the original 5.574 million TXL Oil shares that TPL shareholders received in 1954 would now, at the recent Chevron share price of $170, be worth $3.902 billion.
- The TPL market cap is now $13.852 billion. Adding the $3.902 billion spin-off shares adds another 0.18% annualized appreciation, so we’re at 9.78%. That estimated historical return still does not include any dividends received. We have yet to unearth the full historical record. There are illuminating portions of the historical record though. While there were periods when TPL paid no or limited dividends, there were some when it paid very high dividends. But even relatively brief periods of high payouts can significantly impact long-term returns.
- During the 10 years from 1945 to 1954, shareholders received $17.55/share of dividends, recoverin125% of the 1945 share price of $14. The average yield of 12.5%, not captured in the price return, was important, since the 1954 price was unchanged from 1945.
- A similar 10-year period for Texaco was 1984 through 1993, when $34.75/share of dividends were received on a starting share price of about $35. That was just under a 10% average yield.
This is NOT, it should be said, a valuation of TPL. It is simply an attempt to trace the long-term inflation capture value of land as an investable publicly traded asset. TPL is not the only such, but it is one of the longest. In this case, because of the royalty interest in the spun-off mineral rights, it even captures oil price inflation. In TPL’s 1920 Annual Report, the Trust’s General Agent wrote that the crude oil price dropped from $3.00/barrel in December 1920 to as low as $1.25 in February 1921. Today’s $80 oil price reflects a 102-year inflation rate of between 3.3% and 4.2%, depending which starting price you choose. That inflation is manifested beneficially in the TPL cash flow.
Some Portfolio Land Companies
Texas Pacific Land is not the only superb land company, though it has the important distinction of also being a royalty company. There is a publicly traded, income-paying land and royalty company that parallels TPL and its history, but which has at least 11x greater land area.
PrairieSky Royalty Ltd. is the largest private landowner in Canada, with 9.7 million acres of land in western Canada, about the combined size of New Jersey and Massachusetts. It’s 18.3 million acres, if including royalty interests in Canadian government-owned land.
PrairieSky could easily have been the model for the preceding land return analysis, except that it has been publicly traded as land for only a decade. The land itself had an inception much like TPL’s: in 1881 as a government grant to Canadian Pacific Railways to build a transcontinental railroad. The mineral-titled lands were eventually placed into a new company, Canadian Pacific Oil & Gas Ltd., which through mergers eventually became Encana. It was only in March 2014 that PrairieSky was created to hold the mineral title lands and had its IPO.
On a business model basis, PrairieSky has, like TPL, engaged in a long-term anti-dilutive capital allocation strategy. In TPL’s case, that was enforced by the establishing Trust Agreement; the company couldn’t stray. In PrairieSky’s case, it is a management choice. PrairieSky shares have a 4.6% dividend yield. It could be higher, but the company maintains a low payout ratio so as to have sufficient cash flow to both invest in additional properties and to repurchase shares. Its cash flow is allocated to all three purposes. The results, even in only nine years, have been impressive.
Like TPL’s historical business practice, PrairieSky engages in no direct operating or physical capital investment activity. Third party operators explore and drill, and pay lease rental and royalty fees to the company. Accordingly, despite a CAD 5 billion market cap, and CAD 643 million of revenues, it has only 65 employees. Its free cash flow margin tends toward 80%. Some historical return metrics:
- At its IPO, PrairieSky had a stock market value of CAD2.825 billion and 4 acres per 100 shares. As of March 2023, it has 7.7 acres per 100 shares, so the per-share land content has been growing at a 7.5% annual rate.
- At the beginning of 2014, it had proved and probable reserves, in oil-equivalent terms, of 36 million barrels. Since then, 65 million barrels have been produced on the company’s properties, which is almost twice the original stated reserves. Yet, its current reserves are measured at 67 million barrel. The company has spent substantial sums on property and reserves acquisitions, but the number of barrels per 100 shares has increased from 24 to 28.
Interestingly enough, PrairieSky also has a AAA ESG ranking from MSCI, a #1 Environment & Social score from Institutional Shareholder Services, and was ranked #1 among Global Oil & Gas Producers by Sustainalytics. You’d think this largest land company in North America would be better known.
Tejon Ranch Co. Like TPL, Tejon Ranch was not mentioned in the lists of largest U.S. landowners. Similar to the TPL ranking in Texas, while there are larger landholders in California, those are comprised of separate properties. Tejon Ranch says its 270,000 contiguous acres are the largest such in the state. The property is located a bit more than 60 miles north of Los Angeles, along I-5, the state’s major north-south highway.
The strategic value of this land is linked to its strategic location. Los Angeles is the nation’s largest port city and, related, a major center for e-commerce shipments. However, its high rents, property prices, congestion and regulations impede expansion or development of warehouse and logistics facilities. That has enabled Tejon Ranch to develop over 8 million square feet of commercial, industrial, and retail space, including distribution centers, right outside L.A. Lessors include companies like Ikea, Dollar General, and Caterpillar. Paradoxically, Tejon Ranch is just about the same size as L.A.
The property also includes one of the largest, busiest travel plaza/truck stops in the nation, the scale of which has not been experienced by most travelers. A way to get a sense of the scale is through the annual fuel revenue. It is now at the $140 million level, and expands rapidly from year to year. Like the movie theater industry, in which earnings are not about the movie tickets, but the soda and popcorn, a travel plaza is not about the gasoline, but the amenities and restaurants that go along with it. The travel plaza profits can probably be attributed to the amenities. This one venture might account, depending how calculated, for roughly a quarter to one-third of the company’s earnings (there’s your GAAP earnings, there’s your FFO, there’s your free cash flow, plus you got your pre or post-equity compensation free cash flow, plus…).
In asset-light fashion, Tejon Ranch does not engage in direct development, but contributes land to develops, typically for a 50% ownership position. To the degree that the company is known to investors, it is probably for the mixed-use master planned communities it has been trying to develop for the past couple of decades. If ever fully approved and entitled, these would encompass 35,000 homes on over 40,000 acres of gross land area. That would be a very significant higher-better-use change in land value. In its way, the continued growth of the industrial and retail developments enhances the potential demand for the planned housing, since several thousand people already work in the Tejon Ranch projects.
Other sources of value development that come with Tejon Ranch’s land position are revenue producing farmland and water rights. The latter have been a decided scarcity-based inflation beneficiary in the southwest for generations. The company earns a not-insubstantial amount of income from leasing land for an electric power plant and cell phone towers. It also receives royalties on cement and aggregates.
There is at least one ESG Compliance list that restricts purchase of Tejon Ranch; we know this, because one client was precluded from owning the shares. There are many such ESG restriction lists, all of which reach different—and often contradicting—conclusions for different reasons. In this case, Tejon Ranch was restricted because, among its 5,359 acres of farmland, which include almonds, pistachios, alfalfa and vegetables, 1,036 acres are devoted to wine grape production. That presumably placed the company in the Alcohol and Tobacco sector.
The shares are no higher today than they were in 1985. They have been as much as 3x higher, but not an awful lot lower. The price volatility simply reflects the periodic positive publicity that develops around the three master planned communities, followed by disappointment as the proposals work their way through repeated regulatory review, litigation and negotiation phases. One could say that this process, which requires much ongoing entitlement and litigation expense, is much closer to actualization than it ever has been, but it remains in equipoise. That is the way of land development.
With or without those final approvals, though, the company would appear to be at the beginning of an earnings inflection point. Leasing activity at its industrial and commerce center has been sufficiently robust and reached a certain critical mass as to be reflected in pricing: per square foot land prices have increased at a 20% annual rate in the past five years, and industrial rents at a 23% rate.
Gladstone Land Speaking of the Tejon Ranch farmland, this is an intriguing asset class that one might want exposure to. At least in principle. Gladstone is one of two publicly traded farmland companies. It owns over 115,000 acres of farmland, across 169 farms in 15 states. Unfortunately, it suffers the REIT growth limitations.
For the positives, there’s no operational expense in leasing; the farmer is responsible for capital expenditures such as farm equipment. The property owner merely supplies the land and obtains rent. If the prices of agricultural products rise, as during an inflationary cycle, the land should become inherently more valuable. U.S. cropland values rose from $3,350 per acre in 2012 to $5,050/acre in 2022, 19 which is a 10-year appreciation rate of 4.2%, well above the CPI inflation rate. There are vas expansion possibilities via acquisition: there being about 2 million U.S. farms, aggregating almost 900 million acres. 20
There are challenges in expanding, though. One is that a significant part of the economic return from farming is the appreciation of the land. If a farmer is not able to benefit from that, the appeal of leasing a farm is greatly reduced. The other growth challenge is that Gladstone is a REIT, as is the other company, Farmland Partners.
The limitations of the REIT form of real estate investing were reviewed earlier. The history of Gladstone, which had its IPO almost exactly 10 years ago, in January 2013, illustrates.
- On the growth and investor return side:
- In March 2013, Gladstone owned 12 farms with a total of 1,631 acres. It’s acreage today is 71x greater. Revenues rose 26-fold, from $3.4 million to $89 million.
- Shareholders received $16 in dividends since it came public. The initial share price was $15, so the average yield on the initial price has been 4.1%. Unfortunately, the stock price today is only $16, so the entirety of the return has been yield.
- The company estimates the fair value of its real estate holdings is 14.4% above their net cost basis. Via that measure, it has captured 1.4% annual land appreciation.
- On the financing side:
- Gladstone had 6.530 million shares when it started, today it has 5.5x as many.
- Debt and preferred stock equal 71% of assets, and interest expense is about 50% of operating income. It produces accounting net income, but negative free cash flow after paying preferred stock dividends.
Much like Kimco, reviewed earlier, the REIT structure often seems to be a vehicle to raise substantial quantities of external capital from equity investors and lenders, and convert it into dividend distributions. Unfortunately, with much of the potential growth gets transferred to the financiers as equity offering fees and interest expense. Growth can be had during periods of high equity valuations when new shares can fund accretive acquisitions. But that growth is an episodic function of capital market pricing, not the business model, and the debt incurred engenders significant cyclical risk.
In contrast, Acadian Timber Corp., which is in some portfolio strategies, is the exception to the growth limitations of REITs. It is a Canadian company that, under new regulations converted, on Jan. 1, 2010, to corporate form, having previously been an Income Trust. Its policy has been to distribute substantially all of its free cash flow, even more so than many REITs. Acadian Timber is an interesting study candidate, since there has been almost no complicating corporate activity.
Timberland REITs can capture the inflationary benefit of land ownership. One reason is that, like the corporate-form land companies and homebuilders, they already own vast tracts of land, so don’t have to buy more. Secondly, although they must distribute most of their income, they contain an inherent source of internal growth: timber grows by a few percent each year. There is virtually no input cost of that growth, since it is created almost exclusively by…solar power. In fact, trees are probably the only large-scale commercial use of solar power that doesn’t require energy-conversion capital equipment like solar panels.
The timberland business model difference with the overall REIT asset class is statistically obvious with time.
Acadian Timber owns and manages 2.387 million acres of timberland in Maine and New Brunswick, Canada. This figure hasn’t changed in the 13 years since year-end 2009. The share count is only 0.9% higher, and much of the increase is from the largest shareholder, who takes much of the dividend in kind, as additional shares.
The shares have appreciated at a 7.1% annual rate since year-end 2009. Unfortunately, this is not indicative of the long term growth rate of timber, but reflects equity valuation changes as well. A decade is simply not enough time to normalize for that. This reflects, again, the difficulty in locating publicly traded land companies of long and unaltered character.
The dividend distributions, though, do reflect the economics of the property. The cumulative dividends over the 13.25 years through March 2022 have been $12.59/share. Relative to the initial share price of $6.35, that’s an average yield of 15.0%. Experimentally, if the share price hadn’t changed, the total value realizable today would be $6.35 plus the $12.59, which would be an 8.6% annualized return on investment. Only another 1% or 2% annual increase in land value would be sufficient for a 10% rate of return. The current dividend yield is 7.37%, which also doesn’t require much inflation-capture value from the land and its timber to reach 10%.
Land Discussion Afterword
With just the four companies— TPL, PrairieSky, Tejon Ranch and Acadian Timber—one can have an interest in 21.8 million acres of land in the U.S. and Canada. It’s an extraordinary scale of exposure. Add in just two more—St. Joe Company, in northwest Florida, and Rayonier, another timber REIT—and you’re up to 24.8 million acres. If it were a square, it would be 200 miles on a side. If the square were surrounded by a ring road, it would take almost 24 hours to drive around it. As a valuation metric, that’s probably not useful. Nevertheless, it is 24.8 million diversified acres of an inherently inflation benefitted perpetuity asset.
The joint stock market value of these six companies is $23.5 billion. Does that seem like a lot?
- It works out to about $950 an acre. That’s probably a meaningless valuation metric. While much of this acreage has substantial industrial, commercial and residential housing development, and substantial mineral royalty income and other operating assets on it, much of it is prairie scrubland and unexplored timberland. On the other hand, we’ve seen what prairie or desert scrubland can do over a half-century or so.
- Another approach: that massive resource can be compared with a single publicly traded company that has land on its balance sheet: Lennar, the homebuilder. While Lennar has $7 billion of land, it is in “Inventories,” along with $12 billion of finished and partly-finished homes. This inventory is turned over fairly rapidly, since annual revenues are $32 billion. Lennar’s $4-plus billion of earnings, which are the basis for its stock valuation, is from processing and selling that land. Moreover, over a quarter of that inventory is not actual land, just options to buy land. In the aftermath of the housing crisis that commenced in 2006, the company had to write down over $2 billion of land and land options because, by accounting definition, they are short-term assets; there is no scope whatsoever to let it compound over time. All by itself, Lennar has a $32 billion market cap, a third greater than the 38,000 square miles of land and operating profits embodied by the aforementioned companies. And yet, even Lennar is only an 8-basis-point position in the S&P 500. Not one of these land companies is in the S&P 500. Even if they were, their combined index weight would be about 5 basis points. Surely, in the dominant equity index, which is purported to be roughly representative of U.S. economic activity, they should have a greater weight. If, for verisimilitude, the index were to be adjusted by proportionate land area, that 24.8 million acres are 1.3% of area of the 48 contiguous states—yes, I know we’re squeezing in a bunch of Canadian acreage. Surely, the S&P 500 can allocate a few basis points for the non-correlated, economically significant land sector. As an aside, this is not to suggest that Lennar might not be a good investment. The homebuilders have dramatically improved their balance sheet liquidity since the housing crisis, and trade at single digit free-cash flow multiples. As business models, they have little relationship to land companies.
Gold and Cryptocurrency Questions
- Coordinated regulatory hits against crypto currencies, in conjunction with Fed Now and Digital Euro rollouts later this year?
- Comments on gold vs. bitcoin?
- Bitcoin and the discount pricing of the Grayscale Bitcoin Trust
Regulatory Environment for Cryptocurrency This topic could take up an entire Quartey Commentary. A highly abridged answer as to the threat that regulation poses can be told in pictures, as follows:
CME Group is the largest U.S. securities exchange, measured by its $65 billion market cap. At least today, since it trades places with the Intercontinental Exchange (ICE), depending on their stock prices. Note, in the accompanying web-page excerpts, its many futures and options products for bitcoin and ether (the Ethereum token) including micro futures contracts. The recent open interest in CME’s bitcoin futures contracts is $2.1 billion.
This could not happen without a detailed, exhaustive review and approval process with the U.S. government, specifically through the Commodity Futures Trading Commission. The latest such formal approval process, for permission for modifications to an existing bitcoin and ether Euro denominated futures product, can be seen in the accompanying notification letter to the CFTC dated two weeks ago.
ICE also has a suite of bitcoin futures products. In the news, much of the concern about cryptocurrency, particularly following the after-effects of the FTX collapse, is around the prospect of regulating them. But, of course, the CME and ICE are already highly regulated.
The incumbent securities exchanges are the standard for tightly controlled trading and clearing, having survived over two centuries of depressions, wars and financial crises. They are in favor of better regulation, not fearful of it, since it would redound to their competitive benefit. ICE founder and CEO Jeffrey Sprecher recently said as much:
NEW YORK, Dec 6 (Reuters) Most cryptocurrencies will likely be regulated under existing securities laws following crypto exchange FTX's collapse, and traditional players like the New York Stock Exchange may move into tokenized trading, the head of NYSE-owner Intercontinental Exchange Inc ( ICE .N) said on Tuesday.
"They're going to be regulated and dealt like securities," said ICE Chief Executive Jeffrey Sprecher. "What does that mean? It means more transparent, it means segregated client funds, the role of the broker as a broker-dealer will be overseeing and the exchanges will be separated from the brokers. The settlement and clearing will be separated from the exchanges."
Mr. Sprecher properly cited the segregation of client funds. In September 2020, with NY State Dept. of Financial Services approval, an ICE subsidiary was deemed a qualified custodian—that’s called regulation—and started to custody bitcoin for physically delivered futures.
But, are there any institutions for the safe custody of client funds that have withstood the test of time? Bank of New York, now BNY Mellon, will sound familiar. Aside from being the oldest bank in the U.S., it’s the world’s largest custodian bank. In October 2022, it announced that it would be able to custody and transfer bitcoin and ether.
Of course, this could not occur without the regulation and approval of the U.S. Treasury, through the Office of the Comptroller of the Currency.
As to the competitive or obsolescence threat of any government run digital money or digital instant payment systems, this fear might be based on a misunderstanding of the term cryptocurrency, the overly broad use of which encompasses radically different and even opposing themes and purposes.
Of the many thousands of them, there are only a handful that have a fixed-issuance monetary policy, like bitcoin, bitcoin progeny like Litecoin, and possibly a few others. The other—and this is pretty accurate— 99.9% of cryptocurrencies have no such monetary policy and offer no currency debasement protection. There is much potential value, most particularly in a nation and world on the path to a phase of serious monetary debasement, in a strong, non-inflationary currency. Since it is the central banks that would be in control of any government money, irrespective of whether it’s called digital or not, a government cryptocurrency could not have the ‘full faith and credit’ of the populace who rely on that money for their savings and safety. That’s the very point of Bitcoin.
As to instant payment services, that was not the purpose for which bitcoin was designed, nor the purpose for which the largest owners hold it. Other cryptocurrencies, including fixed-issuance cryptocurrencies, are designed for more rapid, scalable transaction processing.
Gold vs. Bitcoin
The response to the question depends on the purpose of asking for the comparison. If it’s about existential safety, such as during social unrest or war, that’s a different set of considerations than if the question is about purchasing power protection. For the geopolitical unrest scenario, so long as the internet functions, bitcoin is the most transportable form of wealth, since it is borderless and instantaneously transferable. But if the circumstance is so dire that even the internet doesn’t function, which would be pretty dire, then gold is a millennia-known and trusted medium of exchange. But it is not highly transportable, particularly when there is confiscation risk. If a million dollars is what you need, that’s about 35 pounds you can heft in a sturdy knapsack, so long as you feel you can maintain possession of it during your travels. It would be hard to hide. For that purpose, diamonds are the hard-commodity choice for transportability, since they have the greatest value density: a million dollars of high-grade diamonds might weigh a couple of ounces. There are collectibles, too, like rare stamps.
If the question is about the potential returns of gold vs. bitcoin, it needn’t be a one-or-the-other choice. There are always tradeoffs. If stocks are a benchmark for gold returns, the accompanying table shows comparative results from the year 2000, which was the start both of the stock market’s indexation bubble era and the most stimulative monetary policy in the history of civilization. If one knew at the beginning of the 21 st century that interest rates would decline to essentially zero, one would have anticipated earning outlandishly high rates of return in financial assets.
The first surprising observation is that the stock market produced a decided single-digit annual return. Second is that gold was surely competitive with the S&P 500, including for the 50pl period from 1971 when the government stopped fixing the price at $35 an ounce. For a true comparison, the stated equity returns must be adjusted downward, because a good 35% of the ostensible return of the S&P 500 came from dividend payments, which in real life are subject to income taxes. A holder of gold, which doesn’t distribute dividends, has yet to pay any taxes on the investment. Tax is due only when the asset is sold.
Trying to understand the past returns for predictive purposes, it is interesting that total government outlays during the past 22 years have risen at about the same rate as the S&P 500’s single-digit annualized return, and the Federal Reserve’s balance sheet assets rose at twice that rate. Government spending is spread throughout the economy. It buys everything from toothbrushes and combat boots to airplanes, fuel and computers, and rents copious amounts of office space, which necessarily impacts corporate profits and stock prices. One might wonder whether the S&P 500 is really a functionally different index or whether it is just beneficiary form of growth in government spending.
As to gold’s historical performance, as a commodity, the long-term price must incorporate the long-term increase in the cost of production. If the cost of production rises, then so long as people desire to hold it, the price must rise, too, otherwise none will be mined. The irony is that the fiscal and monetary forces that contribute to higher corporate profits also contribute to increases in the input prices that cause gold to rise in value. Another irony is that an asset that consistently produces returns quite competitive with equities is not well represented in investment portfolios.
A very significant investment is required to produce gold. If it were too easy to produce, inflation would occur even in a gold-based monetary system. In order to be noninflationary, a successful monetary system must have a very significant issuance cost. This is why gold has survived 5,000 years of perpetual challenge as a monetary system, despite all its monetary imperfections and rigidities.
The great concern about gold, though, and where it falls short relative to bitcoin, is what happens when there is a sudden, large market price increase. If the price significantly exceeds the cost of production, it is likely that the supply of gold will rise disproportionately more than the demand. The excess supply results in a follow-on price decline.
This is why we prefer, for investment return purposes, a hard asset business , like a royalty company, because it generates earnings and cash flow even when the price of gold declines. Moreover, those are the periods when the royalty company can buy new royalty contracts on more favorable terms, benefitting future earnings growth. This question, though, seemed to be more about the value of gold or bitcoin in some ‘ultimate’ circumstance. Gold can be transported across a border; shares of Franco Nevada, as a digital notation in the computers of custodian bank, can’t.
The supply of bitcoin won’t change from its programmed finite supply. It maintains its monetary scarcity. Its ultimate total market value can only be mediated by its price, since the volume can’t be altered. Therefore, if its eventual market value will be comparable to that of other accepted mediums of exchange, the investment return would be incomparably greater than gold’s.
Grayscale Bitcoin Trust
If the question is about pricing, the Trust traded at a 40% discount to its net asset value on April 24 th . In December, it was nearly 50%. So, you’re not buying a dollar for 60¢, but you are buying a bitcoin for 60 percent. If nothing else happens, other than that the discount closes, then you earn a 67% return. That might occur without an obvious catalyst, other than investors realizing that bitcoin’s value is unrelated to the FTX collapse or other financial mis-dealings, or that the government won’t outlaw or suppress bitcoin.
Or there might be the specific catalyst of the approval of a bitcoin ETF. If it takes two years to occur, it’s almost a 30% annualized return.
There’s a steeper discount for the Grayscale Litecoin Trust, which is 47%. All else equal, the return to NAV would be 88%. Litecoin is one of the handful of cryptocurrencies that has the same monetary policy as bitcoin, so they should, in that respect, be comparably valued.
Civeo Corp. Question
This is the provider of remote-location temporary housing facilities, such as for pipeline construction and mining projects in places like the Australian outback and the Canadian equivalent. The reason for the question, no doubt, is that at the end of February, over the course of two days, the share price dropped from $32 to $22. Naturally, I was asked about it at the time. Unlike the review of AMD or TPL, which took a bit of time, this consumed perhaps a couple of minutes. My internal response, released here is:
Not at my desk right now, but did skim through the earnings release and earnings call transcript, and saw nothing out of the ordinary. Except that 1 million shares traded today, versus typical daily volume of 30,000 shares. 1 million shares are over 7% of the outstanding shares. Adding in yesterday's 111,000 shares that's about 9% of the share base. I'd say there's more information content in that than in the financial results: did some institutional investor or fund finally throw their hands up? Was one fund manager replaced with another? Who knows?
Before this week's share price decline, the company traded at about 10x free cash flow. So, now it trades at a decided single-digit free cash flow multiple, and this for a company that, with its cash flow, repurchased in 2022:
- about 10% of its share base, and/or
- expended about $30.6 million on share repurchases, equivalent to about 10% of its market cap last week, if the market cap is priced at $30.50/share.
CVEO is provides a diversified form of asset-light exposure to the base metals mining/oil & gas drilling/liquids pipeline sector, Australia and Canada-based activity, which is a long-term inflation vector. This can be had at a single digit multiple of free cash flow. What that suggests, is that the company can earn double digit annualized returns merely by repurchasing its shares.
Texas Pacific Land Corp. Questions
Comments about the TPL April 17 th court case? Board of Director issues.
As to comments about the TPL court case, we are not at liberty to say much about the ongoing litigation, nor would it be prudent. There is a website that makes the latest public court documents conveniently available, along with a raft of commentary by various TPL shareholders. This is not an endorsement of the site, with which we have no association—nor, of course, do we post on it—or of the organizer, whoever that person or persons might be, merely a word about a kind of resource. It is not, it should be said, a balanced forum, since all of the commentary seems to take only one side of the debate, but there is factual original-source data there that should be edifying, including our arguments, as laid out in the pleadings and briefs, and a few decisions by the judge. The site is www.tpltblog.com.
Potential impact of M&A activity in the Permian Basin on any Horizon Kinetics holdings
The question is probably sparked by ExxonMobil’s $50+ billion bid for Pioneer Natural Resources, and there have been a few other multi-billion-dollar acquisitions in recent months. Acquisition activity of scale has been occurring in the Permian Basin for some years now, so in that sense, it’s nothing new. The question might have been why there has been so much sustained acquisition activity.
The shorter answer is that Japan is now going to buy oil from Russia, and Saudi Arabia will now be selling oil to China, as will Iran. Under the terms of dozens of agreements signed with China, Saudi Arabia will dramatically increase its imports from China, and pay for those goods with oil that China needs. There is the matter of the Russian war with Ukraine and reduced purchases of oil by the West. Meanwhile, China has lifted the Covid 19 pandemic period growth restraints from its economy.
These factors all spell a global oil supply challenge for the Western nations. As should be familiar from past Commentary discussions, the time required for the energy sector to make the physical investments to sustainably increase production to equilibrate for any supply diversions would require enough years that “decade” would probably be a better measurement unit. Particularly given the political constraints against expansion. Taking that into consideration, it should be no surprise that the U.S. energy sector consolidation is heading toward oligopoly territory.
There are much greater ramifications for the U.S. dollar and the balance of geo-political-economic power, which time doesn’t permit. This might feature in next quarter’s Commentary. The accompanying table says a lot about that.
In June, the current BRICS nations—Brazil, Russia, India, China and South Africa—will meet to discuss accepting the applications to join by 13 additional nations. The last time a new member was admitted was 2010. All of these are sea-change-scale developments that have implications, from a U.S. and Western nation perspective, for an alternative global reserve currency, access to oil and other global commodities, and more. The 3.5 billion population of the countries listed in the table is about 44% or the global population.
Disconnect between oil and gas supply demand fundamentals and energy equities
The valuations of equities wax and wane with the animal spirit—described by many of the most renowned investors in unflattering terms—of the crowd. Eventually valuations come into some rational association with economic value. In the case of energy companies, there is little doubt that the divergence is presently great, and little doubt that the animal spirits will eventually converge with reality.
Footnotes1 www.federalreserve.gov/releases/h8/current/ 2 U.S. office vacancy rates by quarter 2017-2022 | Statista 3 Ritter, Jay. “A Review of IPO Activity, Pricing, and Allocations.” The Journal of the American Finance Association , 17 Dec. 2002 (Updated 5/27/2022), pp. 1795–1828. 4 The CRSP value-weighted index of Amex, Nasdaq and NYSE listed stocks. 5 What Happens to IPOs Over the Long Run? | Nasdaq 6 In this instance, small-cap companies were indexed to the Russell 2000, large cap companies to the S&P 500. 7 Peter Bernholz, “Monetary Regimes and Inflation: History, Economic and Political Relationships. XI, 210 pp. Chelteam, UK: Edward Elgar Publishing, 2003. 8 www.usdebtclock.org, retrieved 3/18/23. This site sources this data from the U.S. Treasury 9 Gross profit less SG&A and R&D expenses 10 Ville de Paris: Population & Density from 1600 11 City of New York & Boroughs: Population & Population Density from 1790 12 The Land Report, Winter 2022 ( www.landreport.com) 13 https://investor.howardhughes.com/download/Summerlin+4Q+2022+vF.pdf 14 KIM was founded in 1958, vs. 1960 for SPG. It came public in 1991 v 1993. 15 https://www.txasfmra.com/wp-content/uploads/Market-Guide-2022-for-web.pdf 16 This is probably understated, since at the time of the original value of about $2/acre, the acreage included miners and mineral rights, for which the Trust received not insubstantial payments by operators. Without those miner assets, which were spun off in 1954, the original per-acre pure land value would have been lower. 17 Hicks Ranch Hioric Midland County Property 18 3202 W I 20 19 https://www.nass.usda.gov/Publications/Todays_Reports/reports/land0822.pdf 20 https://www.nass.usda.gov/Publications/Todays_Reports/reports/fnlo0222.pdf |
IMPORTANT RISK DISCLOSURES:The charts in this material are for illustrative purposes only and are not indicative of what will occur in the future. In general, they are intended to show how investors view performance over differing time periods. Past performance is not indicative of future results. The information contained herein is subject to explanation during a presentation. Certain of the material herein is intended to portray the general nature of investor communications provided by Horizon Kinetics from time to time to existing clients. None of the investments or strategies referenced should be construed as investment advice and just because one investment is appropriate for one account does not necessarily mean it is appropriate for another. No investments should be made without the analysis of, among other things, an investor’s specific investment objectives, which considers their overall portfolio and any income requirements. The accounts referenced herein pursue an unconstrained strategy – meaning they are not limited by capitalization, geogrhic region, or investment techniques. They generally primarily seek capital appreciation with a secondary objecti of income. Note that indices are unmanaged, and the figures shown herein do not reflect any investment management fee or transaction costs. Investors cannot directly invest in an index. References to market or composite indices or other measures of relative market performance (a “Benchmark”) over a specific period are provided for your information only. Reference to a Benchmark may not reflect the manner in which a portfolio is constructed in relation to expected or achieved returns, portfolio guidelines, correlation, concentrations, volatility or tracking error targets, all of which are subject to change over time. This material references cryptocurrencies, including bitcoin. Horizon Kinetics’ subsidiaries manage products that seek to provide exposure to bitcoin and other cryptocurrencies. The value of bitcoins is determined by the supply of and demand for bitcoins in the global market for the trading of bitcoins, which consists of transactions on electronic bitcoin exchanges (“Bitcoin Exchanges”). Pricing on Bitcoin Exchanges and other venues can be volatile and can adversely affect the value of the bitcoin. Currently, there is relatively small use of bitcoins in the retail and commercial marketplace in comparison to the relatively large use of bitcoins by speculators, thus contributing to price volatility that could adversely affect a portfolio’s direct or indirect investments in bitcoin. Bitcoin transactions are irrevocable, and stolen or incorrectly transferred bitcoins may be irretrievable. As a result, any incorrectly executed bitcoin transacons could adversely affect the value of a portfolio’s direct or indirect investment in bitcoin. Only investors who can appreciate the risks associated with an investment should invest in cryptocurrencies or products that offer cryptorrency exposure. As with all investments, investors should consult with their investment, legal and tax professials before investing, as you may lose money. The S&P 500 Index (“SPX”) is a broadbad index widely considered as a proxy for overall market performance. It is the property of Standard & Poor’s ®. This is not an offer to sell or a solicitation to invest. Opinions and estimates offered constitute the judgment of Horizon Kinetics LLC (“Horizon Kinetics”) and are subject to change without notice, as are statements of financial market trends, which are based on current market conditions. Under no circumstances does the information contained within represent a recommendation to buy, hold or sell any security, and it should not be assumed that the securities transacons or holdings discussed were or will prove to be profitable. Subsidiaries of Horizon Kinetics LLC manage separate accounts and pooled products that may hold certain of the individual securities mentioned herein. For more information on Horizon Kinetics, you may visit our website at www.horizonkinetics.com. The Core Value and Small Cap separate account strategies are managed by Horizon Asset Management LLC. Not all investors will experience the same holdings, returns or weightings as the corresponding composite. No part of the research analysts’ compensation was, is, or will be, directly or indirectly, related to the specific recommendatis or views expressed by the research analysts in this report. No part of this material may be copied, photocopied, or duplicated in any form, by any means, or redistributed withouHorizon Kinetics’ prior written consent. ©2023 Horizon Kinetics LLC ® All rights reserved |
Editor's Note: The summary bullets for this article were chosen by Seeking Alpha editors.
For further details see:
Horizon Kinetics Q1 2023 Commentary