TMUS - How To Allocate $50000 Among 10 High Yield Dividend Income Stocks And ETFs
Summary
- In this article, I will show you how you could build an investment portfolio that aims to reach a relatively high Dividend Yield.
- I will demonstrate how you could allocate $50,000 among 10 high yield dividend income companies and ETFs while achieving a broad risk diversification.
- The investment portfolio I have built for you reaches a Weighted Average Dividend Yield [TTM] of 4.34%.
- At the same time, the selected picks have shown a Weighted Average Dividend Growth Rate of 11.18% over the past 5 years, thus promising future Dividend Growth.
Investment Thesis
The objective of this article is to show you how you could build a broad and diversified investment portfolio that aims to reach a relatively high Dividend Yield.
Furthermore, this investment portfolio seeks to provide you with some Dividend Growth to help you reach an additional goal: that the dividend payments you receive increase year over year at an attractive growth rate.
I will show you how you could reach these goals by allocating $50,000 among 10 high yield dividend income companies and ETFs.
Before I show you the companies and ETFs that I have selected, I would like to remind you of the pillars of my investment approach : my goal is to achieve a balance of the following factors when building a portfolio:
- Relatively high Average Dividend Yield of the companies
- Relatively high Average Dividend Growth Rate
- Attractiveness in terms of risk and reward
- Companies with strong competitive advantages that provide an economic moat
- Companies with strong financials
- Companies with a relatively high brand value
- Consumer familiarity with the products of these companies
- Attractive Valuation of the companies
- Aiming to achieve a relatively high Yield on Cost when having a long investment horizon
- Risk diversification across sectors and industries
These are the selected ETFs and companies that are part of this portfolio:
- Allianz ( OTCPK:ALIZF )
- Altria (NYSE: MO )
- British American Tobacco (NYSE: BTI )
- iShares Select Dividend ETF (NASDAQ: DVY )
- Realty Income (NYSE: O )
- Rio Tinto ( OTCPK:RTPPF ; OTCPK:RTNTF )
- Schwab Strategic Trust - Schwab U.S. Dividend Equity ETF (NYSEARCA: SCHD )
- Sociedad Química y Minera de Chile S.A. (NYSE: SQM )
- Verizon (NYSE: VZ )
- Zurich Insurance Group AG ( OTCQX:ZURVY )
When looking at the ETFs and companies I have selected for you in this article, you may wonder why half of the picks are from countries outside of the United States. However, if you look at the overview list and its percentage distribution that you can find in the table below, you will see that a large percentage is in fact invested in companies and ETFs from the U.S: both the iShares Select Dividend ETF and the Schwab Strategic Trust - Schwab U.S. Dividend Equity ETF invest exclusively in U.S. companies.
Overview of the selected ETFs and Companies
| Company |
| Sector |
| Industry |
| Country |
| Dividend Yield [TTM] |
| 5 Year Average Dividend Growth |
| Proportion |
| Allianz |
| Financials |
| Multi-line Insurance |
| Germany |
| 4.84% |
| 6.37% |
| 4.50% |
| Altria |
| Consumer Staples |
| Tobacco |
| United States |
| 7.79% |
| 7.89% |
| 2.50% |
| British American Tobacco |
| Consumer Staples |
| Tobacco |
| Great Britain |
| 7.17% |
| 4.94% |
| 2.50% |
| DVY - iShares Select Dividend ETF |
| ETF |
| ETF |
| United States |
| 3.31% |
| 6.98% |
| 35.00% |
| Realty Income |
| Real Estate |
| Retail REITs |
| Unites States |
| 4.44% |
| 3.93% |
| 4.50% |
| Rio Tinto |
| Materials |
| Diversified Metals and Mining |
| Great Britain |
| 9.33% |
| 23.65% |
| 4.50% |
| SCHD - Schwab Strategic Trust - Schwab U.S. Dividend Equity ETF |
| ETF |
| ETF |
| United States |
| 3.35% |
| 13.74% |
| 35.00% |
| Sociedad Química y Minera de Chile S.A. |
| Materials |
| Fertilizers and Agricultural Chemicals |
| Chile |
| 9.60% |
| 37.59% |
| 4.00% |
| Verizon |
| Communication Services |
| Integrated Telecommunication Services |
| United States |
| 6.41% |
| 2.08% |
| 4.00% |
| Zurich Insurance Group AG |
| Financials |
| Multi-line Insurance |
| Switzerland |
| 4.55% |
| 13.96% |
| 3.50% |
| Weighted Average |
| 4.34% |
| 11.18% |
| 100.00% |
Source: The Author, data from Seeking Alpha
DVY and SCHD already account for 70% of this investment portfolio. If we add the remaining U.S. based positions (Altria at 2.5%, Realty Income at 4.5%, and Verizon at 4%), it can be concluded that 81% of the total portfolio would be invested in U.S. based companies. 15% of the overall investment portfolio would be invested in European companies (Allianz at 4.5%, British American Tobacco at 2.5%, Rio Tinto at 4.5% and Zurich Insurance Group at 3.5%) and 4% in South America (Sociedad Química y Minera de Chile S.A.).
Source: The Author
At the same time, there is no Industry that has a higher proportion than 8% of the overall portfolio. However, there are Industries in this portfolio that I have overweighted. The reason being that the primary goal of this portfolio is to achieve a relatively high Dividend Yield and companies from certain Industries tend to pay a higher Dividend Yield due to the high Free Cash Flow they generate year after year: companies from the Multi-line Insurance Industry, the Tobacco Industry, the Integrated Telecommunication Services Industry, the Diversified Metals and Mining Industry as well as the Fertilizers and Agricultural Chemicals Industry can be named as examples.
Below you can find the industry-based allocation of the investment portfolio that I am presenting in this article.
Source: The Author
Some Sectors, such as the Information Technology or the Health Care Sector are missing in this investment portfolio. The reason being that this investment portfolio was built with the main objective of providing you with a high Weighted Average Dividend Yield. Most companies from the Information Technology or the Health Care Sector do not offer you a Dividend Yield that is at least as high as the Dividend Yield that SCHD (Dividend Yield [TTM] of 3.35%) or DVY (3.31%) already provide you with.
However, due to the fact that the majority of this portfolio (70%) would be invested in the previously mentioned ETFs, you achieve a broad diversification in regards to Sectors and Industries even though you do not invest individually in each industry.
Another company, which I consider to be an excellent fit in order to help you reach a broader diversification of your investment portfolio and to invest in different Sector and Industries, is Berkshire Hathaway (BRK.A) (BRK.B) However, since the company does not pay a dividend, it is not part of this portfolio.
Allianz
When looking for companies that can provide you with an attractive Dividend Yield, Allianz is a great choice in my opinion: the company not only provides shareholders with an attractive Dividend Yield [TTM] of 4.84%, but it also offers Dividend Growth. The company’s Dividend Growth Rate 10Y [CAGR] has been 6.88%. Furthermore, Allianz has shown an Average EBIT Growth Rate [FWD] of 4.18% over the past 5 years, thus providing evidence that its growth perspectives are intact.
At this moment of writing, I consider Allianz to be fairly valued. Even though the company’s P/E [FWD] Ratio of 13.12 is slightly above the Sector Median of 10.41, I believe that Allianz should be rated with a premium when compared to other companies from the Multi-line Insurance Industry. This is due to both its broad product portfolio and strong brand image.
The company’s excellent competitive position within the Multi-line Insurance Industry is also underlined by the results of the Seeking Alpha Quant Ranking: Allianz is ranked 3 rd out of 10 within the Multi-line Insurance Industry and 12 th out of 666 within the Financials Sector. In the overall ranking, the company is ranked 72 nd out of 4759, which is an excellent position to hold.
Source: Seeking Alpha
Altria
Altria impresses investors with its enormous Profitability: the company has a Gross Profit Margin [TTM] of 68.56% and an EBIT Margin [TTM] of 58.82%. The company’s EBITDA Margin [TTM] of 59.91% is 445.70% above the Sector Median (10.98%). Meanwhile, its Net Income Margin [TTM] of 27.86% stands 598.06% above the Sector Median (3.99%). All of these metrics provide us with evidence that the company is an excellent choice in terms of Profitability.
In my opinion, Altria is currently an attractive buy: it has a P/E [FWD] Ratio of 9.34, which lies 54.26% below the Sector Median (20.42). Furthermore, it can be highlighted that Altria provides investors with a Free Cash Flow Yield [TTM] of 10.62%, which is 144.18% above the Sector Median of 4.35%. These metrics show additional evidence that its Valuation is attractive and that the company is an excellent risk/reward choice for investors.
Altria produces outstanding results as according to the Seeking Alpha Dividend Grades: the company receives an A+ rating for Dividend Growth, Dividend Yield and for Dividend Consistency. Only for Dividend Safety, does the company receive a C rating.
Source: Seeking Alpha
British American Tobacco
British American Tobacco provides shareholders with a Dividend Yield [FWD] of 7.60% and has a Free Cash Flow Yield [TTM] of 14.22%. Different metrics further indicate that the company is not only attractive in terms of a high Dividend Yield, but it’s also an appealing pick when considering Growth: the company’s Average EBIT Growth Rate [FWD] over the past 5 years has been 8.60% and its Average EPS Diluted Growth [FWD] Rate over the same time period has been 6.15%.
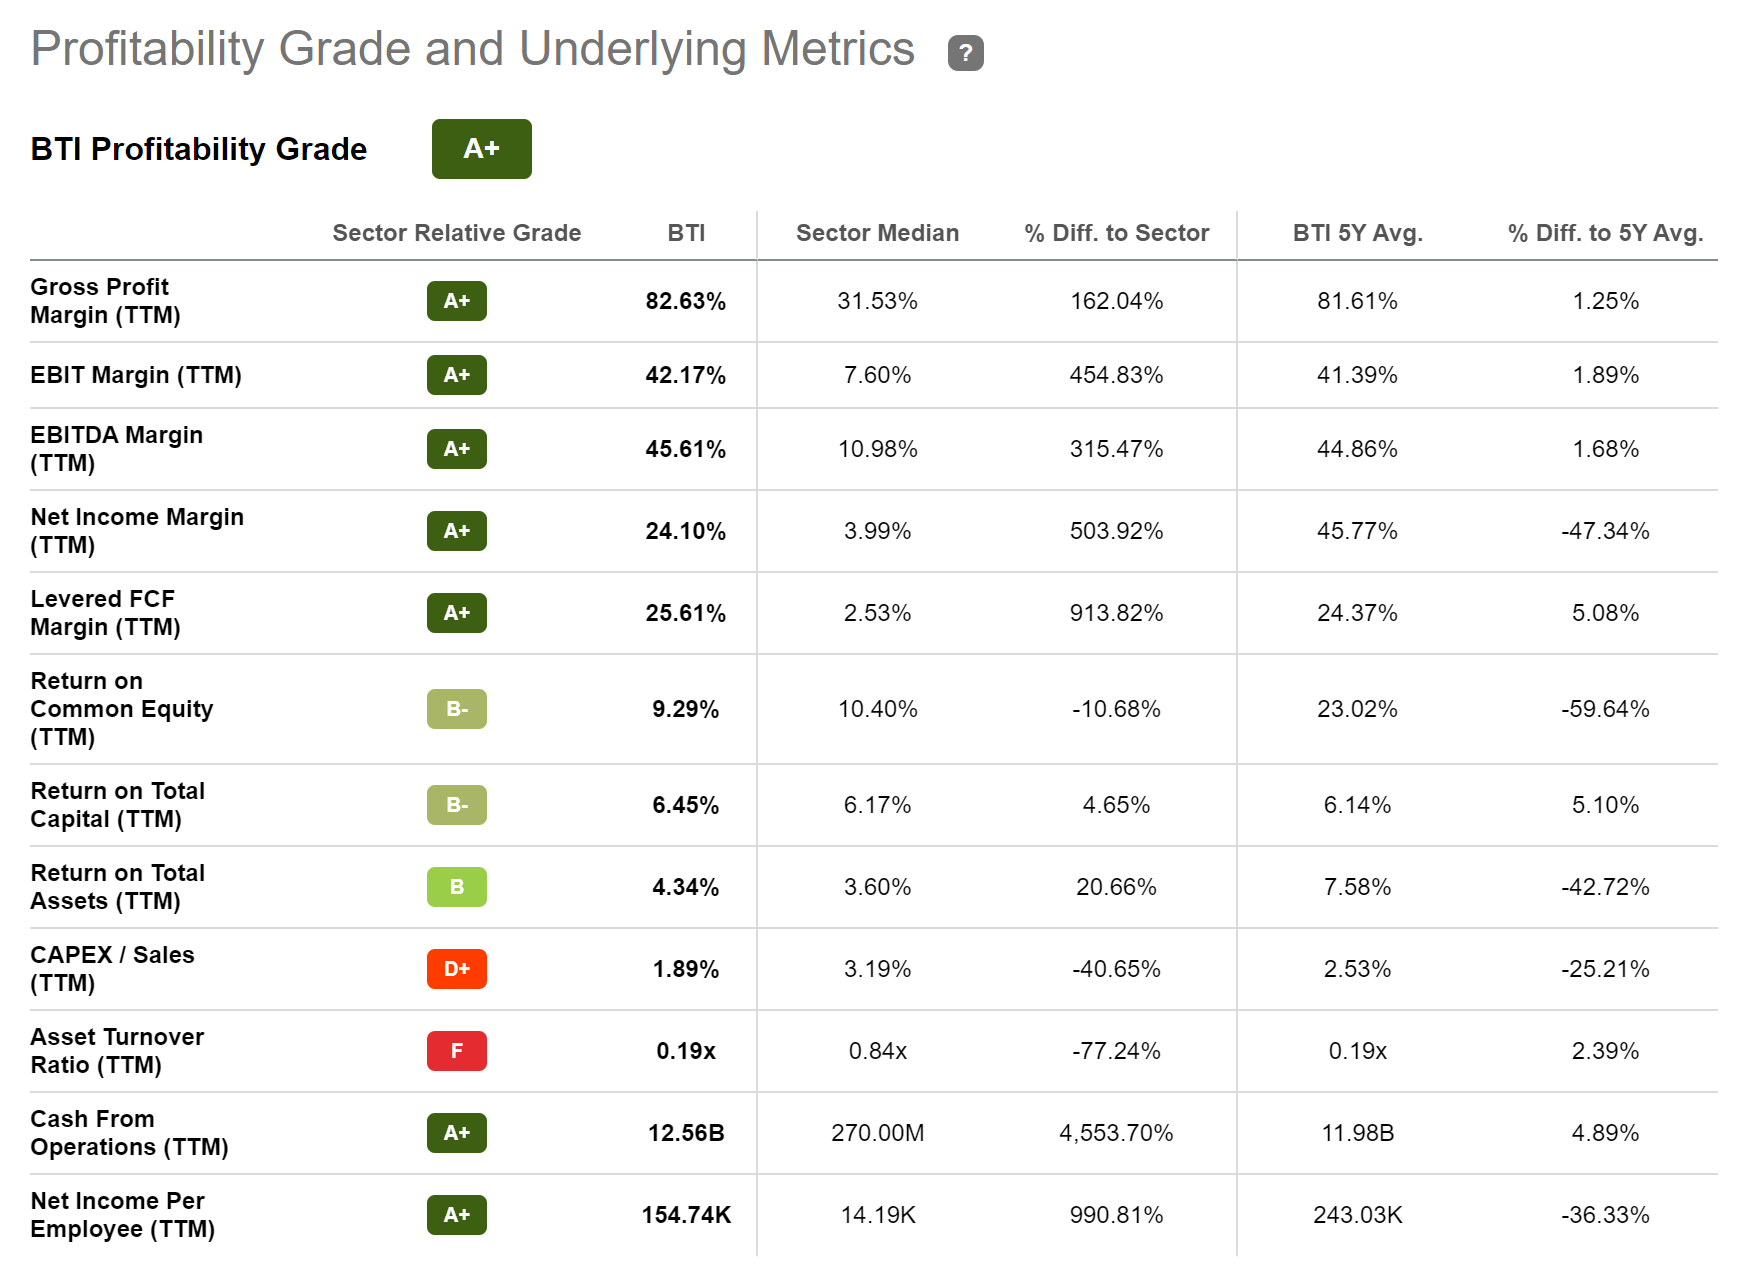
The Seeking Alpha Profitability Grades underline that British American Tobacco is an excellent choice in terms of Profitability.
I consider the company to currently be undervalued: proof of this is its P/E [FWD] Ratio of only 9.38, which is 54.04% below the Sector Median (20.42). The company’s Valuation is significantly lower than the one of competitor Philip Morris International (NYSE: PM ) (16.55).
DVY - iShares Select Dividend ETF
Those who have already read some of my previous Seeking Alpha articles, are aware of the fact that the DVY - iShares Select Dividend ETF is among my favorite ETFs due to a wide variety of reasons.
Its Dividend Yield [TTM] of 3.31% is 62.43% above the Median of all ETFs. The same is true for its 5 Year Dividend Growth Rate [CAGR] of 6.98%, which is 10.35% above the Median of all ETFs (6.32%).
When compared to its peer group, it can be highlighted that the Dividend Yield [TTM] of DVY is above the one of VYM (NYSEARCA: VYM ) (Dividend Yield [TTM] of 2.95%), DGRO (NYSEARCA: DGRO ) (2.28%) and SDY (NYSEARCA: SDY ) (2.49%).
The Expense Ratio of this ETF is 0.38%, which lies 20.83% below the Median of all ETFs, indicating that this particular ETF is attractive in terms of costs.
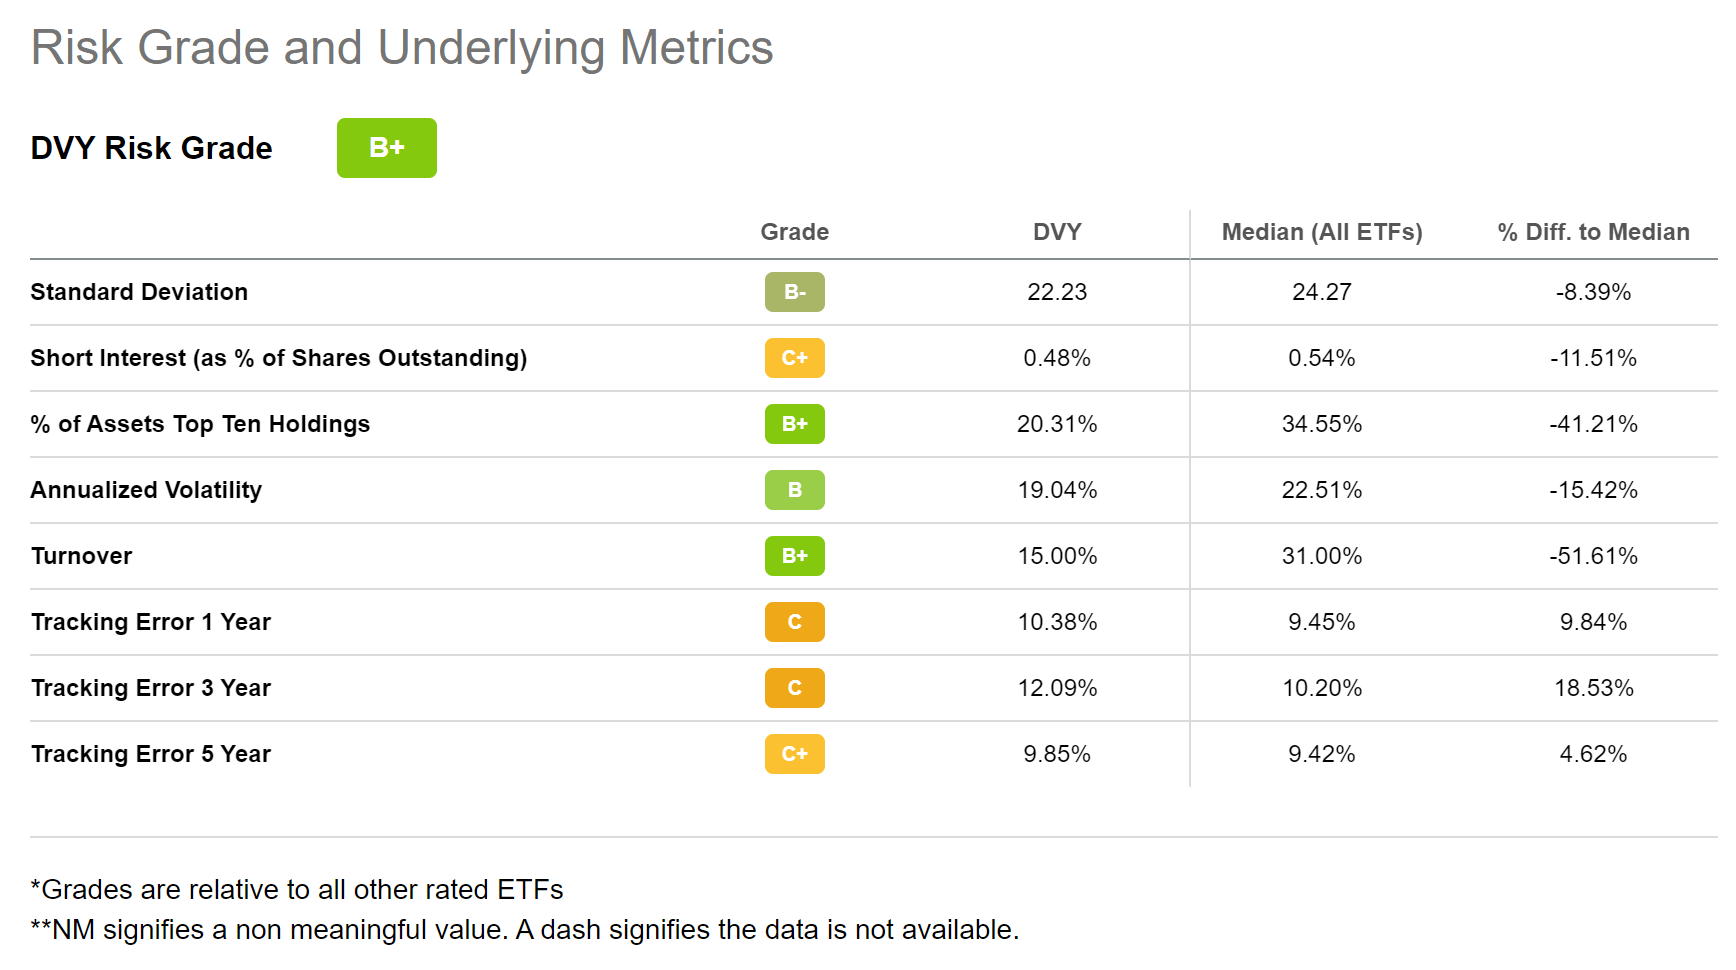
When having a closer look at the risk factors, we discover that the risks attached to an investment in this ETF are lower when compared to the Median of all ETFs. The Standard Deviation of this ETF is 22.23, which is 8.39% below the Median of all ETFs (24.27). Moreover, its Annualized Volatility is 19.04%, which sits 15.42% below the Median of all ETFs (22.51%). Both serve as indicators that the risk of investing in DVY is lower than the risk of investing in other ETFs. Below you can find the Risk Grades for DVY.
Realty Income
There are a wide variety of factors that underline my theory that Realty Income is a good fit for any portfolio that is built with the objective of providing an attractive Dividend Yield.
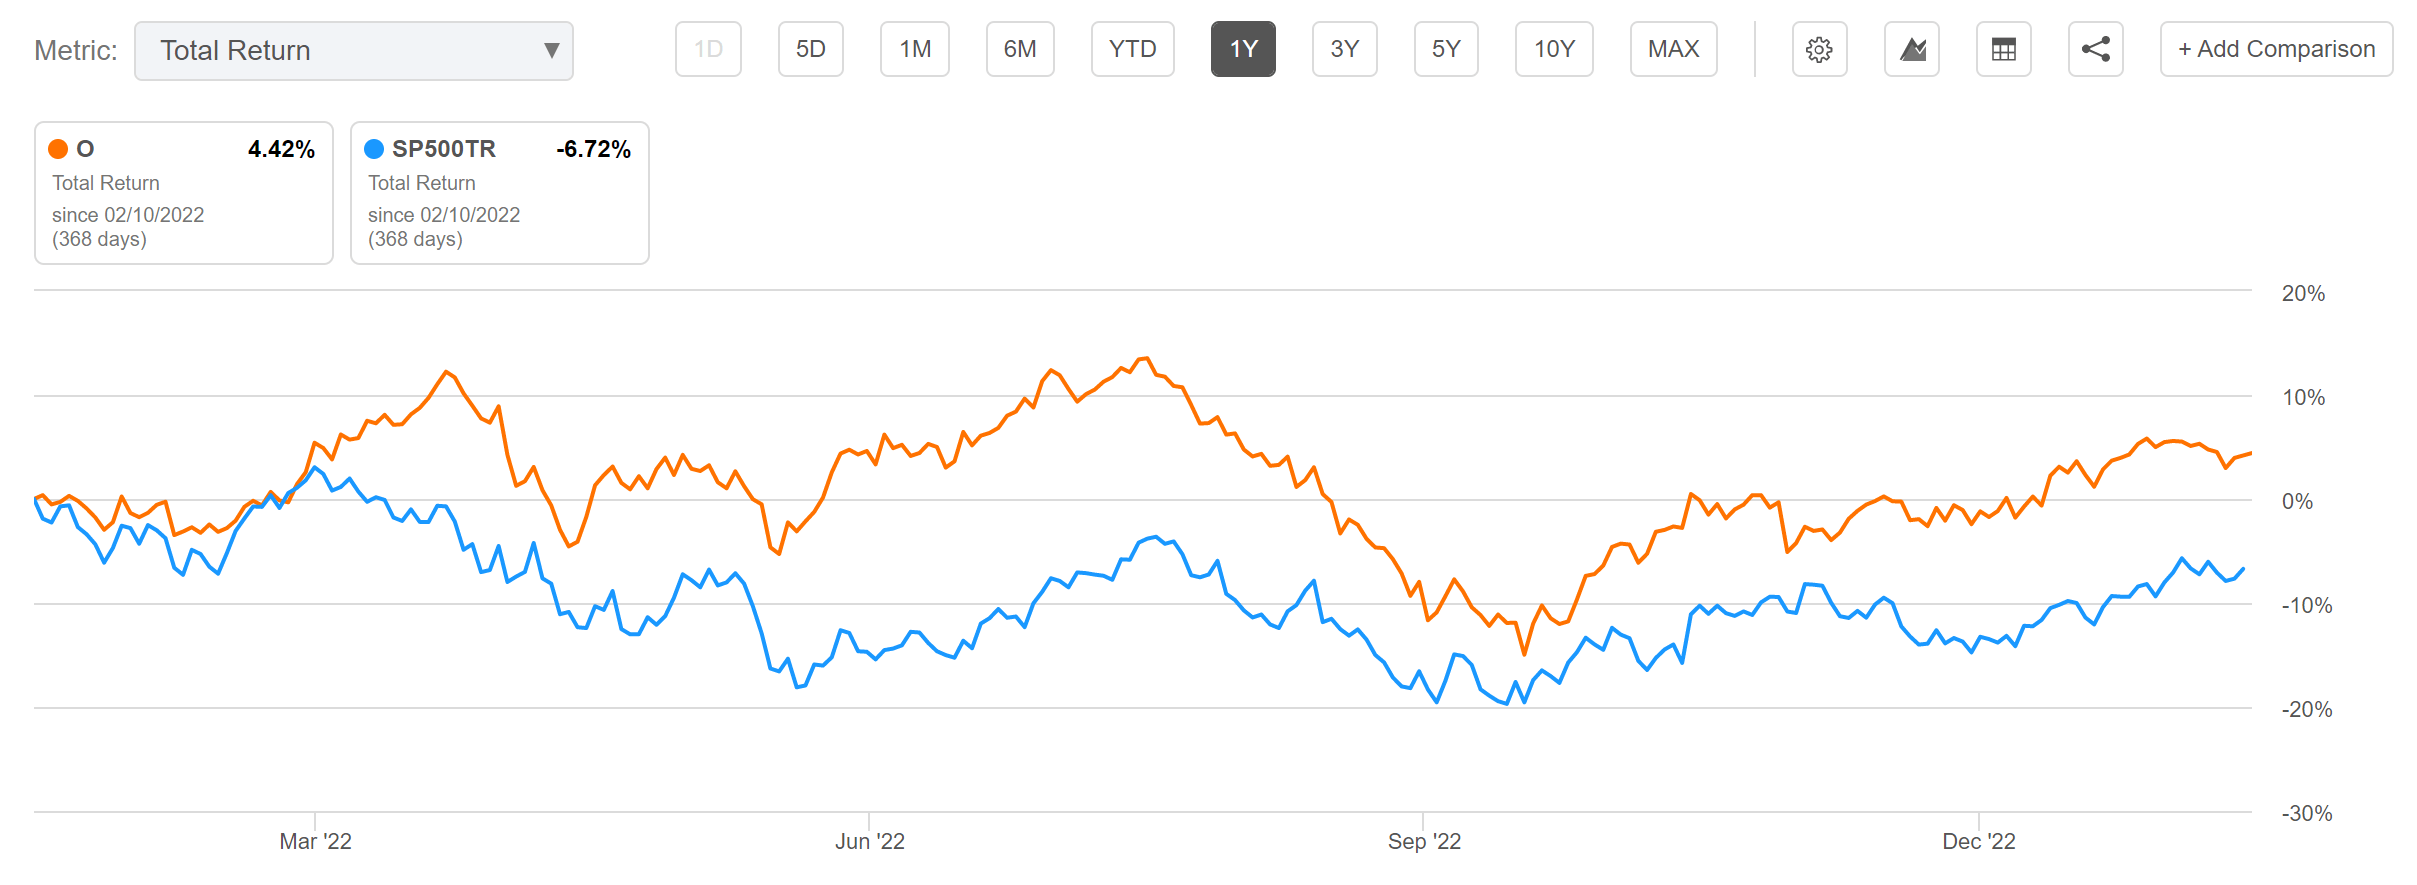
First, Realty Income’s current Dividend Yield [FWD] of 4.44% is relatively high. Second, the company’s Dividend is paid on a monthly basis, providing investors with a regular monthly income in the form of Dividends. Third, its Dividend Growth Rate [CAGR] over the past 10 years of 5.40% sits 71.41% over the Sector Median of 3.15%. At the same time, its Dividend Growth 5 Yr [CAGR] of 3.8% is above the one of other Retail REITs such as Simon Property Group (NYSE: SPG ) (-0.14%). Fourth, the company has shown 26 Consecutive Years of Dividend Growth, which strengthens my belief that it should be able to provide investors with Dividend Growth in the decade ahead. Fifth, the company’s low 24M Beta Factor of 0.63 is a strong indicator that it can help to decrease the volatility of your investment portfolio. The same is evidenced when comparing Realty Income’s Total Return of 4.42% within the past 12 month period while the S&P 500 has shown a negative Total Return (-6.72%).
Rio Tinto
Rio Tinto currently pays an attractive Dividend Yield [TTM] of 9.33%. Due to this, the company can contribute significantly to raising the Weighted Average Dividend Yield of this investment portfolio that I have built for you.
In addition to that, Rio Tinto has shown a Dividend Growth Rate 10Y [CAGR] of 15.24%. When considering the high Dividend Yield in conjunction with the company's high Dividend Growth Rate, I conclude that Rio Tinto is an attractive pick for this selection of dividend income stocks.
Rio Tinto has a P/E [FWD] Ratio of 8.47, which is below its competitor BHP Group Limited (NYSE: BHP ) (P/E [FWD] Ratio of 15.13), thus showing that the company is attractive in terms of Valuation.
Rio Tinto’s Average EBIT Growth Rate of 4.57% over the past 5 years further strengthens my belief that the company is also well positioned in terms of Growth.
The Seeking Alpha Factor Grades confirm that Rio Tino is an excellent choice in terms of Valuation (A rating), Profitability (A+) and Momentum (A-).
Source: Seeking Alpha
SCHD - Schwab Strategic Trust - Schwab U.S. Dividend Equity ETF
Another one of my favorite dividend paying ETFs is SCHD - Schwab Strategic Trust - Schwab U.S. Dividend Equity ETF. Similar to DVY, this ETF provides shareholders with an attractive Dividend Yield [TTM] (3.35%). In addition to that, it has shown 10 Consecutive Years of Dividend Growth and also a Dividend Growth Rate [CAGR] of 14.10% over the past 3 Years, which is 623.74% above the Median of all ETFs (1.95%).
SCHD has a significantly higher Dividend Yield [TTM] when compared to that of other ETFs such as VOO - Vanguard S&P 500 ETF (NYSEARCA: VOO ) (Dividend Yield [TTM] of 1.57%) or SPY - SPDR S&P 500 Trust ETF (NYSEARCA: SPY ) (1.53%).
SCHD’s Expense Ratio of 0.06% is 87.50% below the Median of all ETFs (0.48%), highlighting that the costs of this ETF are relatively low when compared to its peer group.
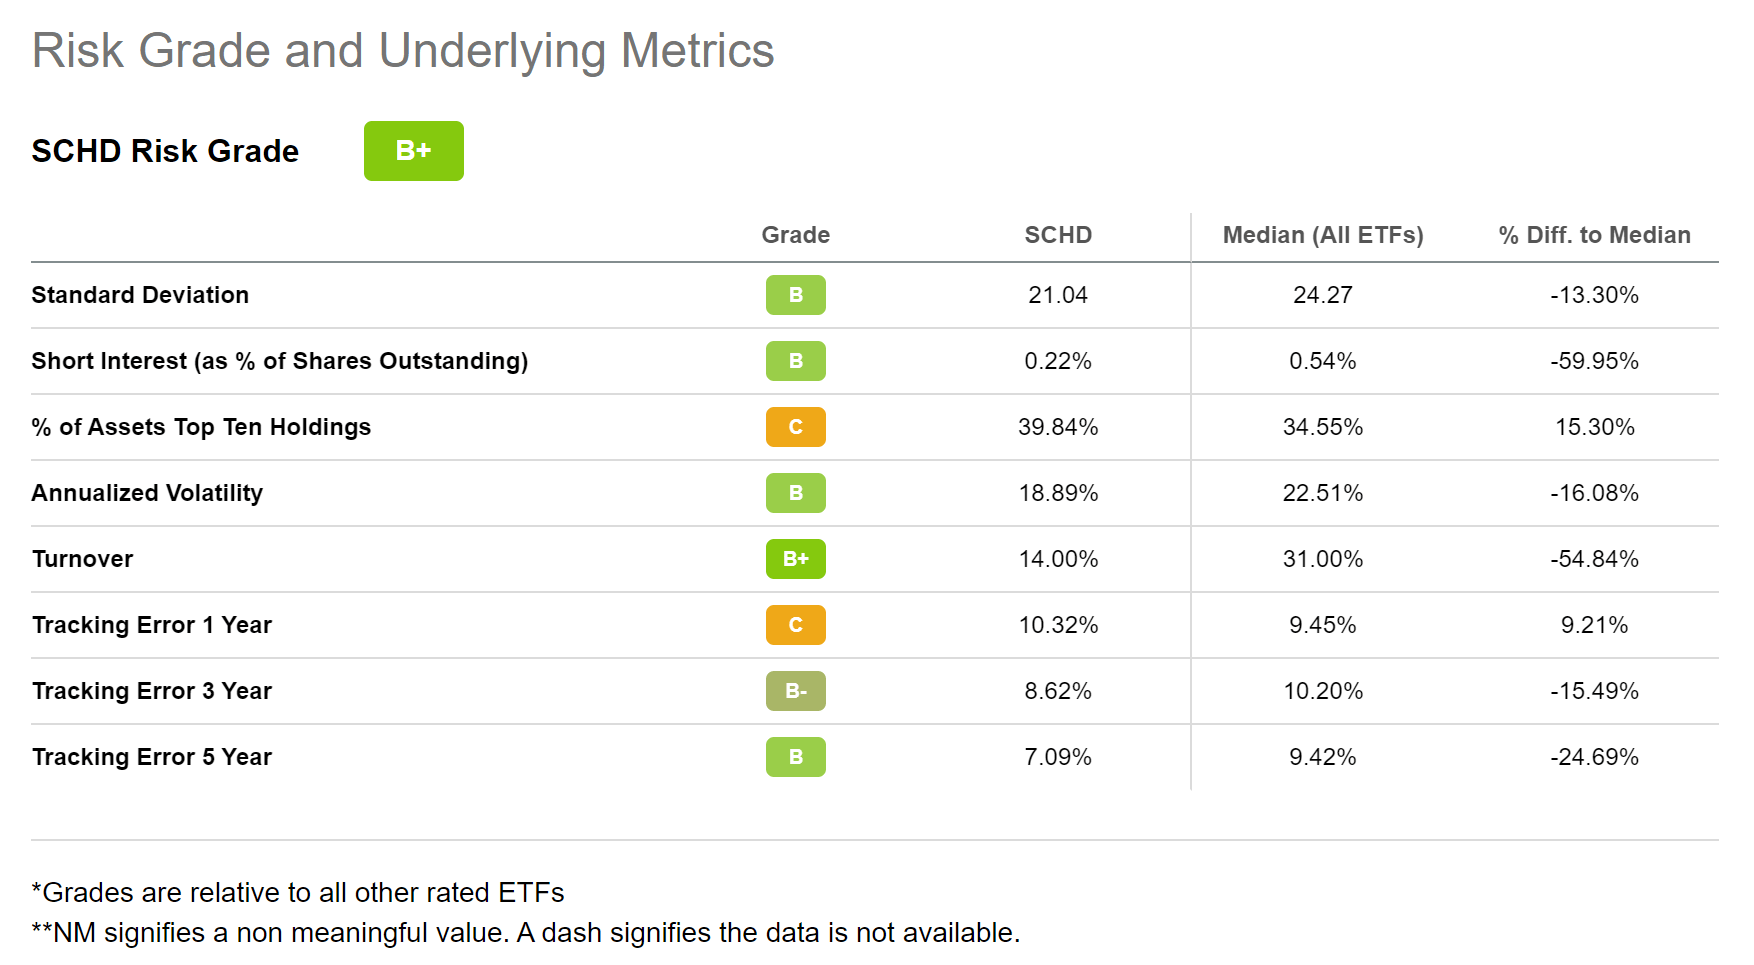
When taking a closer look at SCHD’s Risk Grades, it can be further highlighted that the risks of investing in this ETF are relatively low when compared to others. The Standard Deviation of 21.04 is 13.30% below the Median of all ETFs and its Annualized Volatility of 18.89% is 16.08% lower than the Median of all ETFs (22.51%), confirming that this ETF is an excellent risk/reward choice.
Sociedad Química y Minera de Chile S.A.
Sociedad Química y Minera de Chile S.A. currently pays its shareholders a very appealing Dividend Yield [TTM] of 9.60%. This high Dividend Yield is even more impressive when considering the company’s Dividend Growth Rate 10Y [CAGR] of 24.20% and its relatively low Dividend Payout Ratio of only 43.93%. In my opinion, the combination of these three metrics makes the company a very attractive choice.
In addition to that, the company has just been named as part of the Top 2023 Dividend Yield Monsters by Steven Cress, Seeking Alpha’s Head of Quantitative Strategies.
Moreover, with a P/E [FWD] Ratio of 6.80, the company’s Valuation is significantly lower than the one of the Sector Median (14.51). It is also 75.29% lower than its Average P/E [FWD] Ratio over the past 5 years. Furthermore, its P/E [FWD] Ratio is significantly below that of competitor Corteva (NYSE: CTVA ) (which has a P/E [FWD] Ratio of 24.35)
The company’s high EBIT Margin [TTM] of 51.79% is significantly higher than the Sector Median (12.91%), thus providing further evidence of its excellent competitive position.
The Seeking Alpha Factor Grades once again illustrate what an attractive choice the company is for investors: it is rated with an A+ for Growth and Profitability, with an A for Valuation, an A- for Revisions, while it gets a B+ for Momentum.
Source: Seeking Alpha
Verizon
Even though I admit that adding Verizon will not contribute to raising the Average Dividend Growth Rate of your portfolio (since its Average Dividend Growth Rate [CAGR] is 2.06% over the past 5 years), it is, however, still able to provide an attractive Dividend Yield.
At this moment, the company pays a Dividend Yield [FWD] of 6.41%, which makes the company an ideal fit for this portfolio, that is to provide you with a relatively high Dividend Yield. Verizon pays its shareholders a Dividend Yield [FWD] that is higher than its competitor AT&T (NYSE: T ) (Dividend Yield [FWD] of 5.82%).
Furthermore, it can be interpreted that the company’s current Payout Ratio of only 50% means that it should be able to provide you with at least some decent Dividend Growth in the coming years.
I believe that Verizon is currently undervalued: the company’s P/E [FWD] Ratio of 8.65 is significantly lower than the Sector Median of 17.22. Furthermore, its P/E [FWD] Ratio is significantly lower than its Average P/E [FWD] Ratio over the past 5 years (11.27). In addition to that, Verizon’s current Valuation is significantly lower than the one of competitor T-Mobile (NASDAQ: TMUS ) (21.25).
Verizon’s low 24M Beta of just 0.26 indicates that the company can contribute to reducing portfolio volatility, which further strengthens my belief to include it as part of this portfolio.
Zurich Insurance Group AG
Zurich Insurance Group AG currently pays a Dividend Yield [TTM] of 4.55%. Even though its market capitalization of $69.42B is below the one of competitors such as Allianz (market capitalization of $94.36B) or Axa ( OTCQX:AXAHY ) ($72.45B), the Swiss insurance company is still worth taking a closer look at: its Dividend Yield is significantly higher than other companies from this Industry such as American International Group (NYSE: AIG ) (Dividend Yield [TTM] of 2.07%) or The Hartford Financial Services Group (NYSE: HIG ) (2.01%).
The company’s Profitability is proven by its relatively high EBIT Margin [TTM] of 15.82% and its relatively high Return on Equity of 16.33%.
A 60M Beta of only 0.63 shows that you can reduce portfolio volatility by adding the company to your investment portfolio.
According to the Seeking Alpha Factor Grades, Zurich Insurance Group is rated with an A for Valuation, a B+ for Growth and Profitability, and a B- for Momentum.
Source: Seeking Alpha
Conclusion
The main objective of this article was to show you how you could build an investment portfolio that aims to reach a relatively high Dividend Yield.
At the same time, this portfolio aims to provide you with a broad risk diversification and with Dividend Growth, so that the Dividend Yield you reach can grow steadily year over year.
A broad risk diversification is achieved through allocating 35% to the DVY - iShares Select Dividend ETF and 35% to the SCHD - Schwab Strategic Trust - Schwab U.S. Dividend Equity ETF. At the same time, no Industry has a proportion of more than 8% of the overall portfolio. However, some Industries are overweighted since companies from some selected Industries, such as the Multi-line Insurance Industry, the Tobacco Industry or the Integrated Telecommunication Services Industry, tend to pay a higher Dividend Yield than companies from other Industries.
The portfolio I have built for you and presented in this article reaches a Weighted Average Dividend Yield of 4.34%. Furthermore, the selected picks have shown an Average Dividend Growth Rate [CAGR] of 11.18% over the past 5 years, which makes me believe that they should provide you with significant Dividend Growth in the future.
A major advantage of such a dividend income strategy is that you already receive a relatively high and attractive Dividend today and can then continuously increase it in the years ahead. This allows you to achieve a high Yield on Cost in the future. At the same time, it helps you to be more independent from the constant price fluctuations of the stock market.
Authors Note: I would love to hear your feedback on this article and to know which stocks are among your favorite high dividend yield stocks!
For further details see:
How To Allocate $50,000 Among 10 High Yield Dividend Income Stocks And ETFs