ARCC - How To Invest $1000 Per Month (November Edition)
2023-11-10 07:00:00 ET
Summary
- Business Development Companies are an important part of the U.S. financial system, providing loans to private companies and offering high yields to investors.
- TriplePoint Venture Growth is a small BDC with a focus on venture lending, offering high yields but with higher risks due to problematic loans.
- Hercules Capital is a unique and well-performing BDC with exceptional underwriting and a strong track record, making it a good investment option.
This article was coproduced with Williams Equity Research.
You may recall that in October I published an article titled, How To Invest $1,000 Per Month .
In the article, I stated that I would allocate 1,000 each month so that after 12 months there would be a total of 36 picks that include real estate investment trusts ("REITs"), business development companies ("BDCs"), master limited partnerships ("MLPs"), Dividend Stocks, Asset Managers, and other sleep well at night plays ("SWANs").
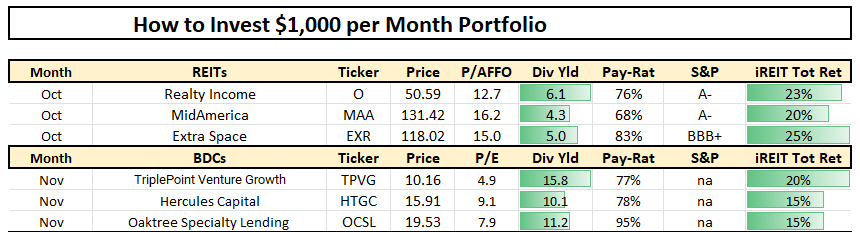
So, in October I picked three REITs:
iREIT®
Now it's time for Business Development Companies, or BDCs.
BDC Basics You Want To Know
BDCs are a key component of the U.S. financial system. Generally, BDCs make loans to private U.S. companies, though some BDCs specialize in a mix of debt and equity investments. We'll cover both types in today's article.
The Dodd-Frank Act coming out of the Great Recession severely restricted the big banks from lending to private companies. That opened the floodgates for BDCs. More recently, regional banks have suffered. Once again, their pain will be BDCs' gain long-term as businesses look to them for debt and equity investment.
Investors like BDCs for a few reasons.
First, like Real Estate Investment Trusts, they are required to distribute 90% of their taxable income to investors.
Second, their distributions are tax advantaged as the BDC doesn't pay corporate income tax.
Third, most BDCs tilt their portfolios toward floating rate loans. In some cases, floating rate loans are over 95% of a BDC's assets. In others, it may be as low as 50-60%. Either way, they offer moderate to high levels of protection against rising rates.
Many BDCs recently earned record profits is a testament to this. The last and most popular reason investors like BDCs is the high yield.
Even after posting strong share price appreciation compared to effectively all other fixed-income investments in recent quarters, most BDCs still yield between 9% and 11%.
For those that appear to yield lower, like Main Street Capital ( MAIN ), it's often an illusion.
BDCs that own larger percentages of equity capital, like Main Street, tend to pay consistent supplemental dividends. Don't forget to add those before calculating annual yields.
If you want to elevate yourself from an amateur to an expert BDC investor, there are lessons you'll need to learn. I'll include several in this article. To start, remember that BDC stock charts are misleading. An extremely common comment I read on BDC articles is:
But the share price of XYZ BDC hasn't gone anywhere in years, so it's a poor investment.
I don't agree with the premise to begin with, but even if I did, it's important to get past performance correct. Common and supplemental distributions won't show up in most charts.
It's possible for a BDC to go from $10 to $10.50 in a 3-year period and still generate double-digit annualized returns. That isn't the case with most stocks, hence the confusion.
Before we jump in, keep in mind that we are providing fact-heavy overviews of these three BDCs. These are not full-length deep dives, so don't be surprised if every relevant statistic isn't mentioned.
TriplePoint Venture Growth ( TPVG )
Small Market Cap, Massive Yield
TriplePoint is the smallest BDC we'll cover today, with a market capitalization of only $372 million. The company reported Q3 earnings on November 1st, so we have a strong grasp on its current operating and financial metrics.
What makes TriplePoint unique is its "venture" focus. Instead of lending and or investing in larger companies like Ares Capital (ARCC) and Blue Owl Capital ( OBDC ) are known for, TriplePoint lends and invests in much smaller companies.
That comes with positives and negatives. On the plus side, TriplePoint achieves among the highest yields on its investments of any BDC.
TPVG Q3 Presentation
NII stands for Net Investment Income, which is a rough measure of cash flow. By measuring NII over the asset base, we arrive at the approximate cash flow yield of the portfolio. TPVG's metric has increased from around 10% before rates took off to 20.0% in the most recent reporting period. This is among the best figures in the BDC sector.
That means TriplePoint has the potential to generate and support very high yields for investors. So, what's the catch?
There are two risks you should be aware of. First, problematic loans are higher than peers.
TPVG Q3 Presentation
I highlighted non-accruals for the past five quarters in orange. Non-accrual is the classification of a loan that isn't performing to the original terms. Sometimes that's if the company is only able to pay most instead of all interest owed.
In other cases, the borrower is still paying interest normally, but the BDC realizes that won't be able to pay off the loan in full on time. That's usually because the borrower's business and or liquidity has eroded.
This brings us to another important lesson. Non-accruals are problematic, but they rarely result in a total loss. If 10% of a portfolio is non-accrual, it's likely that 0.5%-3% of the associated principal value will be lost.
In a severe recession (e.g., Great Recession), a higher percentage of loans on non-accrual may become worthless. Remember that all BDCs use leverage, so the percentage of equity losses will be higher (double if the common 1.0x net debt to equity ratio applies).
In the second half of 2022, 3.3% of loans (based on their cost) were non-accrual, which is only marginally higher than the BDC peer average of 2-3%. Starting in Q1 2023, however, it started to rise sharply. In the past 3 quarters, non-accruals have jumped to 8.3% and were 11.1% in the recently released earnings report. This is also among the highest (worst) in the BDC sector .
The next risk is leverage. Most BDCs currently and historically have 0.9-1.2x leverage ratios. That's conservative for lenders and far less than the average bank.
TPVG Q3 Presentation
TriplePoint's leverage ratio was at or below peer averages a couple of years ago. Today, it's at 1.62x. That's 30-40% greater leverage than the peer average . This isn't a total shock given the steep rise in the profitability of the loans TriplePoint is making now compared to the past.
At a high level, the portfolio is 90% loans and 10% equities and warrants.
Conclusion for TriplePoint
Let's sum up TriplePoint. Its most recent NII of $0.54 per share equates to 135% distribution coverage. That's above average (safer) distribution coverage compared to peers.
It also means TriplePoint's 15.75% distribution yield, despite first impressions, is sustainable compared to current financial and operating metrics. There are other items that can detract from this formula for calculating distribution coverage like realized losses and certain taxes, but it's a good barometer.
TriplePoint maintained its distribution throughout the pandemic and resumed paying special dividends in early 2021.
TriplePoint is investment grade rated at BBB by DBRS. DBRS isn't one of the major rating agencies (i.e., Moody's, Fitch, and S&P), but it uses a similar framework. With a few exceptions, a BBB rating from DBRS equates to a BBB- rating by the major rating agencies (one notch lower). While not quite as good as some peers, it's a very respectable rating for such a small and aggressive BDC.
Regardless, TriplePoint is clearly a higher risk, higher reward BDC. In the most recent reporting period, it achieved a 20% annualized return on its equity. That's the upper end of what investors could realistically experience long-term by buying TriplePoint, provided it's at an attractive valuation.
On that note, TriplePoint's latest NAV per share was $10.37, which is roughly where the stock is trading now. A couple of years ago, that NAV was $12.69. The decline in the NAV is primarily due to higher non-accruals and frequent distributions to investors (if TriplePoint realizes a profit on an investment, it often sends the whole proceeds to shareholders. That's a good practice in most shareholders' views, but it also drags on NAV over time).
Overall, I consider TriplePoint a Buy at current levels for BDC investors comfortable with the higher risk profile. For those looking for a lower risk business model, I'd suggest BDCs with larger portfolios, investment grade credit ratings from the major agencies, and with portfolios with better risk metrics.
We'll finish our high-level analysis of TriplePoint with a couple of interesting facts you are unlikely to read elsewhere. The company has never issued shares below net asset value, which is an impressive accomplishment for any BDC. Like REITs, BDCs are dependent on share issuance to grow. Avoiding issuing shares below NAV is a testament to management's patience and smart timing and stops shareholders from being needlessly diluted.
Unlike many externally managed peers, TriplePoint also has a favorable total return component in its incentive fee that protects investors. Because of this provision, investors have saved $11.3 million since inception in incentive fees. I did a little math, and that's a $0.31 per share difference.
Lastly, despite elevated non-accruals more recently, the company's net loss rate since inception is only 27 basis points (0.27%) annually. That's exceptional given its strategy.
Hercules Capital, Inc. ( HTGC )
One of the Most Unique and Best Performing BDCs
Fortunately, Hercules also reported earnings a few days ago, so we have the latest information.
Yahoo! Finance
In the past five years, HTGC has increased from ~$12.50 to ~$15.75 per share for an approximately 25% return. That's what most people see. A decent return, but nothing special.
Including dividends, however, that jumps to 75.8%. Now we are talking, particularly when that timeline starts before the pandemic. In the past 12 months, like many BDCs, HTGC has performed well with a 55.1% total return.
That's been driven by a return on average equity of 20.2% annually. That's right in line with TriplePoint's impressive performance. Hercules' net interest margin is a very healthy 13.3%, which is moderately better than peer averages (though well behind TriplePoint's sky-high levels).
Hercules loss rates are exceptional at only 1.5 basis points, or 0.015%, annually. That critical risk metric is superior to most investment grade bond funds .
Hercules Q3 Earnings Presentation
Hercules' strong track record extends back to the pre-Great Recession era. As shown in the above chart, across the Great Recession and pandemic, cumulative (that means total over time) net losses were $48.3 million.
That compares to the current market capitalization of $2.38 billion and total assets of $3.31 billion. For context, Hercules' cumulative net losses from being in business for 18 years and two severe recessions equate to 1.5% of its current loan portfolio. This indicates extremely strong underwriting .
Hercules also benefits from an investment grade BBB- rating from Fitch and comparable Baa3 from Moody's. They are rated BBB from DBRS like TriplePoint. Hercules has no material maturities until 2026 and 2027, which is another plus in the current environment. Leverage is also on the low end at approximately 1.0x.
Conclusion for Hercules
Hercules' last quarter's NII was $0.52 compared to the annual distribution of $1.60 or 130% distribution coverage. That's nearly as strong as TriplePoint's sector-leading 135%. That said, NII will be volatile by nature so a cushion of 110-115% is the minimum for what we consider to be a reliable distribution long-term. I noted why we need a cushion (realized losses and taxes) in the section about TriplePoint.
In terms of pandemic performance, Hercules increased its base distribution in 2020 and 2021 and paid modest supplemental dividends along the way.
The investment grade rated BDC, like most BDCs, is a net beneficiary of higher rates. For each 25 basis point increase, you can expect 4-5 cents per share in additional earnings per share ("EPS"). The same applies in the other direction.
From a valuation perspective, the historical range for HTGC is a 1.1x to 1.7x premium to NAV. Only a handful of BDCs, including Main Street Capital and NewtekOne ( NEWT ) (before it converted to a C-Corp), consistently have earned higher premiums. The market does not award BDCs premiums to NAV on accident.
Discounts are often exaggerated, but rarely premiums. The stock currently trades with a 1.4x premium to NAV, which is right in the middle of the historical range.
Therefore, we rank HTGC a Buy.
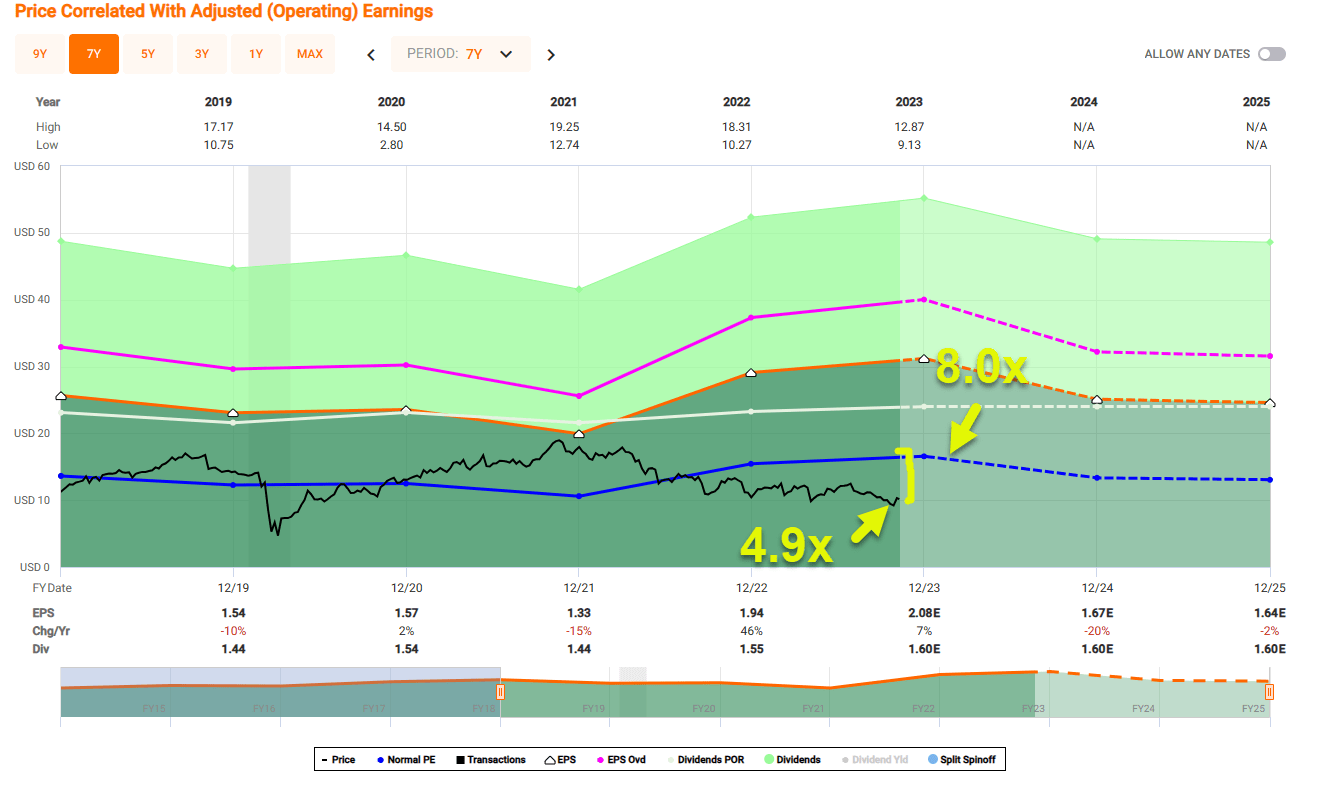
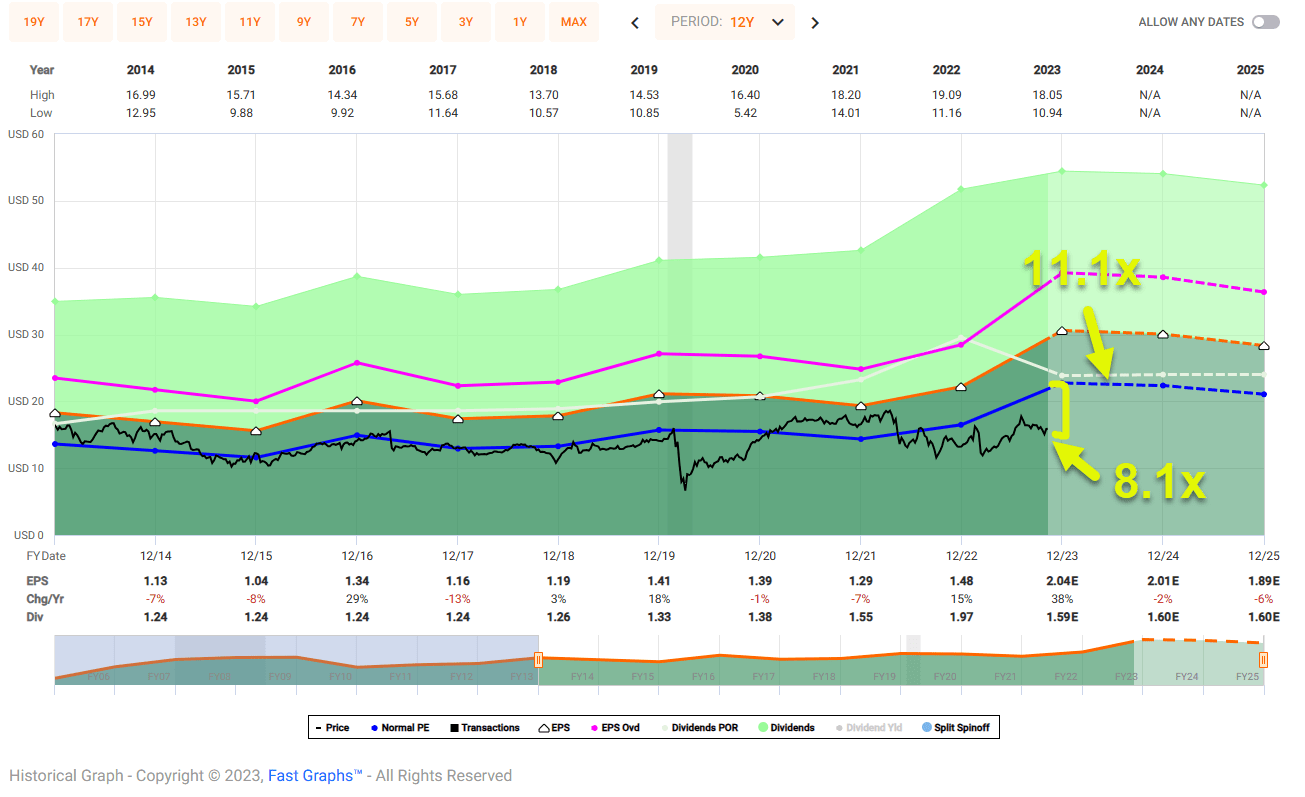
HTGC trades at 8.1x, well below the normal multiple of 11.1x. The dividend yield is now 10% and well-covered.
Now, for a few interesting facts about Hercules as we finish up.
It is the only high-quality BDC I am aware of with >80% first-lien loans (>95% first and second lien) that consistently earns a high premium to NAV. Those kind of premiums are usually awarded to more equity heavy players like Main Street.
Next, it's the only BDC of scale that focuses primarily on companies tied to pre-IPO status and M&A (mergers and acquisitions). Lastly, Hercules is one of the very few internally managed BDCs.
Not surprisingly, two of the best performing BDCs of all time, NewtekOne (prior to announcing the conversion away from a BDC, it was the top performing over most time periods) and Main Street are internally managed. That puts management on the same team as shareholders, not just in the same game.
Oaktree Specialty Lending Corporation ( OCSL )
A 10% Yield Very Close To Our Buy Target
Oaktree has been involved in a lot of mergers. Brookfield ( BAM ) acquired a majority controlling stake in Oaktree in 2019. At the time, the Oaktree franchise managed $120 billion in assets across private equity, infrastructure, real estate, and private debt.
Within the private credit sleeve were Oaktree Specialty Lending Corporation and Oaktree Strategic Income II, Inc ("OSI II"). For reasons I won't get into in today's article, Oaktree had two publicly traded BDCs and decided combining them was the best path.
The merger was announced in September of 2022. Oaktree served as the Advisor (external manager) to both BDCs and agreed to waive $9 million in fees for the Boards to agree to the deal. To put that into context, Q2 2023's base management fee was $12.0 million prior to the $1.5 million fee waiver.
Over time, the BDCs ended up with overlapping portfolios so the merger made sense. Given scale is extremely important for credit ratings and lowering the cost of capital, that was a contributing factor for the merger too.
Unlike TriplePoint and Hercules, Oaktree won't report Q3 earnings until pre-market on November 14th , so our data is a couple months old. Given the portfolio doesn't change dramatically quarter to quarter, we should still be able to make an educated assessment of the company's portfolio and valuation.
OCSL Q2 Earnings Presentation
Oaktree's portfolio is about three quarters of first lien loans, with another 12% in second lien. The rest is unsecured debt (2%), equity (4%), and joint ventures (6%) that roughly mirror the portfolio's construction. Overall, 88% of the portfolio is senior secured debt. The portfolio's size is little smaller than Hercules but large enough to earn an investment grade credit rating from the major issuers.
Compared to its peers, it has tilted more toward application software. To be clear, software is the #1 industry exposure for almost every BDC. The difference is that it's 17.4% for Oaktree (18.1% if you include all software) with #2 biotechnology far behind at 4.1%; usually the dispersion isn't that great. Just like other top BDCs, you won't see cyclical industries (e.g., oil and gas) high up on the list.
Oaktree's leverage ratio was 1.14x at the end of the reporting period, which is on the conservative side. Oaktree's debt maturity schedule is excellent with only $300 million coming due between now and the end of 2026. This means higher rates will continue to be accretive for Oaktree.
It won't be until 2027 before higher rates cause the interest associated with its note offerings to increase (assuming they are refinanced). The bulk of Oaktree's debt is SOFR + 2.00% in the form of a credit facility, which while cost effective, is interest rate sensitive as SOFR is an international interest rate benchmark closely linked to the Fed's overnight rate (which ultimately sets short-term U.S. interest rates).
Since we know how the asset and liability sides of the balance sheet are constructed, we can reliably gauge Q3's numbers. I expect Q3's GAAP EPS to fall between $0.62 and $0.65 per share.
Non-accruals as percentage of the debt portfolio were 3.1% at the end of Q2. That's slightly above average for the sector, but not enough to cause concern. As recently as Q4 2022 , OCSL had zero investments in non-accrual.
Conclusion for Oaktree
Since inception in 2017 (using the data from the previous entities prior to the merger), OCSL has paid $8.24 in distributions per share. That's about half of the IPO share price. Those gains won't be obvious when looking at a simple stock price chart.
Oaktree's GAAP NII has been very consistent in the past five quarters ranging from $0.59 to $0.66 with both Q2 and Q1 of 2023 landing at $0.63. As mentioned previously, I expect Q3 to be very similar to Q2. That results in dividend coverage of 115%.
While still in the "safe" category, Oaktree is unlikely to raise the base dividend meaningfully anytime soon.
To be fair, the base dividend has already increased by 20-30% since the pandemic (there isn't a perfect way to calculate that given all the M&A). Q4 2022 marked the 11th consecutive dividend increase for OCSL, which has got to be either a record or very close to a record for the industry. That's why the stock yields just over 10% today.
Oaktree increased its distribution in both 2020 and 2021. I calculated that and all other historical dividend figures based on the aggregate performance of the two separate entities that combined to form the current company.
Oaktree's latest NAV was $18.58. I expect Q3's figure to be within 12 cents of that. The latest share price is about $19.50 resulting in a 1.05x premium to NAV. Historically, picking up shares at or below NAV results in a compelling return for investors in OCSL.
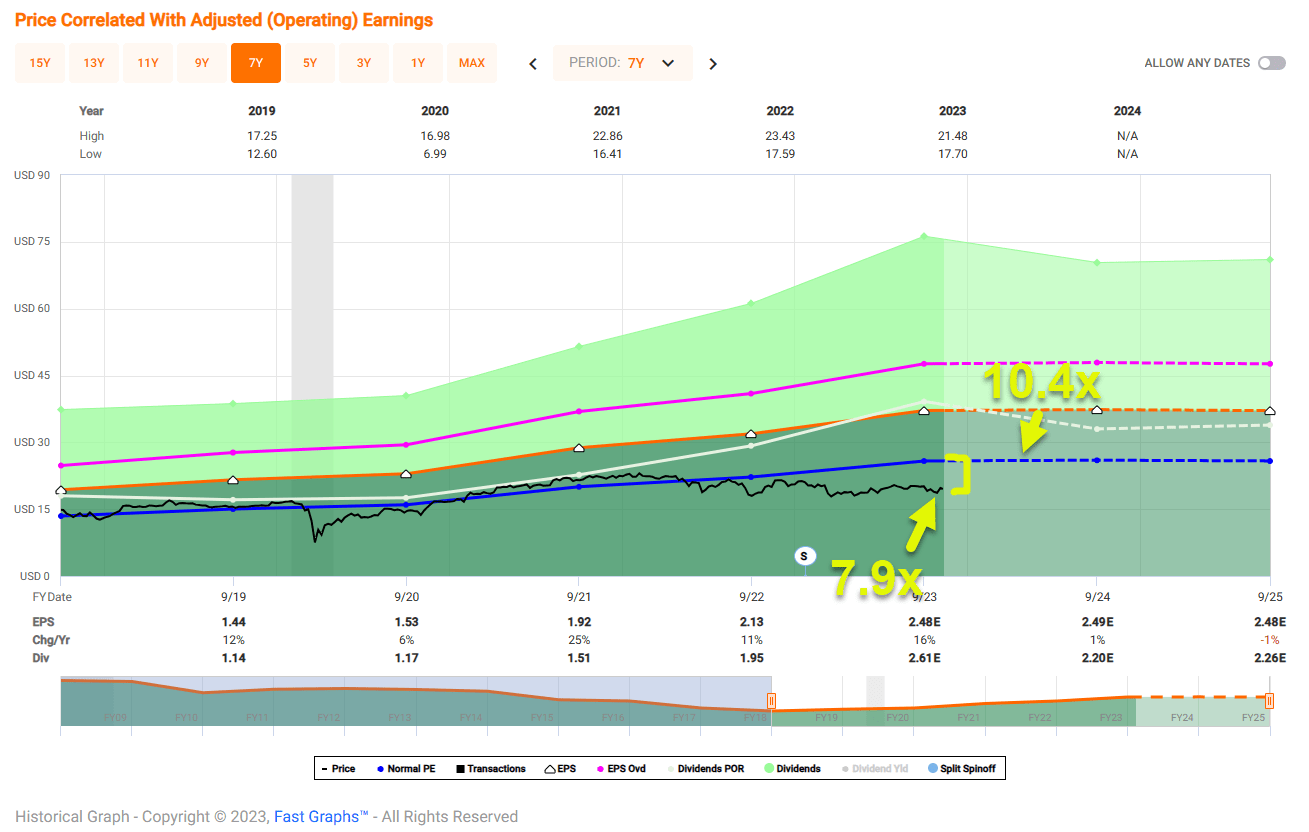
That means I classify Oaktree as Buy. As seen below, shares trade at 7.9x versus the normal range of 10.4x.
Now for a few things that make Oaktree unique. Its President, Matt Pendo, was the Chief Investment Officer for the Troubled Asset Relief Program ("TARP") of the U.S. Department of the Treasury. That was the $700 billion government fund that sought to stabilize the financial system during the Great Recession.
Oaktree is also active in the secondary markets.
In times of market stress, there are great buying opportunities for those with liquidity and the know-how to act fast but prudently. With Oaktree operating one of the largest private credit platforms in the world (>$110 billion), they fit the bill.
In Q1 of 2020, for example, the company bought $75 million in heavily discounted loans (page 16 of the Q2 deck has a good illustration for those interested).
They bought another $35 million in Q2. Oaktree realized double-digit capital gains (some nearing 100%) on many of those loans within a couple of quarters. Very few BDCs dip into public credit like this to take advantage of distressed investing opportunities.
In Closing...
I hope that you enjoyed the November edition of How To Invest $1,000 Per Month . In December, I'll provide a list of three MLPs/Midstream stocks.
Note: Brad Thomas is a Wall Street writer, which means he's not always right with his predictions or recommendations. Since that also applies to his grammar, please excuse any typos you may find. Also, this article is free: Written and distributed only to assist in research while providing a forum for second-level thinking.
For further details see:
How To Invest $1,000 Per Month (November Edition)