XAR - Is The iShares US Aerospace & Defense ETF Worth Pursuing?
2023-05-17 11:57:16 ET
Summary
- In this article, we commence with some commentary on the industry.
- We examine ITA’s qualities against its largest peers.
- We close with some thoughts on the valuations and the technicals.
Summary
The iShares U.S. Aerospace & Defense ETF ( ITA ) is a $5.7bn fund (based on the respective AUM, ITA is the largest offering in this space) that focuses on 35 U.S. companies that manufacture commercial and military aircraft and other defense equipment. We like the outlook for the A&D industry but we do wonder if ITA is best placed to deliver suitable alpha at this point. We also touch upon some good and bad qualities of ITA relative to its peers
A&D Industry Is In A Good Place
The broad aerospace and defense (A&D) universe has traditionally proven to be quite a reliable industry to invest in, and we don’t expect this to change going forward, as conditions still look rather supportive. This doesn’t necessarily have to continue in the future, but a recent survey by Deloitte showed that an overwhelming majority of A&D executives expect the general business outlook for the industry in 2023 to be “somewhat to very positive.”
Do consider that despite a commendable 2022, large commercial aircraft ((LCA)) orders still have a long runway to kick on even further. Currently, global air passenger traffic levels are yet to return to the pre-pandemic run-rate, and the latest data from IATA shows that it is still 12% short of the March-2019 levels. As those numbers trend towards the norm, expect a pickup in the order backlog, which in turn should reflect well on cash generation and also result in some semblance of deleveraging. Fitch expects deliveries of new large commercial aircraft to grow by 20% YoY in FY23.
Then ongoing geopolitical tensions across various parts of the world will ensure that defense budgets remain bloated. Last year, we saw global military spending hit record levels of $2.2 trillion , even as growth in the European terrain was the highest in the post-cold War era (13% YoY). Closer to home in the US (the largest market which accounts for ~ 39 % of global military spend), spending in real terms may only have come in at less than 1%, but it’s still worth highlighting that spending here will likely grow every single year through 2033 even as the total spend crosses the $1 trillion mark by 2029.
SIPRI
ITA Vs. The Largest Alternatives In The A&D Space
To better understand ITA’s qualities we thought it would be appropriate to run a comparative study versus the other two large offerings in the A&D space The first is the Invesco Aerospace & Defense ETF ( PPA ) which is the oldest ETF in this space (been around since October 2005, roughly six months before ITA), and the second is an equally weighted A&D play- the SPDR® S&P® Aerospace & Defense ETF ( XAR ) which was set-up in September 2011.
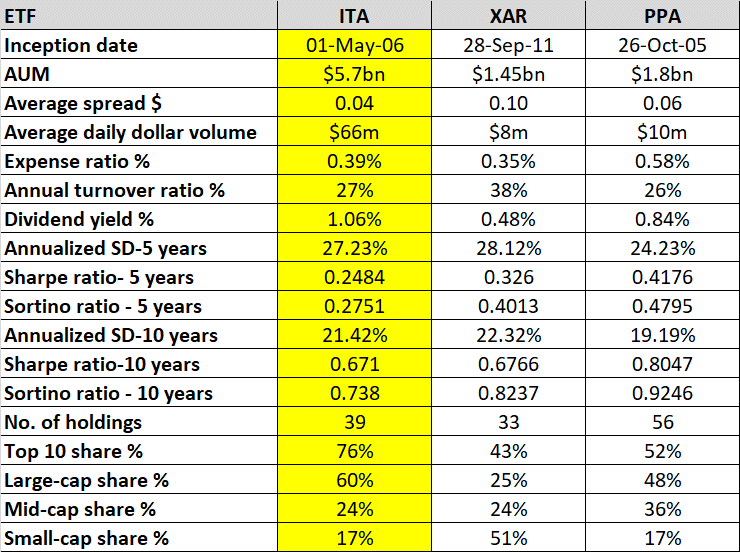
ITA may not be the oldest product around, but it is certainly the most popular one, with an AUM figure that is 3-4x that of its peers. As a trading play too, it appears to be very popular, with average daily dollar volumes of $66m, which is 7-8x that of PPA and XAR. Given that it attracts a lot of attention from market participants, you tend to get good fills with an average dollar spread of just 0.04. Conversely, the equally-weighted option, XAR, is around 2.5x worse with an average spread of 0.10.
When it comes to the structure of the ETF, ITA comes across as a pretty well-rounded bet. It may not have the lowest expense ratio but it is certainly not as prohibitive as PPA (0.58%). Ideally, you also want to pursue ETFs that don't resort to an awful lot of churn every year, and in that regard as well, ITA fares reasonably well, with an annual turnover ratio of 27%, more or less in line with PPA, and lower than XAR. Just for some context, it’s also worth noting that the turnover ratio of all ETFs typically works out to around 31% .
Where ITA comes up short is its risk profile, and crucially, its inability to generate ample returns in the face of this relatively high risk profile (in fairness, even the other two options are unable to deliver ample excess returns given the risk involved, but at least their numbers look a lot better).
The respective annualized standard deviation figures (both over a 5-year and a 10-year time frame) show that it pays to have a broader perspective, where the risk is more spread out over more holdings. PPA covers a much wider group of names (56) relative to our focus ETF, and XAR. Because of its lower volatility profile, PPA is in a better position to generate excess returns over the risk-free rate (as exemplified by the respective Sharpe ratios).
Even when only downside deviation is considered, ITA comes across as the least efficient with the lowest Sortino readings, both over the short-term as well as long-term. The implicit takeaway here is that ITA's strategy of focusing too much on just a small group of large-cap names hasn’t reflected well on its risk-adjusted return profile (the top 10 stake of ITA’s holdings is the most pronounced at 76%, with large-cap companies dominating the proceedings with an aggregate 60% stake). The stats discussed in this section are summarized below.
Closing Thoughts
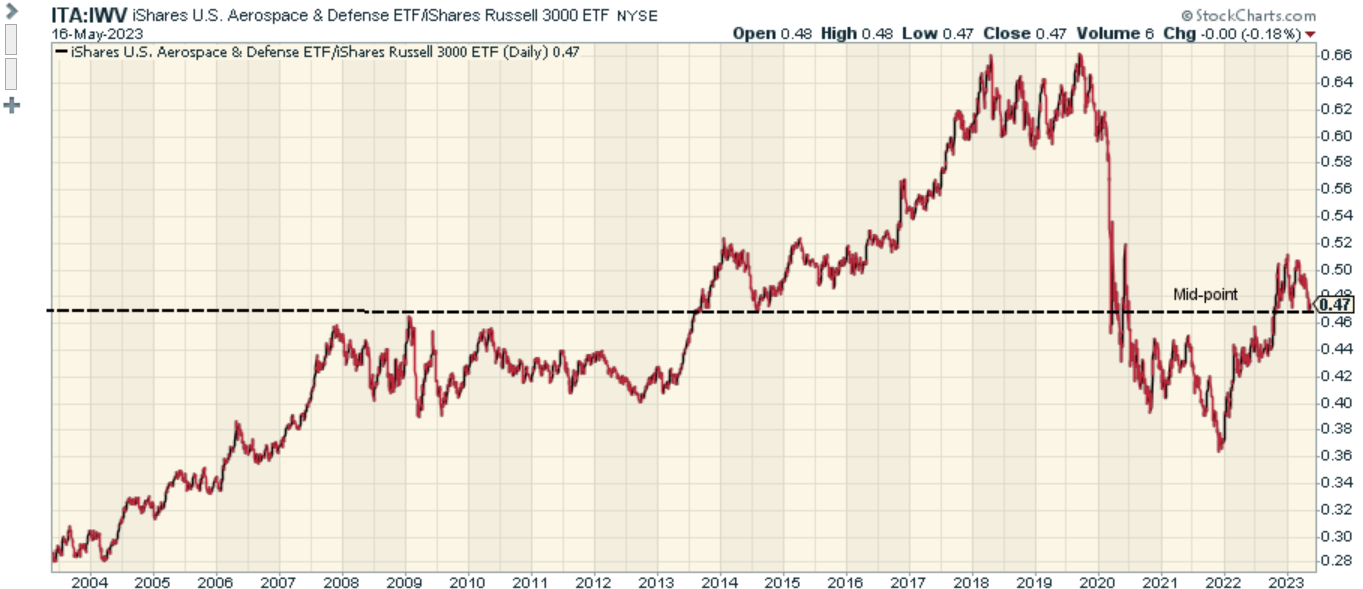
From a technical angle as well, it’s hard to get excited about ITA at these levels. While fishing for long opportunities, it is preferable to drift towards names that look oversold relative to the broader markets, as they could benefit from some mean-reversion momentum. ITA is not what you’d consider as part of this cohort, as its relative strength ratio versus the Russell 3000 Index, has already mean-reverted to the mid-point of its long-term range, thus offering limited incentive.
It’s also worth noting that at the current forward valuation, long-term earnings dynamics don’t reflect too well on ITA. As per YCharts, this product currently trades at an elevated forward P/E of over 21x, whilst its constituents are only expected to deliver long-term weighted average earnings growth which is roughly half that level at 10.9% . Contrast that with the broader markets, as represented by the ETF- IWV which offers slightly superior long-term earnings growth ( 11.7%) , at much lower valuations of just 18.5x!
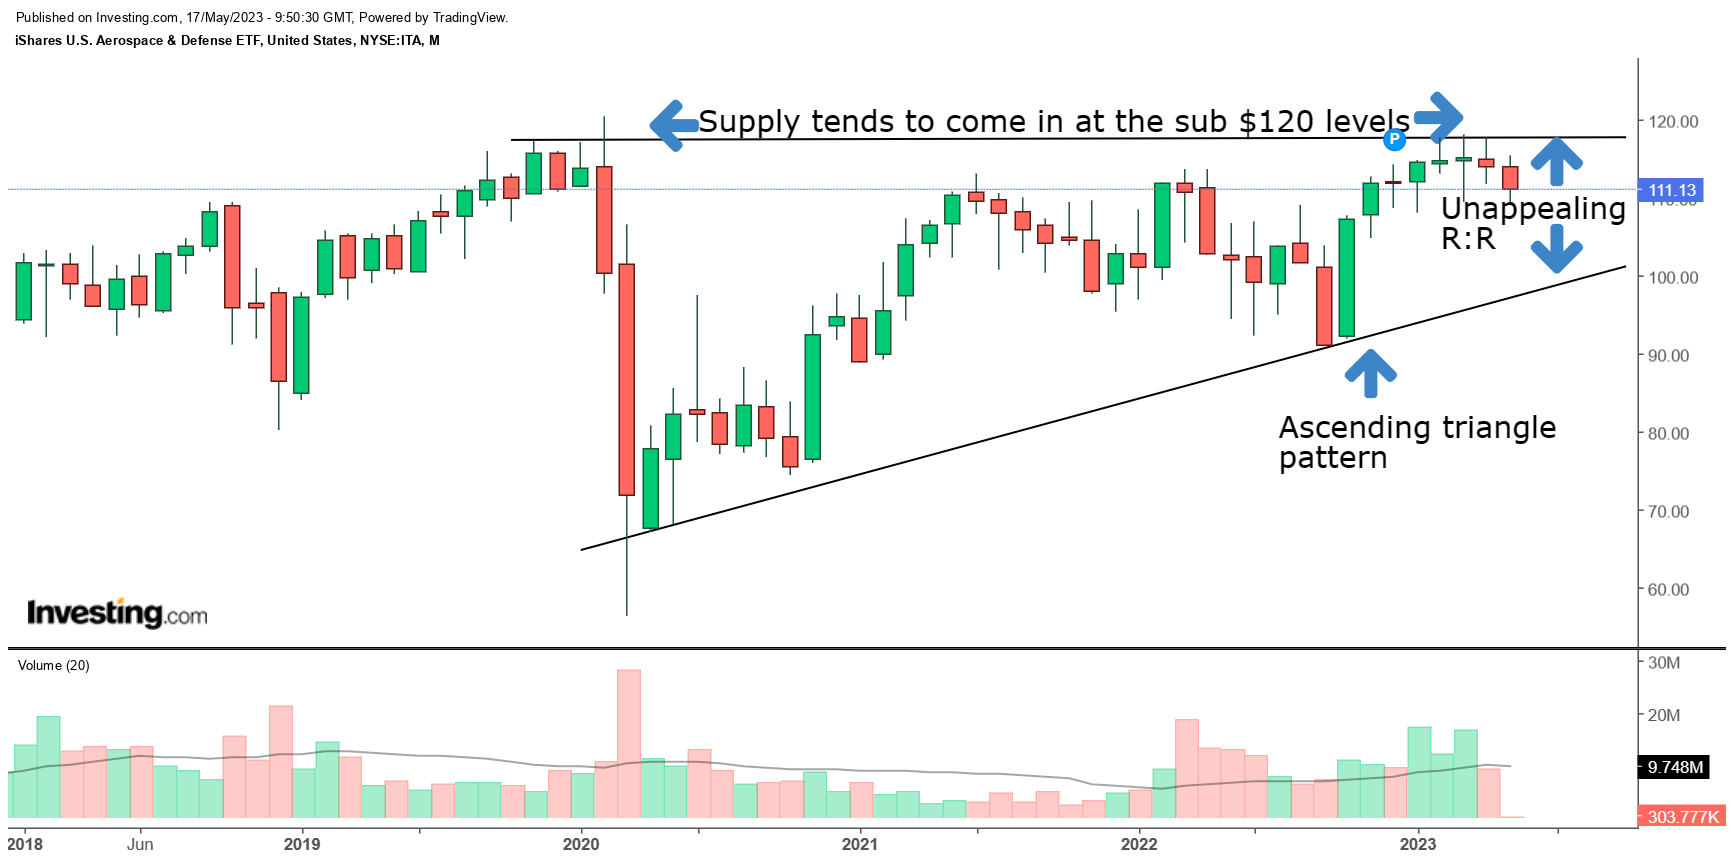
Then, if you look at recent developments on ITA’s own weekly chart we can see that conditions are not wholly supportive for a long position. Since late 2019, the iShares US Aerospace & Defense ETF has made price imprints in the shape of an ascending triangle pattern . Even though this is likely a continuation pattern, it does not feel prudent to stage an entry just below the 120 levels as there's been ample history of additional supply coming into the market at those levels. The more sensible approach would be to take a position somewhere closer to the upward-sloping support line.
For further details see:
Is The iShares US Aerospace & Defense ETF Worth Pursuing?