QVMM - iShares Fall 2023 Investment Directions
2023-09-27 03:35:00 ET
Summary
- Interest rates are likely to remain higher for longer on the heels of better-than-expected growth.
- Fixed income remains our highest-conviction trade, although we see select opportunities in high-quality equities such as energy and industrials.
- We see potential upside abroad in countries like Japan, Mexico, and India, which benefit from structural trends like deglobalization and nearshoring.
By Gargi Pal Chaudhuri
Diminishing probabilities of a recession have supported asset performance.
Equity valuations and interest rates have been buttressed by the surprising strength of economic activity. Growth data of every variety have all surprised to the upside.
The Atlanta Fed’s GDP ‘nowcast’ is running at 4.9% for Q3 and 12-month forward S&P 500 earnings expectations have rebounded to $235/share, about the level they were when the Fed began its rate hike campaign in 2022. 1
Figure 1: U.S. economic surprises trend up
Source: BlackRock, Bloomberg. Index as represented by Bloomberg ECO US Surprise Index. As of September 15, 2023.
Chart description: Line chart showing the US Economic Surprise Index since 2010. The surprise element is calculated as the percentage difference between the actual economic data release and the median of analysts' forecasts for that release, smoothed with a six-month decay. Each of the data releases is given an equal weight within its sector and the overall index. The index has risen since 2022 and now hovers around 0.5.
Figure 2: S&P 500 12-month forward EPS
Source: BlackRock, Bloomberg. S&P 500 represented by SPX Index. Grey areas indicate historical periods of U.S. recession, as determined by the National Bureau of Economic Research monthly recession binomial index (USRINDEX Index). As of September 10, 2023. Past performance does not guarantee future results.
Chart description: Line chart depicting the 12-month forward earnings-per-share of the S&P 500 since 1992, featuring a steady increase and occasional dips during recessions.
The reasons for the stronger-than-expected growth remain unclear, though we believe the impact of fiscal spending is likely a factor.
Private fixed investment in manufacturing surged to $154 billion in Q2, driven by various government spending packages (CHIPS Act, Infrastructure and Jobs Act, Inflation Reduction Act). When all is said and done, estimates of the fiscal multiplier will likely need to be reassessed.
Figure 3: Private manufacturing fixed investment growth
Source: BlackRock, Bloomberg. BEA Private Fixed Investment Manufacturing as represented by BEA Private Fixed Investment Manufacturing SAAR Index. Fixed assets by type as defined by the BEA as buildings, trucks, software, and more used in production for at least a year. As of September 10, 2023.
Chart description: Area chart displaying private fixed investments for manufacturing structures from 1958 to present, denominated in billions of dollars. The chart shows a steep incline in investment over the past few years.
Whatever the proximate cause of the above-average growth, a virtuous cycle of strong consumption has been created.
Consumption has been boosted by healthy wage growth (average hourly earnings +4.3% year-over-year) and spending down savings (Personal Savings Rate plunging to 3.5%, well below its long-run average). 2
Such cycles can last only as long as the conditions that fuel them, and we expect domestic growth and earnings to slowly deteriorate as the cumulative impact of Fed hikes continues to be felt on credit creation and investment.
Figure 4: U.S. personal savings retreat from pandemic highs
Source: BlackRock, Bloomberg. Savings rate as represented by US Personal Saving as a % of Disposable Personal Income American Savings Rate Index. As of September 18, 2023.
Chart description: Line chart showing personal savings as a percentage of disposable income, in the US. The chart shows that the rate has declined to levels not seen in the past 13 years.
As labor supply and demand come back into balance, we believe wages and consumption should slow.
Strong labor demand has finally increased participation rate to 62.8%, near pre-COVID levels, while increased immigration has expanded the labor pool in key industries like construction. 3
Prime age participation rate (25-54) has moved meaningfully higher, especially for women, where participation rates are at all-time highs. 4 Real wage growth has slowed from 1.2% year-over-year to just 0.5%. 5
Rising credit card delinquency rates suggest that further increases in consumption may be more difficult to fund as wages rise more slowly and private savings bottom.
Higher energy prices may further erode consumption.
Saudi Arabia extended their voluntary production cuts of 1 million barrels per day into September. The ‘swing producer’ of OPEC is committed to higher oil prices to balance its fiscal budget and fund its diversification efforts via their Vision 2030 fund.
Russia also pledged to continue cutting 300,000 barrels a day into the next month, pushing OPEC+’s larger reductions above 3.5 million barrels a day, signaling further unity among major non-U.S. producers to keep the market tight. 6
Meanwhile, the Strategic Petroleum Reserve ((SPR)) currently holds roughly 350 million barrels for the first time since 1983 (just a few years after the SPR was formed). The Department of Energy’s total inventory has about 45 days' worth of supply, which is basically half of what it was early last year.
Figure 5: Credit card delinquencies begin to increase
Source: BlackRock, Bloomberg. Credit card delinquencies as represented by US Credit Card Delinquencies 30+ Days Composite U.S. Credit Card Delinquencies 30+ Days Composite Index. As of September 15, 2023.
Chart description: Line chart displaying the rate of credit card delinquencies of 30 or more days in the US, since 2011. The rate has risen above 1% since 2021.
AI enthusiasm has also contributed to asset performances which we wouldn’t typically expect in this macro environment.
Year-to-date, 10-year bond yields have risen 0.45 percentage points and yet the S&P 500 technology sector — the sector many regard as having the — has returned over 40% vs only 2.5% for the rest of the index. 7
Driven by lofty tech valuations, the consensus 12-month forward P/E on the S&P 500 has risen to over 19x, almost a full standard deviation above its 30-year average of 16.6x. 8
Figure 6: Tech sector outperformance year-to-date
Source: BlackRock, Bloomberg. S&P 500 as represented by SPX Index; info tech as represented by S&P 500 Information Technology Sector GICS Level 1 Index. As of September 15, 2023.
Chart description: Line chart showing total return year-to-date of the S&P 500, the S&P 500 without the technology sector, and the technology sector only. YTD, the tech sector has outperformed the other indexes greatly.
Figure 7: S&P 500 12-month forward P/E
Source: BlackRock, Bloomberg. S&P 500 as represented by SPX Index. Grey areas indicate historical periods of U.S. recession, as determined by the National Bureau of Economic Research monthly recession binomial index (USRINDEX Index). As of September 10, 2023. Past performance does not guarantee future results.
Chart description: Line chart depicting the 12-month forward price-per-earnings of the S&P 500 since 1992. The current 12-month forward PE for the S&P 500 is just under 20.
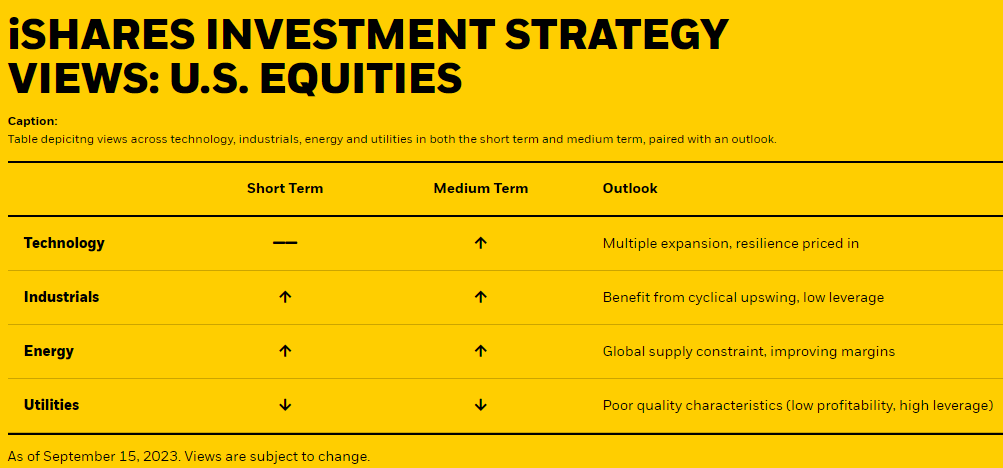
U.S. Equities
Equity market volatility — at its lowest levels since December 2019 — stands in the face of the fading economic backdrop.?
Twelve-month forward earnings growth expectations for the S&P 500 have risen two percentage points to 9.8% in the past three months and year-to-date total returns remain buoyed by valuation expansion. 10 The sanguine outlook discounts what could be a bumpy road to year-end.
Much like we’ve seen since the S&P 500 hit a recent peak at the beginning of August, we believe markets will remain beholden to parsing through every economic print, trying to determine whether the Federal Reserve has achieved what it set out to do.
This type of environment — where event risk premia remain high and implied correlations are at 5-year lows — underscores our continued preference for identifying quality characteristics within equities.
Figure 8: S&P 500 3-month implied correlation declines
Source: BlackRock, Bloomberg. Implied correlation as represented by Cboe 3-Month Implied Correlation Index. As of September 15, 2023.
Chart description: Line chart depicting 3-month implied correlation. The chart shows a consistent decline in correlation in 2023.
The result is a renewed focus on metrics such as low leverage, earnings stability, and profitability. Three sectors stand out: energy, industrials, and information technology.
- We unpacked our optimistic energy outlook at the end of June in our Midyear Outlook, and since, crude has climbed over 30% with energy equities increasing in tandem. 11 While the sector remains elevated on our quality screen on the back of strong earnings and high profitability metrics, year-to-date price action remains a corollary of crude prices. We see limited price downside as supply-dynamics remain tight, with a global daily deficit on the heels of domestic crude inventory draws paired with sustained OPEC+ cuts. We believe near-term contracts may continue to rise, towing energy equities up in the process.
- We turn constructive on industrials. The sector ranks high in its quality characteristics, particularly low leverage. We see fiscal spending continuing to support earnings and easing supply chains strengthening profit margins. With its P/E ratio right in line with its 10-year average at 17.6x, we like the 12-month forward earnings growth for the sector of 13%. 12 Our view is that a bottoming in U.S. manufacturing — maybe even picking up the growth baton from U.S. consumers — provides further upside risk headed into 2024.
Figure 9: Beginning of U.S. manufacturing bottom?
Source: BlackRock, Bloomberg. ISM as represented by ISM Manufacturing PMI SA Index; Regional Fed Survey average represented by EWMA of regional M-PMIs (Texas, Kansas City, Philadelphia, Richmond Fed, Empire State). As of September 10, 2023.
Chart description: Line chart depicting the four-month moving average for the regional Fed survey (blue) and the ISM manufacturing index over the past ten years. ISM is currently in contractionary territory but seems to have bottomed out while the regional fed survey is also recovering from bottoms.
- Many large-cap information technology firms remain attractive according to our quality metrics. However, we suspect that such resilience within high-quality tech companies has largely been priced in by investors (with a boost from AI optimism). Hefty multiple expansion sees the sector trading at 25x 12-month forward earnings growth of 15%. 13 We believe there are other areas of the market — like industrials — that score comparably high on quality metrics and currently offer more reasonable valuations.
- We also utilize our quality preference to screen for sectors with subpar fundamentals. Utilities unfold as our least-favored sector on low profit margins and high leverage, coupled with a subdued dividend yield clocking in at a 3.3%, below its 10-year average. 14 This bearish outlook is reflected more broadly in investor positioning, too — utilities emerged as the largest underweight allocation in BofA's September Global Fund Manager Survey. 15
As we quickly approach year-end, we think investors may want to consider positioning against downside risk and volatility while remaining invested. Market volatility sits at 5-year lows, and buffered ETFs can take advantage of relatively low hedging costs in a depressed volatility environment.
In capping downside losses while maintaining benchmark exposure, buffered ETFs can be used to help protect year-to-date gains or reduce active risk as we wait for more economic clarity in the months to come.
Figure 10: Volatility hovers below average
Source: BlackRock, Bloomberg. VIX as represented by Chicago Board Options Exchange Volatility Index. As of September 15, 2023. Indexes are unmanaged and one cannot invest directly in an index. Past performance does not guarantee future results.
Chart description: Line chart showing the CBOE Volatility Index ((VIX)) over the past four years. The black dotted line represents the ten-year average volatility. Volatility is currently below this historical average.
Fixed Income
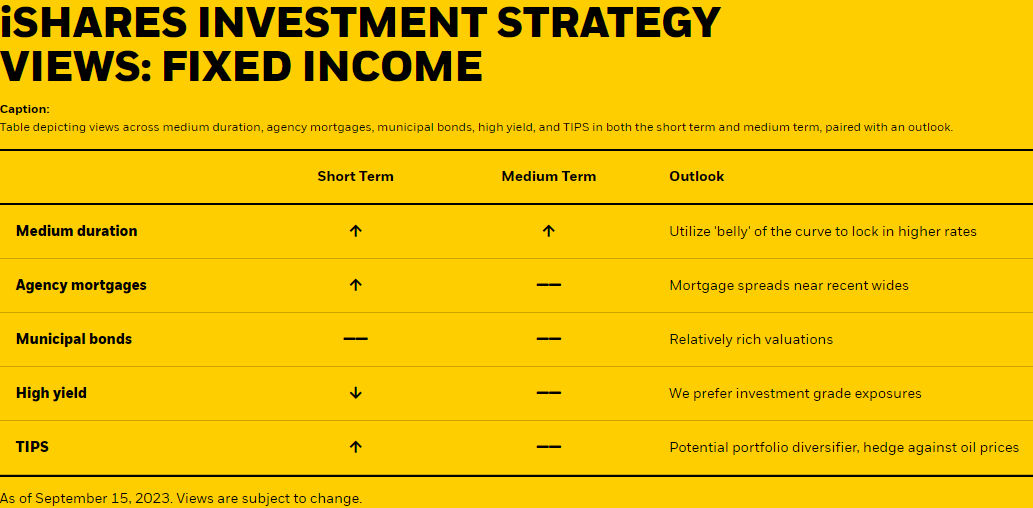
Fixed income remains our firmest conviction.
Consistent with our expectation for gradually slowing economic growth and corporate earnings, we prefer investment grade exposures to high-yield strategies.
We believe the yield curve will likely flatten modestly as longer-maturity bonds sell off, but the curve may remain inverted through the end of the year.
Yet given our belief that the Fed hiking cycle is at an end, we think the time has come to move out in duration and into the ‘belly’ of the curve (3- to 7-year duration) to lock in higher rates.
An improving economic outlook has been key to this year’s rise in rates.
As discussed in the introduction, economic data has been better-than-expected, especially given the Fed hiked policy rates by 5.25% since March 2022. Just two months ago, Fed funds futures priced that the Fed would cut rates this year to combat an expected sharp slowdown in economic activity.
The improved growth outlook has now pushed the first expected Fed rate cut back to the second half of 2024.
As Fed Chair Powell noted in the September FOMC press conference, “if the economy comes in stronger than expected, that just means we will have to do more in terms of monetary policy to get back to 2%” inflation. While growth should slow, the market believes there is enough momentum to rule out near-term rate cuts. 16
Technical factors and supply may also lead to steeper curves.
Treasury issuance are expected top $1 trillion in the third quarter. 17 We believe supply over the next few quarters in the coupon sector should be digestible, but the CBO’s longer-term forecasts show the budget deficit deteriorating from an already unsustainable level. With the Fed allowing $60 billion in Treasuries to roll off its balance sheet each month, higher rates may be required to attract marginal demand for duration.
Weakening foreign demand for longer-dated Treasuries may also contribute to steeper U.S. yield curves. U.S. TIC data shows that Chinese holdings of U.S. Treasuries have reached their lowest level since June 2009.
Figure 11: Total U.S. Marketable Treasury issuance
Source: BlackRock, Bloomberg. U.S. marketable Treasury issuance as represented by TISSTOTN Index. As of September 10, 2023.
Chart description: Line chart depicting US marketable Treasury security issuance and its 4-month moving average, from 2017 to present. The chart shows a rise in issuances in 2023 to levels not seen since 2020.
In contrast to the problems facing long-dated Treasuries, we think the belly of the curve is attractive given its carry and cushion.
Even as inflation is moderating and the rate hike cycle approaches its end, the 5-year yield is at its 99th percentile over past 10 years and 90th percentile over last 20 years. 18 These higher yields translate into higher carry, which can act as a ‘buffer’ against negative price returns.
We especially like agency mortgages at these rate levels.
Because mortgage spreads are near recent wides. Mortgage spreads are correlated with implied fixed income volatility (because of the pre-pay option imbedded in fixed rate mortgages), so a decline in fixed income volatility should be consistent with a narrowing in MBS spreads.
We believe that implied volatility will likely come down as it becomes clearer the Fed is done hiking and it becomes more evident that the Fed intends to leave rates higher for longer.
Mortgages already compare favorably to investment grade bond spreads, but seasonal issuance and the need to secure funding before rates rise could add further investment grade credit supply and weigh on performance.
Figure 12: Spreads between MBS and investment-grade credit continue to widen
Source: BlackRock, Bloomberg. Investment grade corporate bond spread as represented by LUACOAS Index; Agency mortgage-backed security basis as represented by .MBSBASIS F Index. As of September 15, 2023. Past performance does not guarantee future results. Past performance does not guarantee future results.
Chart description: Line chart showing investment-grade corporate bond spreads and agency mortgage-backed security bases dated from 2000 to present. Agency MBS spreads are a higher than IG spreads in 2023.
We also like TIPS as real rates have reached levels not seen since the GFC and can act as a portfolio diversifier.
Despite the surge in oil prices, market expectations for inflation essentially remain within the range they have traded since May. 19 With 10-year real rates reaching 2%, inflation-protected Treasuries present the opportunity to hedge inflation risks at an attractive yield.
Selective exposure to municipal bonds also offers some opportunities.
While flows to municipal bond ETFs have reached their highest levels in three quarters, relatively rich valuations and waning seasonal trends warrant some near-term caution for municipal bonds as an asset class. 20
For this reason, we prefer higher quality issues such as essential-service revenue bonds, high-quality state and local issuers with the broadest tax support, and flagship universities.
International
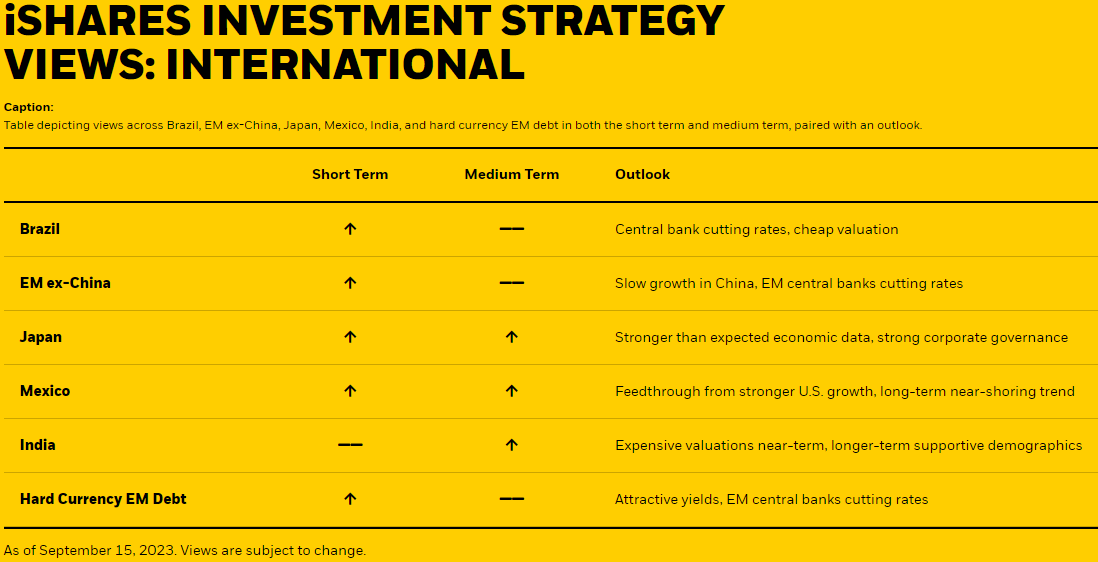
Three main narratives, in our view, will drive international investing themes until year end. First, central banks will begin to diverge on policy as developed markets (DMs) are poised to keep interest rates restrictive for longer while emerging market ((EM)) central banks have begun or are preparing to cut rates.
Second, slower global growth expectations may influence how investors approach EM allocations. Finally, structural trends from deglobalization and demographic changes may bolster certain regions outside of the U.S.
DM central banks in Europe and North America appear poised to keep interest rates higher for longer to bring down inflation. Meanwhile, we believe many EM economies, such as Brazil, face a better inflation and growth picture relative to developed markets, allowing their local central banks to consider cutting rates in the near-term.
Brazil’s central bank committed to cutting the Selic policy rate by 50 basis points in August with more expected by the end of 2023. 21 Overall, this reinforces our positive view for the Brazilian local equity market, and we believe more emerging market economies are expected to follow.
While China was expected to be a leader in global growth this year, other countries emerged as unexpected engines while strong data from the U.S. delivered a summer rally in the dollar.
Investor sentiment for China worsened over the summer as the market struggled with high rates of youth unemployment, a declining property market, and weak consumer activity. Considering the disappointing growth picture, more investors have started to pick apart their Emerging Markets and Asia-Pacific exposures with EM excluding China indexes.
Japan’s growth surprised to the upside, benefitting from a weaker currency, AI and robotic exposures, and potential end to its deflationary era. The U.S.’s stronger growth picture also led to resilience in the U.S. Dollar, which we think reached its cycle peak in Q4 2022. 22
The choppy USD and where global growth stands now are reasons why we think investors should be selective in their international allocations with EM ex-China and single country solutions.
Figure 13: YTD flow % of AUM
Source: Bloomberg, as of September 13, 2023. ETF groupings determined by Markit. ETFs are U.S.-listed.
Chart description: Line chart depicting ETF year-to-date flows as percentage of total assets for each of the following regions: Mexico, India, Japan, Broad Emerging Markets, and Emerging Markets ex-China. EM ex-China has growth the most, growing 67% YTD. Mexico, India, and Japan have all seen strong inflows as well.
Lastly, structural global events like deglobalization and nearshoring may benefit select regional economies for the longer term. For example, we believe that India’s growing workforce from its expanding population — which is now the world’s largest — may bolster the economy into a more sizable growth engine for Emerging Markets Asia.
Another powerful long-term trend in play is nearshoring, where countries such as Mexico — which is strategically located close to the U.S. and offers competitive labor costs and favorable tax treatments — are poised to benefit from post-pandemic deglobalization forces.
Figure 14: Mexico surpasses China as the USA’s main trade partner
Source: BlackRock, U.S. Census Bureau. As of September 13, 2023.
Chart Description: Line chart depicting monthly share of U.S. imports from main trade partners since 2015. Mexico recently surpassed China as the United States’ main import trade partner, highlighting the U.S. and Mexico’s recent near-shoring trend.
Regarding emerging market debt, we hold a preference for hard currency EM debt over local currency EM debt considering the strength of the USD. Yields for hard currency EM debt are currently attractive and could be cushioned from weakening local currencies as EM central banks start to cut policy rates.
© 2023 BlackRock, Inc. All rights reserved.
1 Source: Bloomberg, Atlanta Fed. S&P 500 represented by SPX Index. As of September 15, 2023.
2 Source: Bloomberg. ‘Long-run average’ as represented by 10-year average. As of September 15, 2023.
3 Source: Bloomberg, Bureau of Labor Statistics. As of September 18, 2023.
4 Source: Bureau of Labor Statistics. As of September 18, 2023.
5 Source: Bloomberg. As of September 18, 2023.
6 Source: Bloomberg. As of September 09, 2023.
7 Source: BlackRock, Bloomberg. S&P 500 represented by SPX Index; S&P 500 technology sector represented by S5INFT Index. As of September 15, 2023. Index performance is for illustrative purposes only. Index performance does not reflect any management fees, transaction costs or expenses. Indexes are unmanaged and one cannot invest directly in an index. Past performance does not guarantee future results.
8 Source: Bloomberg. S&P 500 Index represented by SPX Index. As of September 10, 2023.
9 Source: Bloomberg. Equity market volatility as represented by VIX Index. As of September 15, 2023.
10 Source: BlackRock, Bloomberg. S&P 500 represented by SPX Index. As of September 18, 2023.
11 Source: Bloomberg. Crude represented by Generic 1st Crude Oil, WTI Index, energy equities represented by S5ENRS Index. As of September 10, 2023. Indexes are unmanaged and one cannot invest directly in an index. Past performance does not guarantee future results.
12 Source: Refinitiv Eikon. Industrials represented by S5INDU Index. As of September 15, 2023. The price-to-earnings ratio is used to assess a company's valuation.
13 Source: Refinitiv Eikon. Information technology represented by S5INFT Index. As of September 18, 2023.
14 Source: Bloomberg. Utilities represented by S5UTILS Index. As of September 18, 2023. Indexes are unmanaged and one cannot invest directly in an index. Past performance does not guarantee future results.
15 Source: Bank of America. As of September 09, 2023.
16 Source: BlackRock, Bloomberg. Rate cut futures represented by US0AFR MAY2024 Index. As of August 04, 2023.
17 Source: BlackRock, Bloomberg. As of September 10, 2023.
18 Source: Bloomberg, Bureau of Labor Statistics. As of September 15, 2023.
19 Source: BlackRock, Bloomberg. As of September 15, 2023.
20 Source: BlackRock, Markit. ETF groupings determined by Markit. As of September 10, 2023.
21 A basis point (bps) is one hundredth of one percent (e.g. one basis point = 0.01%).
22 Source: Bloomberg. As of September 14, 2023.
Carefully consider the Funds' investment objectives, risk factors, and charges and expenses before investing. This and other information can be found in the Funds' prospectuses or, if available, the summary prospectuses, which may be obtained by visiting the iShares Fund and BlackRock Fund prospectus pages. Read the prospectus carefully before investing.
Investing involves risk, including possible loss of principal.
International investing involves risks, including risks related to foreign currency, limited liquidity, less government regulation and the possibility of substantial volatility due to adverse political, economic or other developments. These risks often are heightened for investments in emerging/ developing markets or in concentrations of single countries.
There can be no assurance that performance will be enhanced or risk will be reduced for funds that seek to provide exposure to certain quantitative investment characteristics ("factors"). Exposure to such investment factors may detract from performance in some market environments, perhaps for extended periods. In such circumstances, a fund may seek to maintain exposure to the targeted investment factors and not adjust to target different factors, which could result in losses.
The iShares Minimum Volatility Funds may experience more than minimum volatility as there is no guarantee that the underlying index's strategy of seeking to lower volatility will be successful.
There can be no guarantee that the Fund will be successful in its strategy to provide downside protection against Underlying ETF losses. The Fund does not provide principal protection or non-principal protection, and, despite the Approximate Buffer (the “Buffer”), an investor may experience significant losses on their investment, including the loss of their entire investment. A blended portfolio of Expiring Options and New Options during a Rebalance Period will impact the Fund’s ability to realize the full benefit of the Buffer or may subject the Fund’s return to an upside limit that is slightly lower or higher than the Approximate Cap (the “Cap") for the applicable Hedge Period. Accordingly, investors may bear losses against which the Buffer is anticipated to protect and be subject to an upside limit that is lower than the Cap. In the event an investor purchases Fund shares after a Hedge Period begins or sells Fund shares prior to the end of the Hedge Period, the returns realized by the investor will not match those that the Fund seeks to provide. In periods of extreme market volatility, the Fund’s return may be subject to downside protection significantly lower than the Buffer and an upside limit significantly below the Cap. A new cap is established during each Rebalance Period and is dependent upon current market conditions. As such, the Cap is likely to change, sometimes significantly, from one Hedge Period to the next.
The Fund invests in FLEX Options that derive their value from the Underlying ETF. FLEX Options are subject to counterparty risk, which is the risk that the other party in the transaction will not fulfill its contractual obligation, and may be less liquid than other securities. The value of FLEX Options may be affected by interest rate changes, dividends, actual and implied volatility levels of the Underlying ETF’s share price, and the remaining time until the FLEX Options expire. Because of these factors, the Fund’s NAV may not increase or decrease at the same rate as the underlying ETF’s share price.
Diversification and asset allocation may not protect against market risk or loss of principal.
Specific companies or issuers are mentioned for educational purposes only and should not be deemed as a recommendation to buy or sell any securities. Any companies mentioned do not necessarily represent current or future holdings of any BlackRock products. For actual fund holdings, please visit the respective fund product pages.
Fixed income risks include interest-rate and credit risk. Typically, when interest rates rise, there is a corresponding decline in the value of debt securities. Credit risk refers to the possibility that the debt issuer will not be able to make principal and interest payments.
Non-investment-grade debt securities (high-yield/junk bonds) may be subject to greater market fluctuations, risk of default or loss of income and principal than higher-rated securities.
An investment in the Fund is not insured or guaranteed by the Federal Deposit Insurance Corporation or any other government agency and its return and yield will fluctuate with market conditions.
TIPS can provide investors a hedge against inflation, as the inflation adjustment feature helps preserve the purchasing power of the investment. Because of this inflation adjustment feature, inflation protected bonds typically have lower yields than conventional fixed rate bonds and will likely decline in price during periods of deflation, which could result in losses. Government backing applies only to government issued securities, and does not apply to the funds.
An investment in fixed income funds is not equivalent to and involves risks not associated with an investment in cash.
Funds that concentrate investments in specific industries, sectors, markets or asset classes may underperform or be more volatile than other industries, sectors, markets or asset classes and than the general securities market.
Commodities' prices may be highly volatile. Prices may be affected by various economic, financial, social and political factors, which may be unpredictable and may have a significant impact on the prices of commodities.
There is no guarantee that dividends will be paid.
There can be no assurance that an active trading market for shares of an ETF will develop or be maintained.
This material represents an assessment of the market environment as of the date indicated; is subject to change; and is not intended to be a forecast of future events or a guarantee of future results. This information should not be relied upon by the reader as research or investment advice regarding the funds or any issuer or security in particular.
The strategies discussed are strictly for illustrative and educational purposes and are not a recommendation, offer or solicitation to buy or sell any securities or to adopt any investment strategy. There is no guarantee that any strategies discussed will be effective.
The information presented does not take into consideration commissions, tax implications, or other transactions costs, which may significantly affect the economic consequences of a given strategy or investment decision.
This material contains general information only and does not take into account an individual's financial circumstances. This information should not be relied upon as a primary basis for an investment decision. Rather, an assessment should be made as to whether the information is appropriate in individual circumstances and consideration should be given to talking to a financial professional before making an investment decision.
The information provided is not intended to be tax advice. Investors should be urged to consult their tax professionals or financial professionals for more information regarding their specific tax situations.
The Funds are distributed by BlackRock Investments, LLC (together with its affiliates, "BlackRock").
The iShares Funds are not sponsored, endorsed, issued, sold or promoted by Bloomberg, BlackRock Index Services, LLC, Cboe Global Indices, LLC, Cohen & Steers, European Public Real Estate Association (“EPRA® ”), FTSE International Limited (“FTSE”), ICE Data Indices, LLC, NSE Indices Ltd, JPMorgan, JPX Group, London Stock Exchange Group (“LSEG”), MSCI Inc., Markit Indices Limited, Morningstar, Inc., Nasdaq, Inc., National Association of Real Estate Investment Trusts (“NAREIT”), Nikkei, Inc., Russell, S&P Dow Jones Indices LLC or STOXX Ltd. None of these companies make any representation regarding the advisability of investing in the Funds. With the exception of BlackRock Index Services, LLC, who is an affiliate, BlackRock Investments, LLC is not affiliated with the companies listed above.
Neither FTSE, LSEG, nor NAREIT makes any warranty regarding the FTSE Nareit Equity REITS Index, FTSE Nareit All Residential Capped Index or FTSE Nareit All Mortgage Capped Index. Neither FTSE, EPRA, LSEG, nor NAREIT makes any warranty regarding the FTSE EPRA Nareit Developed ex-U.S. Index, FTSE EPRA Nareit Developed Green Target Index or FTSE EPRA Nareit Global REITs Index. “FTSE®” is a trademark of London Stock Exchange Group companies and is used by FTSE under license.
©2023 BlackRock, Inc or its affiliates. All Rights Reserved. BLACKROCK, iSHARES, iBONDS, ALADDIN and the iShares Core Graphic are trademarks of BlackRock, Inc. or its affiliates. All other trademarks are those of their respective owners.
iCRMH0923U/S-3123612
This post originally appeared on the iShares Market Insights.
For further details see:
iShares Fall 2023 Investment Directions